UNIVERSITÀ DEGLI STUDI DI SASSARI
CORSO DI DOTTORATO DI RICERCA IN SCIENZE BIOMEDICHE
Coordinatore del Corso: Prof. Andrea Fausto Piana
CURRICULUM IN GENETICA MEDICA
Responsabile di Curriculum: Prof.ssa Margherita Maioli
XXX CICLO
Comparison of effects on immunity and
autoimmunity of impairment of SH2B3 gene
function in humans and mice
Coordinatore:
Prof. Andrea Fausto Piana
Tutor:
Prof. Francesco Cucca Co-Tutors:
Dott.ssa M. Francesca Manchinu Dott.ssa Valeria Orrù
Tesi di dottorato di Dott.ssa Ester Musu
CONTENT
RATIONALE ... 3
Preliminary data from humans ... 6
INTRODUCTION ... 9 EXPERIMENTAL DESIGN ... 13 MATERIALS AND METHODS ... 14 Mouse model ... 14 DNA extraction ... 14 Genotyping ... 14
Flow cytometry measurements ... 15
Complete blood count (CBC) ... 19
Immunoglobulin isotyping assay ... 19
Statistical analysis ... 20
RESULTS ... 22
DISCUSSION ... 34
REFERENCES ... 38
RATIONALE
The genetic and physiological similarities between mice and humans have led to dedicate a remarkable attention on murine models in the biomedical research, due to their usefulness as models of human health and disease.
Their employment in biomedical research has had a considerable impact after the advent of genetic engineering, which allowed creating genetically modified mice, in order to reproduce human diseases in the murine models. These animal models represent a powerful tool for the study of molecular and cellular mechanisms that underlie pathological conditions and, most importantly, a tool by which it is possible to test new therapies, allowing to improve the current treatments and minimizing any possible risks related to drugs.
The main advantages of mice are their small size, little space and resources to maintain them, as well as their short gestation times (19-21 days), rapid development to adulthood (they reach sexual maturity at 5-6 weeks of age) and their high reproduction rate (Bryda, 2013). But the most advantage of the mice employment in the biomedical research is that they are a rich genetic resource: approximately 99% of mouse genes have a homologue in the human genome (Waterston RH et al, 2002).
I developed my PhD career at the Institute for Genetic and Biomedical Research (IRGB), directed by Professor Francesco Cucca, who is a leader in the genetic dissection of complex diseases, especially autoimmune diseases.
The aim of my PhD study is to identify molecular and cellular origins of both immunodeficiency and autoimmunity disease and understand the biological mechanisms that are implicated in immunosenescence by the analysis of a knock-out (KO) mouse, SH2B3 deficient mouse, as model of autoimmunity. The study includes the comparison of SH2B3 KO mouse with a group of human carriers of a
specific genetic variant in the SH2B3 gene, also considering the impact of age on immune cell levels.
Immunosenescence is defined as the decline of immune responses with age, characterized by dysregulated immune responses, leading to more severe consequences of bacterial and viral infections and reduced responses to vaccination (Montgomery RR and Shaw AC, 2015). Beginning with the sixth decade of life, the human immune system reduces the ability to protect against infections and cancer, but, conversely, inflammatory response gains in intensity and duration, rendering older individuals susceptible to tissue-damaging immunity and inflammatory disease (Weyand CM and Goronzy J, 2016). Paradoxically, the conditions of immunodeficiency and inappropriate immune response are present in aged population at the same time.
In order to study mouse models for genes of particular interest in autoimmunity and immunosenescence, we combined different information available from the ProgeNIA/SardiNIA Project (a longitudinal study of genetics and epidemiology for ageing-related traits and diseases) and the Autoimmunity Case-Control Project [a case-control study of Multiple Sclerosis (MS) and Type 1 Diabetes (T1D) focused on ~10,000 individuals of the general population, where ~3,500 MS and ~2,000 T1D patients are crossed to ~3,500 healthy controls, with at least three Sardinian grandparents], both conducted at IRGB. In particular, a recent study carried out in our Institute (Orrù V et al, 2013) demonstrated that specific immune cell levels and specific diseases are both associated with the same genetic signals, suggesting the involvement of those cells in disease predisposition. More specifically, the circulating levels of 95 immune cell populations, encompassing a total of 272 immune cellular traits have been measured by flow cytometry in 2870 genetically characterized individuals. To identify the genetic variation accounting for the assessed traits, a sequencing-based Genome-Wide Association Study (GWAS) has been performed, assessing 8.2 million variants. 23 independent variants at 13 loci
were found associated with at least one trait; notably, four loci overlapped with genetic variants known to be associated with autoimmune diseases (Orrù V et al, 2013).
Among the overlapping associations identified, we selected the missense mutation rs3184504 (C>T) in SH2B3 gene, which in humans increases the levels of helper T cells and lymphocytes (Orrù V et al, 2013) and it is also known to be associated with a variety of diseases including type 1 diabetes (Todd JA et al , 2007) (Plagnol et al, 2011), chronic inflammatory diseases as ankylosing spondylitis, Crohn's disease, psoriasis, primary sclerosing cholangitis, ulcerative colitis (Ellinghaus D et al, 2016), rheumatoid arthritis (Stahl EA, 2010), celiac disease (Trynka G et al, 2012), multiple sclerosis (International Multiple Sclerosis Genetics Consortium-IMSGC, 2009), ischemic stroke and coronary artery disease (Dichgans M et al, 2014), increase of systolic and diastolic blood pressure (International Consortium for Blood Pressure Genome-Wide Association Studies, 2011) (Levy D et al, 2009).
The non-synonymous SNP rs3184504 (C>T) is localized in the exon 3 of the SH2B3 gene, (Chr.12q24) and leads to an amino acid change (Arg262Trp) in the pleckstrin homology domain of SH2B3 protein. The C allele (Arg) is conserved within closely related species and the risk allele T (Trp) is common in Europeans (46–52%), but virtually absent in African or Asian populations (<1% in HapMap data) (International Multiple Sclerosis Genetics Consortium-IMSGC, 2009).
Despite its association with immune-related disorders, the genetic variant rs3184504 presents evidence for recent positive selection in Europeans (Barreiro LB and Quintana-Murci L, 2010), including Sardinians. Positive selection refers to selection acting upon newly arisen or previously rare advantageous mutations that quickly increased in frequency due to specific driving force(s). As a consequence of this rapid change in frequency, haplotypes containing the favoured allele result in general more extended with respect to haplotypes containing the alternate allele, due to a lower impact of genetic recombination. Thus, extended haplotypes around a
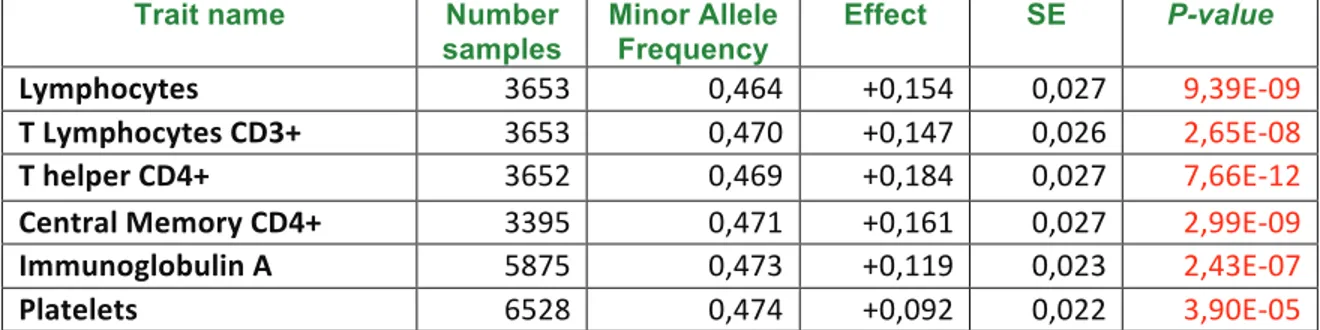
Trait name Number samples Minor Allele Frequency Effect SE P-value Lymphocytes 3653 0,464 +0,154 0,027 9,39E-09 T Lymphocytes CD3+ 3653 0,470 +0,147 0,026 2,65E-08 T helper CD4+ 3652 0,469 +0,184 0,027 7,66E-12 Central Memory CD4+ 3395 0,471 +0,161 0,027 2,99E-09 Immunoglobulin A 5875 0,473 +0,119 0,023 2,43E-07 Platelets 6528 0,474 +0,092 0,022 3,90E-05 Table 1. Immune traits associated with rs3184504-T in the SardiNIA cohort. From left to right are: the trait name (column 1), the number of assessed individuals (column 2), the frequency of the rs3184504-T (column 3), its effect on the trait (column 4), the corresponding standard deviation (SE; column 5), and P-value (column 6); the significant P-value are in red; significant threshold: P<3,33E-04 applying Bonferroni correction.
The same immune traits were stratified into four age intervals: 18-40 years old, 41-60 years old, 61-80 years old and over 80 years old. Notably, total lymphocytes, T helper lymphocytes, central memory CD4+ and platelets diminished with increasing age, whereas the IgA augmented, as shown in Table 2.
Trait name beta (40,60) beta (60,80) beta (80,103) P-value (40,60) P-value (60,80) P-value (80,103) Lymphocytes -2,569 -4,166 -7,370 2,07E-13 1,4E-25 1,65E-20 T Lymphocytes CD3+ -2,293 -4,117 -7,334 2,3E-18 7,19E-43 1,1E-34 T helper CD4+ -1,726 -3,335 -7,520 8,63E-10 2,78E-25 9,97E-32 Central Memory CD4+ -0,238 -0,903 -2,416 2,37E-02 3,44E-14 4,03E-24 Immunoglobulin A 0,415 0,698 0,679 1,55E-48 5,63E-91 9,08E-12 Platelets -0,067 -0,341 -0,604 2,27E-02 3,39E-22 1,57E-09
Table 2. Age stratification of immune trait levels in the SardiNIA cohort. Traits indicated in the first column are measured in the SardiNIA volunteers at age intervals of 40-60, 60-80, 80-103 years and compared with individuals of 20-40 years. Beta indicates the effect of ageing on traits at each age range assessed, while P-values correspond to the statistical significance; the significant P-values are in red (significant threshold: P<3,33E-05, applying Bonferroni correction).
The effects of rs3184504-T on immune traits indicate a reduction of the SH2B3 function resulting in lowered negative control of hematopoiesis, lymphopoiesis and
megakaryopoiesis; for this reason, we believe that the SH2B3 KO mouse is an appropriate model to simulate the genetic variant effect in an experimental model, as it reproduces, even emphasizing the total lack of SH2B3, the reduction of gene function. The presence of an experimental animal model is a necessary investigation tool, by which it is possible to study in vivo the conditions and mechanisms that underlie the abovementioned autoimmune diseases, as well as the development of therapeutic strategies to prevent and improve them.
INTRODUCTION
SH2B3 (also named Lnk) is a member of the SH2-B (Src homology 2-B) protein family containing SH2B1 and SH2B2, originally named SH2-B and APS (adaptor protein with PH and SH2 domains), respectively (Devallièrea J and Charreaua B, 2011). Adaptors are proteins lacking an enzymatic activity or other direct effector functions. They can be transmembrane proteins, as they reside in the cytoplasm under resting conditions and they can be recruited to the membrane upon activation. Alternatively, they can be localized in intracellular compartments such as the endoplasmic reticulum or lipid rafts. Regardless of their cellular localization, adaptor proteins possess an array of binding sites and modules that allow them to mediate specific protein–protein and protein–lipid interactions (Velazquez L, 2012). SH2B3 is structurally composed of a number of functional domains, including a carboxyl-terminal Src homology 2 (SH2) domain, which is essential for specific binding to phosphotyrosine residue, a pleckstrin homology (PH) domain, which recognizes phosphoinositides and controls protein translocation to the cell membrane, proline-rich regions, dimerization domain (DD) and several putative tyrosine phosphorylation motifs (Devallièrea J and Charreaua B, 2011). It is mainly expressed in hematopoietic cells and tissues, notably in hematopoietic stem cells (HSCs), in myeloid and lymphoid progenitors (Velazquez L, 2012) and in lymphocytes (Takaki S et al, 1997).
The generation of mice and cell lines deficient for SH2B3 has helped to establish the physiological role for SH2B3 in the hematopoietic system. Two of the main signalling pathways where SH2B3 has proved to be a key negative regulator are the Stem Cell Factor (SCF)/Kit and the thrombopoietin (TPO)/Mpl pathways; these cytokines are crucial for the development, proliferation, migration and survival of progenitors (HSCs, hematopoietic and endothelial) and mature cells (mast cells and megakaryocytes/platelets) (Velazquez L, 2012).
Stem cell factor (also known as SCF, KIT-ligand, KL, or steel factor) is a cytokine that plays critical roles in proliferation, survival, migration, and function of hematopoietic progenitor and mast cells through binding to Kit receptor (Simon C et al, 2008).
Activation of Kit, a type III receptor tyrosine kinase, stimulates cellular responses such as the proliferation, survival, differentiation, chemotaxis and cell adhesion. When binding to its receptor Kit, SCF induces the dimerization or oligomerization of Kit, leading to the activation of its intrinsic kinase activity. The activated receptor becomes autophosphorylated at tyrosine residues that serve as docking sites for signal transduction molecules containing SH2 domains, including Grb2-associated binder 2 (Gab2) and phosphatidylinositol-3 kinase (PI3K); these recruit interacting molecules to nucleate signalling complexes to activate multiple pathways including PI3K, phospholipase C, protein kinase C, the Ras/mitogen-activated protein kinase (MAPK) cascade, and the Janus activated kinase/signal transducers and activators of transcription (JAK-STAT) pathway (Okayama Y and Kawakami T, 2006). Other phosphotyrosine (pY) residues serve as docking sites for Src homology 2 (SH2) domain–containing proteins such as SH2B3, in which the SH2 domain is critical for its association with Kit tyrosine kinase receptor, while the PH domain is indispensable for its localization in the plasma membrane (Takizawa H et al, 2006); by binding with Kit receptor, SH2B3 down-regulates SCF-induced proliferation with attenuation of MAPK and kinase signalling (Simon C et al, 2008).
Velazquez and colleagues showed that SH2B3 deficient bone marrow-derived mast cells (BMMCs) displayed increased SCF-dependent migration compared with wild-type cells, revealing SH2B3-mediated inhibitory function and demonstrating that SH2B3, through its binding to Kit tyrosine 567, negatively modulates specific SCF-dependent signalling pathways involved in the proliferation and migration of primary hematopoietic cells (Simon C et al, 2008).
(TPO) signalling in megakaryocytes (Tong W and Lodish HF, 2004) and the erythropoietin (EPO) signalling in erythroblasts (Tong W et al, 2005), in which upon receptor-ligand binding (TPO/Mpl and EPO/EPOr), JAK2 autophosphorylation occurs, leading to activation of downstream signalling such STAT proteins; these proteins dimerize and translocate to the nucleus, where they activate transcription of target genes involved in a variety of cellular processes, including proliferation, differentiation, and apoptosis (Kisseleva T et al, 2002).
To establish the role for SH2B3 in the hematopoietic system, the SH2B3 deficient mouse has been generated (Takaki S et al, 2000) (Velazquez L et al, 2002). Interestingly, this mouse model displays an accumulation of B lineage cells caused by overproduction of Pro-B cells and hematopoietic stem cells, which confirmed SH2B3 inhibitory role in Kit and Mpl signalling pathways. In particular, Takaki et al. generated a SH2B3 knock-out mouse and showed that SH2B3 gene constrains production of B cells. Indeed the absence of SH2B3 resulted in a substantial accumulation of B-lineage cells in the bone marrow (Pro-B, Pre-B and Immature B cells) and in the spleen (Pre-B and B cells) of SH2B3 KO mice, whereas T cell development was unaffected. Also, serum levels of IgM, but not other immunoglobulin isotypes, were substantially elevated in SH2B3 KO mice (Takaki S et al, 2000). Later Velazquez group also generated a SH2B3 deficient mouse and showed, by histological analysis and flow cytometry, an abnormal accumulation of erythroid cells, megakaryocytes, and B lymphocytes in different hematopoietic compartments of SH2B3 deficient mice, indicating a defect in lymphoid and myeloid homeostasis. Importantly, they showed profound splenomegaly with excessive fibrosis; extensive extramedullary hematopoiesis; increase of megakaryocytes, erythrocytes and B220+ (also named CD45R+); rise of B220+ and megakaryocytes in bone marrow; peripheral augmentation of white blood cell counts, lymphocytes, monocytes, neutrophils and circulating platelet levels in SH2B3 knock-out compared with wild-type (WT) mice. Nevertheless, they did not observe any difference in T
cell lineages (Velazquez L et al , 2002). A year later, Takaki et al generated a transgenic mouse overexpressing SH2B3, resulting in both B and T cell reduction, in Pro-B cells reduction in bone marrow, and in Pro-T cells impairment in thymus, suggesting a function of SH2B3 in controlling also T lymphocyte production and function (Takaki S et al, 2003).
Overall, these data showed that SH2B3 is an important negative regulator of lymphopoiesis, megakaryopoiesis, erythropoiesis and HSC proliferation by moderating growth factor and cytokine receptor-mediated signalling. Considering its crucial role in hematopoisesis and its involvement in autoimmunity, we believe that
SH2B3 KO mouse requires further investigation to better understand its contribution in autoimmunity and its possible use as prognostic marker and therapeutic target.
EXPERIMENTAL DESIGN
The main aims of this study are three:
i) To compare the levels of specific immune traits in SH2B3 KO mice versus WT mice,
ii) To compare the data obtained from mice with those obtained from humans, iii) To stratify mouse immune traits in five age ranges:
! 2-3 months old that reproduce about 18 years old of man ! 6-7 months old reproducing about 40 years old of man ! 10-11 months old reproducing about 60 years old of man ! 14-15 months old reproducing about 80 years old man ! Over 18 months old that reproduce centenarian man.
These aims are pivotal to better understand the cellular mechanisms in which the
SH2B3 gene is involved and how these mechanisms change over time.
The study includes the following assessments:
! Analysis of a wide range of immune cell types in mice peripheral blood by flow cytometry;
! Complete blood count (CBC) of peripheral leukocytes, lymphocytes, monocytes, granulocytes and platelets by Hematology Analyzer MS4;
! Immunoglobulin Isotyping Assay to estimate IgA, IgE, IgG1, IgG2a, IgG2b, IgG3 and IgM in mice blood serum.
MATERIALS AND METHODS Mouse model
Knock-out mice (strain C57BL/6) characterized by insertion of neomycin phosphotransferase cassette (Neo) in the SH2B3 gene, were bought from the Riken Bio Resource Center (Japan). Wild-type mice (strain C57BL/6) were used as control. The project has been authorized by “Ministero Della Salute”, authorization n°1140/2016PR.
DNA extraction
Genomic DNA was isolated from mice tails. Tails pieces were incubated at 55 °C for 3 hours with Proteinase K in Sodium Chloride-Tris-EDTA (STE) Buffer. The purification was performed with Isopropanol and 70% Ethanol. After isolation, the DNA was dissolved in ultra-pure water.
Genotyping
Genotypes were determined by polymerase chain reaction (PCR) from genomic DNA using a pair of primers on the SH2B3 gene
(SH2B3/Fw 5’-TCAAAGCCCAAGCTCCAAGAG-3’;
SH2B3/Rev 5’-ATCCATCGCCTGTGGCATGGAACC-3’) and a primer on the neomycin gene
(Neo/Fw 5’-CAGGATCTCCTGTCATCTCACCTT-3’) to discriminate between WT and SH2B3 KO mice.
PCR analysis was performed preparing a mix with H2O, 19,5 ul for each DNA sample (0,5 ul; sample concentration ≈ 1ug/ul) and reaction components; a PCR Kit (KAPA Biosystems) was used for each sample, as follows:
PCR Buffer with MgCl2 10X 2,5 ul
dNTP 2,5 mM: 0,5 ul Taq Polymerase: 0,2 ul
The DNA primers (Sigma-Aldrich) were added into the mix as follows:
primer SH2B3/Fw 60ng/ul: 0,6 ul primer SH2B3/Rev 60ng/ul: 0,6 ul primer Neo/Fw 60ng/ul: 0,6 ul
The reaction was carried out in the Gene Amp PCR system 9600 thermocycler, at following reaction conditions:
Temperature (C°) Time (sec)
94 180
94 30*
64 30*
72 120*
72 300
* repeated for 30 cycle
The PCR products were visualised by agarose gel electrophoresis with SYBR® safe staining (Invitrogen) at UV trans-illuminator Uvitec.
The WT band size is 1800 bp, whereas SH2B3 KO size is 600 bp.
Flow cytometry measurements
Blood was stained using fluorochrome-conjugated antibodies and analysed by flow cytometry (FACS Canto I, BD Biosciences). Flow cytometry is a technique used to
measure physical and fluorescent characteristics of cells. In detail, cells are stained using fluorochrome-conjugated antibodies, suspended in a fluid and injected into the flow cytometer instrument. As soon as cells pass through the focused laser beam, they scatter the laser light in all direction. The light that scatters roughly in the same direction as the laser beam is called forward scatter (FSC); the light that scatters roughly perpendicular to the laser beam is called side scatter (SSC). FSC and SSC intensities are related to certain physical properties of cells:
• FSC—indicates relative differences in the size of the cells or particles
• SSC—indicates relative differences in the internal complexity or granularity of the cells or particles.
Lasers also excites fluorescent antibodies used to stain cells and each antibody emits to specific wavelengths allowing one laser to excite many fluorochromes, each with a different wavelength emission, which is always longer than the excitation wavelength emanating by lasers. This scatter light and fluorescence is collected, filtered, then converted by the detectors into an electrical signal that can be processed by the electronics system and displayed as dot plots. The FACS Canto I analyser used for the present project is characterized has 2 lasers that emit at 488 nm (blue) and 633 nm (red) and detect 8 parameters: 6 fluorescence and 2 scatter parameters.
To detect immune cell populations in the SH2B3 KO mouse model, 3 florescent-antibody panels were designed (see below). All fluorochrome-conjugated antibodies were bought from Miltenyi Biotec.
Panel 1:
CD45-PE, mouse, clone 30-F11, for total leucocytes; CD45R-APC, mouse, clone RA3-6B2, for B cells;
CD3e-APC-Vio770, mouse, clone 145-2C11, for T cells;
CD8a-FITC, mouse, clone 53-6.7, for cytotoxic T lymphocytes;
Panel T:
CD3e-APC-Vio770, mouse, clone 145-2C11, for T cell;
CD4-PerCP-Vio700, mouse, clone GK1.5, for T helper lymphocytes; Anti-FoxP3 Vio515, mouse, clone REA788, for Regulatory T cells; CD8a-PE-Vio770, mouse, clone 53-6.7, for cytotoxic T lymphocytes; CD44-PE, mouse, clone IM7.8.1, with
CD62L-APC, mouse, clone MEL14-H2.100, for distinction in Naive, Central Memory and Effector Memory T lymphocytes.
Panel B:
Panel 1
BD Trucount tubes and Lyse no Wash protocol was used to calculate blood leukocyte actual counts. In detail, 50 ul of whole blood collected in EDTA tubes were transferred to the BD Trucount tubes in reverse pipetting. Afterwards, the fluorochrome-conjugated antibodies mix - previously prepared using 2 ul of each fluorochrome-conjugated antibody - was added. The sample was incubated in the dark at room temperature (RT) for 15 minutes and then 1 ml of 1X BD FACS lysing solution was added and incubated at RT for 30 minutes to remove red blood cells. Samples were then acquired on the flow cytometer.
CD45R-APC-Vio770, mouse, clone RA3-6B2; CD19-FITC, mouse, clone 6D5;
Anti-IgD-APC, mouse, clone 11-26c.2a ; Anti-IgM-PerCP-Vio700, mouse, clone X-54;
for distinction in B cells, Pro-B and Pre-B cells, Immature B cells, Early Mature B cells, Late Mature B cells and Plasmablast.
Panel T
This panel was used to stain T lymphocytes from blood following Lyse-Wash protocol as manufacturer instruction. Briefly, whole peripheral blood (100 ul with 7 ul of EDTA) was incubated with 2 ml of 1X BD FACS lysing solution for 15 minutes at RT to remove red blood cells and then washed with 2 ml of wash solution BD FACSFlow. Each sample was resuspended in 100 ul of BD FACSFlow and stained with 2 ul of each fluorochrome-conjugated antibody previously mixed except anti-FoxP3-Vio515. Sample was incubated at 4°C in the dark for 30 minutes, then washed with 2 ml of BD FACSFlow, fixed with 1 ml of BD Fixation/permeabilization solution and permeabilized with 2 ml of BD Permeabilization Buffer 1X. 3ul of Anti-FoxP3-Vio515 were added to the sample and incubated at 4°C in the dark for 30 minutes. Finally, cells were washed, resuspended in 300 ul of FACSFlow and analysed by FACS Canto I.
Panel B
This panel was used to assess B cells from blood following Lyse-Wash protocol. Peripheral blood (100 ul with 7 ul f EDTA) was processed with 2 ml of 1X BD FACS lysing solution to remove red blood cells. The samples were then incubated at RT in the dark for 15 minutes, washed with 2 ml of BD FACSFlow and centrifuged to subsequently remove the supernatant. Each sample was resuspended in 100 ul of BD FACSFlow and 2 ul of each fluorochrome-conjugated antibody previously mixed was added to the sample. The sample was incubated at 4°C in the dark for 30 minutes, then washed with 2 ml of BD FACSFlow. The sample was centrifuged at 300 g for 5 minutes at 4°C. Supernatant was removed; the sample was resuspended in 300 ul of FACSFlow and analysed on FACS Canto I.
Complete blood count (CBC)
100 ul of mice blood were drawn and mixed with 7ul of EDTA. The sample was analysed by the Hematology Analyzer MS4 that detectes leukocytes, lymphocytes, monocytes, granulocytes and platelets as absolute count (cells/mm3 of blood) and as
percentage of parental cells. Results were automatically displayed once the counting was complete.
Immunoglobulin isotyping assay
Immunoglobulins - IgA, IgE, IgG1, IgG2a, IgG2b, IgG3 and IgM - were measured in mice blood serum by ProcartaPlex Mouse Antibody Isotyping kit (Invitrogen) and the Bio-Plex MAGPIX multiplex Reader (Bio-Rad). Assay was performed as follows:
Blood serum was separated from 50 ul of whole blood sample that clotted for 15-20 minutes at RT; then centrifuged at 1,200 RPM for 15 minutes at RT. The serum fraction was collected and diluted 1:10,000-fold in Universal Assay Buffer (1X). Mouse Isotyping Standard Mix (Antigene Standard) was prepared and added to Antibody Magnetics Beads. 50 ul of Antibody Magnetic Beads were added to each well of a black 96-well Greiner Microplate, with 25 ul of Universal Assay Buffer (1X) and 25 ul of sample or controls. The plate was incubated at RT for 60 minutes, then 25 ul of Mouse Isotyping Detection Antibody Mix was added and incubated for 30 minutes at RT; finally the beads were washed and resuspended in 120 ul of Reading Buffer. After 5 minutes, data were acquired by Bio-Plex MAGPIX multiplex Reader.
The Bio-Plex MAGPIX multiplex Reader utilizes xMAP technology licensed from Luminex Corporation to permit the multiplexing of up to 100 different assays within a single sample. This technique involves 100 distinctly stained bead sets created by the use of two fluorescent dyes at distinct ratios. The use of different stained beads enables the simultaneous multiplex detection of many analytes in the same sample. In particular, color-coded beads, pre-coated with analyte-specific capture antibody
for the molecule of interest, are added to the sample. Analyte-specific antibodies capture the analyte of interest. Afterwards, biotinylated detection antibodies specific to the analyte of interest are added and form an antibody-antigen sandwich. Finally, a fluorescent reporter dye label (Phycoerythrin (PE)-conjugated Streptavidin) is added to the sample. The beads are read on a dual-laser flow-based detection instrument where one laser classifies the bead and determines the analyte that is being detected and the second laser determines the magnitude of the PE-derived signal, which is proportional to the amount of bound analyte.
Statistical analysis
All immunological traits analysed for both WT and SH2B3 KO mice are shown in Table 3 (see below). Statistical differences between means were calculated with parametric Student’s t-test and was confirmed by non-parametric Wilcoxon test, comparing the medians. Bonferroni correction was applied for the correction of multiple testing. TRAIT PHENOTYPES (cell markers) PARENTAL CELLS GRANPAREN-TAL CELLS PANEL 1 Leukocytes CD45+ - -
B Lymphocytes (B Cells) CD45R+ Lymphocytes Leukocytes T Lymphocytes (T Cells) CD3+ Lymphocytes Leukocytes T Helper Cells (Th) CD4+ T Lymphocytes Lymphocytes Cytotoxic T Cells (CTL) CD8+ T Lymphocytes Lymphocytes
PANEL T
T Lymphocytes (T Cells) CD3+ Lymphocytes Leukocytes T Helper Cells (Th) CD4+ T Lymphocytes Lymphocytes Naive CD4+ T Cells CD62L+CD44-CD4+ T Helper Cells T Lymphocytes Central Memory (CM) CD4+ T Cells CD62L+CD44+CD4+ T Helper Cells T Lymphocytes Effector Memory (EM) CD4+ T Cells CD62L- CD44+ CD4+ T Helper Cells T Lymphocytes
TRAIT PHENOTYPES (Cell markers) PARENTAL CELLS GRANPAREN-TAL CELLS
Regulatory T Cells (Tregs) FoxP3+ CD4+ T Helper Cells T Lymphocytes Cytotoxic T Cells (CTL) CD8+ T Lymphocytes Lymphocytes Naive CD8+ T Cells CD62L+ CD44- CD8+ Cytotoxic T Cells T Lymphocytes Central Memory (CM) CD8+ T Cells CD62L+ CD44+ CD8+ Cytotoxic T Cells T Lymphocytes Effector Memory (EM) CD8+ T Cells CD62L- CD44+ CD8+ Cytotoxic T Cells T Lymphocytes
PANEL B
B Lymphocytes (B Cells) CD19+CD45R+CD45R- Lymphocyte Leukocytes CD19+CD45R+IgM-IgD- B Lymphocytes Lymphocyte Immature/Transitional B Cells CD19+CD45R+IgM+IgD- B Lymphocytes Lymphocyte Early Mature B Cells CD19+CD45R+IgM+IgD+ B Lymphocytes Lymphocyte Late Mature B Cells CD19+CD45R+IgM-IgD+ B Lymphocytes Lymphocyte Plasmablast CD19+ CD45R- B Lymphocytes Lymphocyte
C.B.C Leukocytes - Leukocytes - Lymphocytes - Leukocytes - Monocytes - Leukocytes - Granulocytes - Leukocytes - Platelets - Leukocytes -
IMMUNOGLOBULIN ISOTYPING ASSAY
IgA - - - IgE - - - IgG1 - - - IgG2a - - - IgG2b - - - IgG3 - - - IgM - - -
Table 3. Analysed immune traits list. In the first column are indicated the immune traits analysed. In second, third and fourth column are indicated the corresponding cell markers, the parental cells and the grandparental cells respectively.
RESULTS
The main objective of the study is the comparison of the immune cell traits of the murine SH2B3 KO model with human traits, in particular with a group of individuals selected to carry a specific allelic variant positioned in the SH2B3 gene, the rs3184504-T variant; on the same cell traits the impact of age was also considered. In the human study, indeed, we noted that some immune trait levels were increased in blood of individuals carrying the genetic variant rs3184504-T. These traits include total lymphocytes, T lymphocytes CD3+, T helper lymphocytes CD4+, central memory CD4+, immunoglobulin A (IgA) and platelets (Orrù V et al, 2013, unpublished results, shown in Table 1); also we noted an ageing-related decline in the same cell populations, except for the IgA (Table 2). For this reason, we evaluated if the levels of the same trait could have an increase in SH2B3 KO mouse compared to WT mouse and if other immune traits could increase due to
P-value P-value P-value P-value
WT 6/7 vs 2/3 10/11 vs 2/3 14/15 vs 2/3 over 18 vs 2/3
Leukocytes 0,905 0,022 0,070 0,258
Lymphocytes 0,693 0,041 0,852 0,107
Monocytes 0,400 2,69E-04 5,51E-04 2,52E-04
Granulocytes 0,464 0,016 3,12E-05 1,34E-05
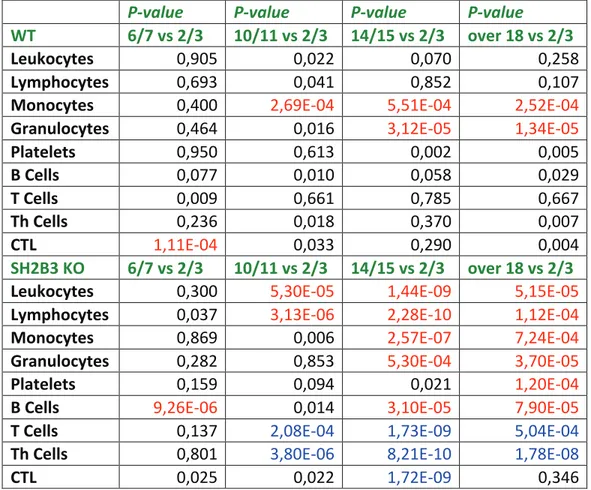
Platelets 0,950 0,613 0,002 0,005 B Cells 0,077 0,010 0,058 0,029 T Cells 0,009 0,661 0,785 0,667 Th Cells 0,236 0,018 0,370 0,007 CTL 1,11E-04 0,033 0,290 0,004 SH2B3 KO 6/7 vs 2/3 10/11 vs 2/3 14/15 vs 2/3 over 18 vs 2/3
Leukocytes 0,300 5,30E-05 1,44E-09 5,15E-05
Lymphocytes 0,037 3,13E-06 2,28E-10 1,12E-04
Monocytes 0,869 0,006 2,57E-07 7,24E-04
Granulocytes 0,282 0,853 5,30E-04 3,70E-05
Platelets 0,159 0,094 0,021 1,20E-04
B Cells 9,26E-06 0,014 3,10E-05 7,90E-05
T Cells 0,137 2,08E-04 1,73E-09 5,04E-04
Th Cells 0,801 3,80E-06 8,21E-10 1,78E-08
CTL 0,025 0,022 1,72E-09 0,346
Table 4. P-values of the traits analysed for ageing shown in figure 9, 10 and 11. Traits indicated in the first column are measured in WT and SH2B3 KO mice at 2/3, 6/7, 10/11, 14/15, and over 18 months old. The reference age range is 2/3 months old. Significant P-values (P<0,001, applying Bonferroni correction) are indicated in red when the trait increases with ageing and in blue when it decreases. The number of mice using for each time point are indicated in figure 7 and 8.
DISCUSSION
The alterations of blood immune cell populations detected in individuals carrying the non-synonymous allele rs3184504-T, located in the SH2B3 gene, is an example of genetic regulation of specific immune cell levels. Notably, this genetic variant is also predisposing for autoimmune diseases and other disorders (Orrù V et al, 2013). The analysis of the SH2B3 KO mouse confirmed a close link between the levels of blood immune cells and the SH2B3 protein. As expected, the silencing of SH2B3 in the KO mouse model has stronger and wider effect on the immune traits compare to the reduced function caused by the studied missense SH2B3 variant in humans. In the SH2B3 KO mouse, the silencing of the protein causes a total absence of its negative regulation of hematopoiesis, lymphopoiesis and megakaryopoiesis, as shown by a significant increase of monocytes, granulocytes, lymphocytes, and platelets (Figure 2). It suggests a role of SH2B3 already in blood cell precursors, such as common myeloid progenitor and common lymphoid progenitor. In humans, individuals carrying the rs3184504-T allele showed a significant increase of specific cell traits, especially T lymphocytes, T helper lymphocytes, central memory CD4+ cells, IgA and platelets; however, differently to what we found in the KO mouse, where both B cells and T cells (T helper and cytotoxic T cells) were increased (Figure 3), we did not observe any change in B cell levels in humans. It means that the human missense mutation has a cell-specific function, while the SH2B3 activity in mice is much broader and includes B cell regulation. Considering these observations, we believe that the KO model helps us to define the role of the SH2B3 gene, but not to clarify the specific effect of the allelic variant rs3184504-T. As the corresponding amino acid change occurs in the pleckstrin homology domain (Todd JA et al, 2007), which controls protein translocation to the cell membrane (Devallièrea J and Charreaua B, 2011), we believe that the substitution is pivotal in
the cell-specificity of SH2B3 function. Moreover, different effects in human and mouse on B and T cells by SH2B3 could be explained by the fact that in humans T cells are higher compared to B cells, while the mouse strain C57BL/6, on which the
SH2B3 KO mouse was created, is characterized by a greater amount of B cells compared to T cells (B cells: 67% ± standard deviation (SD); T helper cells: 13,3% ±SD; CTLs: 7,7% ±SD of total lymphocytes) (Chen J and Harrison DE, 2002). Focusing on the impact of age on immune traits in the two mouse models, we observed that WT mice showed only a significant rise of monocytes and granulocytes during senescence, while CTLs increased only at 6-7 months, and then they decreased and remained stable. The other traits analysed, such as leukocytes, lymphocytes, B cells, T helper cells did not show significant changes with age (Figure 9B, 10, Table 4). Similarly, granulocytes and monocytes increased during senescence in the SH2B3 KO mouse, while differently from the WT model, T cells decreased and B cells increased during ageing (Figure 9-10, Table 4). It results in the fact that the increment of B cells in SH2B3 KO vs WT is stable and significant in the 5 age ranges assessed (Figure 8), while the increment of T cells in SH2B3 KO vs WT becomes not significant for helper and cytotoxic T cells at 10-11, 14-15 and over 18 months old (Figure 8, Figure 10, Table 4). Overall, SH2B3 KO mice are characterized by a strong dysregulation in the considered immune cell levels during ageing with some cells significantly increasing and other decreasing with ageing, indicating an age effect that, in conjunction with SH2B3 silencing, leads to a very important disequilibrium of immune populations, including platelets (Figure 9, 10, 11). In humans these immune traits generally decrease with age (except for monocytes), whereas in the WT mouse the majority of them remain stable.
Another interesting aspect is the role of SH2B3 in the immune cells maturation both in B and in T cells. During the development of B cells, from pro-B cells to plasmablasts, we noted an increased amount of pro-B, pre-B, immature and late mature B cells in SH2B3 KO compared to the WT mouse. The early mature B cell
levels showed no significant difference between the two models, probably indicating a greater tendency of SH2B3 KO B cells to the rapid maturation compared to WT B cells (Figure 5). Similarly, in murine T cells, we observed a significant reduction of naive subsets (both CD4+ and CD8+) in the SH2B3 KO compared to the WT mouse, whereas the effector memory were increased in the KO mouse. This suggests that T cell maturation stages from naive to effector memory occur faster in absence of
SH2B3 (Figure 6). Interestingly, central memory CD4+ lymphocytes, which in humans were increased in carriers of the rs3184504-T allele, did not increase in the
SH2B3 KO mouse. This could happen because the central memory cells are much lower in mice compared to humans, alternatively, because central memory cells are mainly localized in lymphoid organs in mice (Bergmann B et al, 2013).
The significant raise of B cells, especially plasmablasts (Figure 5) could also explain the increase of immunoglobulin sub-classes, such as IgA, IgE, IgG2a, IgG2b and IgM, in the SH2B3 KO mouse compared to WT (Figure 4). In contrast, in individuals carrying the rs3184504-T allele, we only observed an increase of IgA levels, while the others immunoglobulin classes were not affected.
Our intent for the immediate future is a further stratification over time of the B and T cell subtypes, as well as of the immunoglobulin classes, which needs further number ofmice to be studied.
All cell populations detected so far have been analysed by mouse blood samples. To have a more complete picture of the SH2B3 function in different districts of the organism, we are currently working on immune cells isolated from lymphoid organs such as bone marrow, thymus, spleen and lymph nodes.
Moreover, to better understand the role of rs3184504, further future study will be focused on the generation of two humanised knock-in murine models carrying the two rs3184504 alleles. These models will be very useful to study the effect of the SNP in both blood and organs. The functional study of physiological and pathological changes mediated by rs3184504-T in animal models may suggest
therapeutic strategies targeting SH2B3, where both the genetic background and the effect of age will be considered.
REFERENCES
Barreiro LB and Quintana-Murci L. (2010). From evolutionary genetics to human immunology: how selection shapes host defence genes. Nature Reviews Genetics, 11, 17 30.
Bergmann B et al. (2013). Memory B Cells in Mouse Models. Scandinavian Journal of
Immunology, 78, 149 156.
Bryda EC. (2013). The Mighty Mouse: The Impact of Rodents on Advances in Biomedical Research. Mo Med., 110 (3), 207–211.
Chen J and Harrison DE. (2002). Quantitative trait loci regulating relative lymphocyte proportions in mouse peripheral blood. Blood, 99 (2).
Devallièrea J and Charreaua B. (2011). The adaptor Lnk (SH2B3): An emerging regulator in vascular cells and a link between immune and inflammatory signalling. Review. Biochemical Pharmacology, 82, 1391 1402.
Dichgans M et al. (2014). Shared genetic susceptibility to ischemic stroke and coronary artery disease – a genome-wide analysis of common variants. Stroke, 45 (1), 24 36. Ellinghaus D et al. (2016 ). Analysis of five chronic inflammatory diseases identifies 27 new associations and highlights disease-specific patterns at shared loci. Nat Genet., 48 (5), 510–518.
International Consortium for Blood Pressure Genome-Wide Association Studies. ( 2011). Genetic Variants in Novel Pathways Influence Blood Pressure and Cardiovascular Disease Risk. Nature, 478 (7367), 103 109.
International Multiple Sclerosis Genetics Consortium-IMSGC. (2009). The expanding genetic overlap between multiple sclerosis and type 1 diabetes. Genes Immun., 10 (1), 11 14.
Kisseleva T et al. (2002). Signaling through the JAK/STAT pathway, recent advances and future challenges. Review. Gene, 285 (1-2), 1 24.
Levy D et al. (2009). Genome-wide association study of blood pressure and hypertension. Nat Genet., 41 (6), 677 687.
Montgomery RR and Shaw AC. (2015). Paradoxical changes in innate immunity in aging: recent progress and new directions. J Leukoc Biol, 98 (6), 937-943.
Okayama Y and Kawakami T. (2006). Development, Migration, and Survival of Mast Cells. Immunol Res., 34 (2), 97 115.
Orrù V et al. (2013). Genetic Variants Regulating Immune Cell Levels in Health and Disease. Cell, 155, 242–256.
Plagnol et al. (2011). Genome-wide association analysis of autoantibody positivity in type 1 diabetes cases. PLoS Genet., 7 (8), e1002216.
Simon C et al. (2008). Lnk adaptor protein down-regulates specific Kit-induced signalling pathways in primary mast cells. Hematopoiesis And Stem Cells, Blood, 112 (10). Stahl EA. (2010). Genome-wide association study meta-analysis identifies seven new rheumatoid arthritis risk loci. Nat Genet., 42 (6), 508 514. Steri MS et al. (2017). Overexpression of the Cytokine BAFF and Autoimmunity Risk. The New England Journal Medicine, 376, 1615 1626.
Takaki S et al. (1997). Characterization of Lnk; An Adaptor Protein Expressed In Lymphocytes. The Journal Of Biological Chemistry, 272 (23), 14562 14570.
Takaki S et al. (2000). Control of B Cell Production by the Adaptor Protein Lnk: Definition of a Conserved Family of Signal-Modulating Proteins. Immunity, 13, 599 609.
Takaki S et al. (2003). Impaired lymphopoiesis and altered B cell subpopulations in mice overexpressing Lnk adaptor protein. J Immunol., 170, 703 710.
Takizawa H et al. (2006). Enhanced engraftment of hematopoietic stem/progenitor cells by the transient inhibition of an adaptor protein, Lnk. Blood, 107 (7), 2968 2975.
Todd JA et al . (2007). Robust associations of four new chromosome regions from genome-wide analyses of type 1 diabetes. Nat Genet., 39 (7), 857–864.
Tong W and Lodish HF. (2004). Lnk inhibits Tpo-mpl signaling and Tpo-mediated megakaryocytopoiesis. J Exp Med., 200, 569 580.
Tong W et al. (2005). Lnk inhibits erythropoiesis and Epo-dependent JAK2 activation and downstream signaling pathways. Blood, 105 (12), 4604 4612.
Trynka G et al. (2012). Dense genotyping identifies and localizes multiple common and rare variant association signals in celiac disease. Nat Genet., 43 (12), 1193 1201.
Velazquez L et al . (2002). Cytokine Signaling and Hematopoietic Homeostasis Are Disrupted in Lnk-deficient Mice. J. Exp. Med., 195 (12), 1599 1611.
Velazquez L. (2012). The Lnk Adaptor Protein: A Key Regulator of Normal and Pathological Hematopoiesis. Review. Arch. Immunol. Ther. Exp., 60, 415 429.
Voight BF et al. (2006). A Map of Recent Positive Selection in the Human Genome.
PLoS Biology, 4 (3), e72.
Waterston RH et al. (2002). Initial sequencing and comparative analysis of the mouse genome. 2002; 420:520–62. Nature (420), 520-562.
Weyand CM and Goronzy J. (2016). Aging of the Immune System Mechanisms and Therapeutic Targets . Ann Am Thorac Soc., 13 (Suppl 5), S422-S428.