Type I interferon-mediated autoin
flammation due
to DNase II de
ficiency
Mathieu P. Rodero et al.
Microbial nucleic acid recognition serves as the major stimulus to an antiviral response,
implying a requirement to limit the misrepresentation of self nucleic acids as non-self and the
induction of autoinflammation. By systematic screening using a panel of interferon-stimulated
genes we identify two siblings and a singleton variably demonstrating severe neonatal
ane-mia, membranoproliferative glomerulonephritis, liver
fibrosis, deforming arthropathy and
increased anti-DNA antibodies. In both families we identify biallelic mutations in
DNASE2,
associated with a loss of DNase II endonuclease activity. We record increased interferon
alpha protein levels using digital ELISA, enhanced interferon signaling by RNA-Seq analysis
and constitutive upregulation of phosphorylated STAT1 and STAT3 in patient lymphocytes
and monocytes. A hematological disease transcriptomic signature and increased numbers of
erythroblasts are recorded in patient peripheral blood, suggesting that interferon might have
a particular effect on hematopoiesis. These data de
fine a type I interferonopathy due to
DNase II de
ficiency in humans.
DOI: 10.1038/s41467-017-01932-3
OPEN
Correspondence and requests for materials should be addressed to Y.J.C. (email:[email protected]) #A full list of authors and their affliations appears at the end of the paper
123456789
I
n 1989, Charles Janeway predicted the existence of
pattern-recognition receptors (PRRs) serving to detect microbial
molecular motifs distinct from self as a fundamental aspect of
immunity
1. Such motifs, which must be evolutionarily essential to
the microbe so that they are not easily mutated for the
‘purpose’
of escaping a host immune response, are now recognized to
include constituents of the bacterial cell wall and the nucleic acid
component of viruses. In a vindication of the Janeway hypothesis,
a number of PRRs have been identified, including those that
detect nucleic acids in endosomal (TLR, Toll-like receptors) and
cytosolic (particularly, RIG-I, retinoic-acid-inducible gene I;
MDA5, melanoma differentiation-associated protein 5; AIM2,
absent in melanoma 2; cGAS, cyclic GMP-AMP synthase) cellular
compartments
2. Indeed, it has become clear that most antiviral
responses are initiated by innate immune receptors that detect
viral nucleic acids, immediately raising the question as to how a
cell discriminates between self and non-self, given that the basic
molecular structure of DNA and RNA is conserved across
spe-cies
3,4. Study of the function of these receptors has shed light on
this issue, with their physical separation from self nucleic acids,
c
f
e
d
I-1 I-2 II-3 II-4 II-1 II-2 III-3 III-4 IV-1 IV-2 V-1 V-2 V-3 V-4 Mut/Mut nd Mut/Mut Wt/Wt Mut/Wt Mut/Wt nd nd nd nd nd nd nd nd F1 III-1 III-2 nd nda
I-1 I-2 II-4 Mut/Mut Mut/Wt Mut/Wt F2 Mut/Wt Wt/Wt Mut/WtII-1 II-2 II-3
b
g
50 μm 50 μm
Fig. 1 Clinicalfindings associated with bilallelic mutations in DNASE2. a Pedigrees of families F1 a and F2 b. Circles and squares indicate female and male family members respectively. Black symbols represent family members with a homozygous mutation inDNASE2. Mut mutation, Wt wild-type, ND genotype not determined. F1:V-2 denotes a fetus delivered in late pregnancy with hydrops fetalis, hepatosplenomegaly and petechiae.c
Membranoproliferative glomerulonephritis seen on renal biopsy (×40) of F1:V-3 at age 6 years in the absence of features of lupus nephritis. There is increased lobulation and cellularity (stars) of the mesangial matrix associated with double contours (arrows). Similarfindings were present in F2:II-4. d Liverfibrosis on biopsy (x20) of F1:V-3 at age 8 years. Similar features were also present in F2:II-4. e Non-destructive, deforming arthropathy seen in F2:II-4 beginning at age 8 years.f Vasculitic lesion on the foot of F2:II-4 at age 13 years. g Patchy, sub-cortical white matter lesions in the parietal lobes recorded on FLAIR imaging in F1:V-3 at age 8 years, and which were also observed in F2:II-4
the differential modification of endogenous vs. exogenous nucleic
acids, thresholds of receptor tolerance for endogenous nucleic
acid species and systems of self nucleic acid elimination all
con-tributing to ensure self non-immunogenicity
5. However, the
observation of human autoimmune and autoinflammatory states
indicates that these systems are not perfect, with the Mendelian
type I interferonopathies
6,7, for example due to loss-of-function
of the cytosolic DNase TREX1 signaling through the DNA sensor
cGAS and its adapter molecule stimulator of interferon genes
(STING)
8–12, highlighting the potential for type I interferon
induction by self-derived nucleic acid.
Using a screening assay to identify previously uncharacterized
inborn errors of immunity associated with enhanced type I
interferon signaling
13, 14, we ascertain three patients from two
unrelated families demonstrating a spectrum of clinical features
including resolving neonatal anemia, membranoproliferative
Table 1 Clinical details of the three affected individuals with biallelic mutations in
DNASE2
F1:V-1 F1:V-3 F2:II-4
Gender (relationship)
Female (sister of F1:V-3) Male (brother of F1:V-1) Male
Current age 10 years 8 years 17 years
Current growth status
Height-0.2 SD; weight-0.7 SD Height-2.2 SD; weight-0.9 SD Height-5.95 SD; weight-4.39 SD Features at
presentation
Neonatal HSM, cholestatic hepatitis and pancytopenia requiring multiple RBC and platelet transfusions
Neonatal HSM, cholestatic hepatitis and pancytopenia requiring multiple RBC and platelet transfusions
Neonatal HSM, cholestatic hepatitis and pancytopenia requiring multiple RBC and platelet transfusions
Hematological status
Resolving neonatal pancytopenia; mild thrombocytopenia and neutropenia from age 10 years
Neonatal pancytopenia resolving by age 1 month; persistence of a mild thrombocytopenia withfluctuating neutropenia, and an episode of pancytopenia at age 4 years followed by progressive non-regenerative normocytic anemia from 7 years of age requiring recurrent blood transfusions
Neonatal pancytopenia resolving by age 2–3 months; normocytic anemia noted at age 8 years; bone marrow analysis showed normal cell composition but reduced cell numbers, considered indicative of inflammatory damage
Recurrent fevers Starting at age 7 years, typically lasting 48 h, associated with raised ESR but essentially normal CRP
Starting at age 5 years, typically lasting 48 h, associated with raised ESR but essentially normal CRP
Starting at age 5 years, typically lasting 4–5 days, associated with swollen and painful knees, elbows, feet, wrists, raised ESR and CRP
Postnatal hepatic disease
HSM present at age 7 years with increased liver stiffness (no biopsy performed)
Longstanding HSM withfibrotic changes noted on biopsy at age 5 years
Liver biopsies performed in the neonatal period (cholestatic hepatitis), and then at the age of 3 (‘possible cirrhosis’) and 8 years (fibrosis in the absence of active inflammatory infiltrates); normal fibroscan recorded at 17 years of age
Renal status Proteinuria recorded at age 10 years, presumed secondary to MGN but not biopsied
MGN without features of SLE at age 6 years (immunofluorescence staining negative for IgA, IgM, C3 and C1q)
Proteinuria with features of MGN diagnosed at age 8 years; normal values of C3 and C4; proteinuria no longer apparent at age 14 years, although renal biopsy showed immunocomplex deposition with abundant C1q accumulation
Neurological status
Developmentally normal Normal early motor and cognitive milestones, now demonstrating moderate learning difficulties at school; cranial MRI at age 8 years showing patchy sub-cortical white matter hyperintensities on T2 weighted imaging, and possible subtle calcification in the basal ganglia
Headaches and mild learning difficulties; cranial MRI at age 15 years showing small sub-cortical white matter hyperintensities on T2 weighted imaging
Joint disease None None Non-destructive deforming arthropathy
beginning at age 8 years, particularly affecting the knees, hips, elbows and wrists, hands and temporo-mandibular joints, which has been refractory to broad-spectrum
immunosuppression, IL-1 receptor, anti-IL-1β and anti-TNFα therapies
Immune status Normal;fluctuating significant elevation of anti-DNA antibodies
Transient B-cell lymphopenia at birth, recurring at age 4 years, with frank hypogammaglobulinemia from 7 years of age requiring IVIG; progressive CD4+and CD8+ lymphopeniafirst recorded at age 6 years; fluctuating significant elevation of anti-DNA antibodies
Mild lymphopenia;fluctuating significant elevation of anti-DNA antibodies
Endocrinological status
Normal IDDM from age 5 years (negative for GAD, IA2, Langerhans islet and anti-ZnT8 antibodies)
Reduced response to arginine suggestive of growth hormone deficiency noted at age 17 years
Skin involvement None None Lipodystrophy of the limbs and chilblain-like
lesions of the hands and feet since the age of 13 years
Current status and treatments
Clinically asymptomatic but exhibits mild thrombocytopenia, neutropenia and proteinuria, as well as continued upregulation of ISGs and ESR; not currently treated, but due to start MMF and steroids in view of persistent proteinuria
Dependent on immunosuppression for renal disease; MMF, low dose steroids, IVIG replacement therapy, insulin, and RBC transfusions
Continued joint disease with Cushingoid features and failure to thrive, without signs of puberty; hydroxychloroquine, mepacrine, abatacept and low-dose steroids
CRP C-reactive protein; ESR erythrocyte sedimentation rate; HSM hepatosplenomegaly; IDDM insulin-dependent diabetes mellitus; ISGs interferon-stimulated genes; IVIG intravenous immunoglobulin; MGN membranoproliferative glomerulonephritis; MMF mycophenolate mofetil; MRI magnetic resonance imaging; NR not recorded; RBC red blood cell; SLE systemic lupus erythematosus
glomerulonephritis, liver
fibrosis, deforming arthropathy and
increased anti-DNA antibodies. We present data to show that the
disease in these patients is due to biallelic loss-of-function
mutations in DNASE2, encoding the lysosomal endonuclease
DNase II, leading to an autoinflammatory state including
mark-edly enhanced type I interferon signaling. DNase II plays a central
role in the clearance of nucleic acids generated through apoptosis
and the phagocytosis of maturating erythroblast nuclei, so that
the absence of DNase II in mice leads to a chronic activation of
type I interferon signaling mediated through the cGAS STING)
pathway
15. As such, the cases presented here further emphasize
the pathological consequences of dysregulated nucleic acid
sen-sing in the human context.
Results
Clinical phenotype. By systematic screening of patients with
putative inflammatory phenotypes, we ascertained a female–male
sibling pair born to consanguineous parents of Algerian ancestry
(Fig.
1
a), and a singleton born to a European Italian couple who
were not knowingly related (Fig.
1
b), demonstrating increased
expression of a panel of six interferon-stimulated genes (ISGs)
(IFI27, IFI44L, IFIT1, ISG15, RSAD2, and SIGLEC1)
(Supple-mentary Figs.
1
and
2
). Clinical and laboratory details of the three
affected individuals are provided in Table
1
and Supplementary
Tables
1
–
5
. All three children demonstrated severe
non-regenerative anemia and thrombocytopenia at birth
necessitat-ing red blood cell and platelet transfusions, together with
hepa-tosplenomegaly and cholestatic hepatitis which resolved in the
first few weeks of life. All three patients also experienced
recur-rent fevers starting between 5 and 7 years of age, and the onset of
proteinuria between the ages of 6 and 10 years, with
membra-noproliferative glomerulonephritis documented in the younger
affected child from Family 1 (F1; F1:V-3) and the proband from
Family 2 (F2; F2:II-4) (Fig.
1
c). Both these children also
subse-quently developed hepatosplenomegaly with
fibrosis identified on
liver biopsy (Fig.
1
d and Supplementary Fig.
3
). F1:V-3 developed
antibody-negative insulin-dependent diabetes mellitus at 5 years
of age, as well as persistent non-regenerative anemia and
hypo-gammaglobulinemia necessitating repeated blood transfusions
and intravenous immunoglobulin beginning at 7 years of age.
Starting at 8 years of age, F2:II-4 experienced the onset of a
non-destructive, deforming arthropathy which has been refractory to
broad-spectrum immunosuppression, 1 receptor,
anti-IL-1β and anti-TNFα therapies (Fig.
1
e). At the age of 13 years, this
patient also developed vasculitic skin lesions (Fig.
1
f). F1:V-3 and
F2:II-4 were recorded to show non-specific sub-cortical white
matter lesions on cerebral imaging in the absence of overt
neu-rological signs, although F1:V-3 exhibited learning difficulties
necessitating extra help at school (Fig.
1
g). At the age of 10 years,
the oldest child from Family 1 (F1:V-I) is essentially clinically
asymptomatic, although she has recently developed significant
proteinuria. All three patients demonstrated a persistent increase
in erythrocyte sedimentation rate (ESR), whilst C-reactive protein
(CRP) levels were within the normal range in both affected
individuals from family F1 but more frequently elevated in F2:II-4
(Supplementary Fig.
4
). Serial testing also revealed
fluctuating
significant titers of anti-DNA antibodies in all three affected
individuals.
Genetic analysis and identi
fication of mutations in DNASE2.
We performed whole-exome sequencing using DNA from the
three patients and their parents, and we
filtered coding variants
against allele frequencies in public and local databases. We
recorded a homozygous c.347G>C variation in DNASE2 in the
two affected individuals from family F1, and a homozygous
c.362A>T variant in the same gene in the proband of family F2
(Fig.
2
a). Both sets of parents were heterozygous for the relevant
familial variant, and all four unaffected siblings from both
families were either homozygous or heterozygous wild type
(Supplementary Fig.
5
).
The c.347G>C transversion leads to the substitution of a
glycine for an alanine at amino acid position 116 (p.Gly116Ala/
G116A) of the human DNase II protein, whilst the c.362A>T
transversion results in the substitution of an aspartate by a valine
at position 121 (p.Asp121Val/D121V). The glycine residue at 116
and the aspartate residue at 121 are highly conserved (Fig.
2
b and
Supplementary Fig.
6
), and both substitutions, neither of which is
recorded on the gnomAD database comprising
>245,000 alleles at
these positions, are predicted as damaging according to a variety
of in silico algorithms (Supplementary Table
6
and
Supplemen-tary Fig.
7
).
The G at base 347 of the cDNA is the
first nucleotide of exon 4,
and is thus predicted to act as an acceptor for RNA splicing, a
process likely affected by the G>C transversion
16. Sequencing of
cDNA from peripheral blood mononuclear cells (PBMCs) of F1:
V-1 and F1:V-3 confirmed an in-frame deletion of exon 4,
encoding amino acids 116 to 171 (Fig.
2
c). In the two affected
siblings, gel electrophoresis of cDNA product amplified across
exon 4 of DNASE2 revealed a shorter band compared to controls,
as well as a faint type band. F1:IV-2 demonstrated a
wild-type band and a band at the same size as seen in her two affected
children, consistent with her heterozygous status (Fig.
2
d). qPCR
of cDNA using TAQman probes specific for exons 4 and 5 of
DNASE2 supported these data, suggesting a degree of leaky
splicing and the production of some non-deleted product in F1:
V-1 and F1:V-3 (Fig.
2
e). Furthermore, sequencing of the faint
band of wild-type size obtained by PCR of cDNA from F1:V-1
indicated the presence of full-length transcript including the
c.347G>C variant (Supplementary Fig.
8
). Western blot analysis
of macrophage-enriched cells from F1:IV-2 revealed only a single
band at the size of the full-length protein, indicating that the
deleted product was not translated or was unstable in this cell
type (Supplementary Fig.
9
). Sufficient material was not available
for a similar analysis in the affected patients, and blotting of
protein extracts derived from
fibroblasts did not produce
interpretable data.
Mutations in
DNASE2 result in a loss of DNase II activity. The
aspartate at position 121 falls within the N terminal
phospholi-pase D domain which, together with the histidine at position 130,
likely plays an important role in DNase II catalytic function
17.
Both of these residues are encoded by exon 4 of DNASE2, and
would therefore be absent in the mis-spliced transcripts resulting
from the c.347G>C mutation in family F1 (Supplementary
Fig.
10
). Expression in HEK293T cells of mutant constructs
lacking exon 4, or with the c.347G>C (Gly116Ala) or the
c.362A>T (Asp121Val) substitutions, was associated with
reduced levels of DNase II activity against circularized plasmid
DNA compared to controls (WT) (Fig.
3
a–c). Furthermore,
lysates of
fibroblasts from F1:V-1 and F2:II-4 demonstrated a
marked reduction of DNase II activity against the same substrate;
DNase II activity in these cells could be restored by expression of
constructs coding for wild-type protein (Fig.
3
d). Concordant
data were obtained after siRNA knockdown of DNASE2 in
control
fibroblasts (Supplementary Fig.
11
). Taken together, these
data provide validation of the pathogenicity of the DNASE2
variants recorded in each family.
Loss of DNase II activity induces interferon signaling. DNase II
null mice accumulate undigested DNA in the lysosomes of
macrophages which then chronically activates type I interferon
production to result in a lethal perinatal anemia
18–20. In contrast,
DNase2 knockout mice also lacking the type I interferon receptor
(Ifnar1) live beyond birth, but develop a cytokine-dependent
chronic polyarthritis
21, 22. Both the embryonic and post-natal
phenotypes are cGAS and STING-dependent
12,23.
Whole-genome expression analysis of RNA (RNA-Seq)
con-firmed the results of our screening assay, demonstrating a global
upregulation of ISGs in whole blood from F1:V-1 and F1:V-3 as
seen in patients with gain-of-function mutations in STING or loss
of TREX1 (DNase III) activity (Fig.
4
a and Supplementary
Table
7
). Combining high-affinity pan-interferon alpha
anti-bodies with single-molecule array (Simoa) digital ELISA
technol-ogy
24,25, we recorded increased levels of interferon alpha protein
in serum and plasma from all three patients, comparable to levels
observed in other type I interferonopathies
26(Fig.
4
b).
Over-expression of the ISGs IFIT1, IFI16 and IFI27 in unstimulated
patient
fibroblasts could be reversed by lentiviral transduction of
wild-type DNase II (Supplementary Fig.
12
), and siRNA
knock-down of DNASE2 in control
fibroblasts resulted in increased ISG
expression similar to that observed in patient cells
(Supplemen-tary Fig.
13
). As has been described for patients mutated in
TMEM173
26, an analysis of cultured cell subpopulations
indicated that monocytes were a major source of circulating
interferon (Fig.
4
c). Unstimulated CD3 positive T cells and CD14
positive monocytes demonstrated increased phosphorylation of
STAT1 and STAT3 (Fig.
4
d and Supplementary Fig.
14
).
Treatment of a cell fraction enriched for patient lymphocytes
(non-adherent cells) led to a reduction of STAT1 and STAT3
phosphorylation (Fig.
4
e), and a decrease in ISG expression in
G116A D121V H.sapiens GHTKGVLLLDHDGG P.troglodytes GHTKGVLLLDHDGG N.leucogenys GHTKGVLLFDHDGG R.norvegicus GHTKGVLLLDQEGG M.musculus GHTKGVLLLDQEGG C.familiaris GHTKGVLLLDQEGG X.laevis GHTKGMLLLDKKQG T.nigroviridis GHTKGVVLLDKHQG D.rerio GHTKGVVVFDKEQG
D.melanogaster GHAKGVVASDGETA
C.elegans GHTKGTIFFDGTSG
a
EXON 3 EXON 5
cDNA
Exon 3 Exon 4 Exon 5
Reference protein Predicted protein 2.5 2.0 1.5 RQ value 1.0 0.5 0.0
Control 1Control 2Control 3Control 4Control 5F1:IV-2 F1:V-1 F1:V-3
c.347G>C p.Gly116Ala 1 29 89 116 171 237 361 c.362A>T p.Asp121Val 1 2 3 4 5 6
b
c
d
e Control Control 3F1: V-1DNase2 –/– F1: V-3 DNase2 –/– F1: IV-2 DNase2 +/– Patients Mother GeneRuler 100 bp DNA ladder 400 200 600 500 300 100 700 800 900 1000 EXON 4 EXON 5 200 210 220Fig. 2 Geneticfindings associated with bilallelic mutations in DNASE2. a Intron/exon structure of the DNASE2 gene, with the splicing-out of exon 4 consequent upon the c.347G>C mutation indicated by the lines above the figure. Coding exons are represented by the black boxes, with the respective amino acid count given below each exon. The positions of the two homozygous mutations are shown.b A CLUSTAL Omega alignment of DNase II homologs illustrates the strict evolutionary conservation of the homozygous mutations identified in families F1 and F2 (boxed in red). c An
electropherogram of cDNA from peripheral blood mononuclear cells (PBMCs) of F1:V-I, illustrating the loss of exon 4.d Gel electrophoresis of cDNA product amplified across exon 4 of DNASE2 from a control, F1:V-1, F1:V-3 and 2 (the mother of the two affected individuals in this family). F1:IV-2 shows a wild-type band as observed in the control, and a smaller band as seen in her homozygous mutant offspring. A second, fainter, wild-type band is also present in the affected patients, best seen after longer exposure, likely representing a degree of leaky splicing.e qPCR of cDNA using a TAQman probe specific for exon 4 compared to a probe for exon 5 of DNASE2 supports this assertion, where a small amount of exon 4 message was detected in peripheral blood mononuclear cells (PBMCs) from F1:V-1 and F1:V-3
both adherent and non-adherent (monocyte and lymphocyte
enriched, respectively) cells (Fig.
4
f and Supplementary Figs.
14
and
15
).
Loss of DNase II activity results in an in
flammatory state.
Mouse data emphasize the induction of both interferon and
non-interferon-mediated inflammation in the absence of DNase II,
highlighting a role for TNFα, IL-1β, and IL-6 in the pathology of
the postnatal arthritis observed in the DNase2
−/−Ifnar1
−/−model
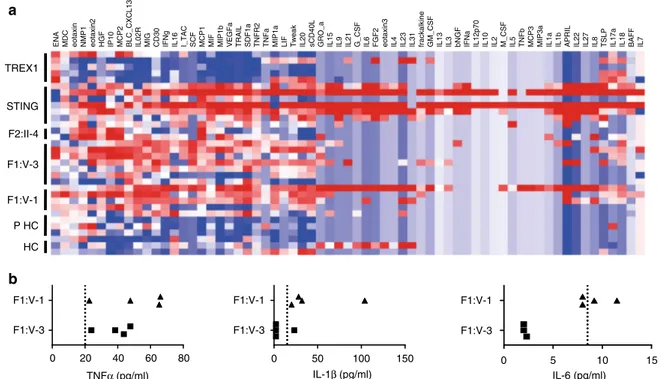
21,22. Multiplex analysis using serum from F1:V-1, F1:V-3
and F2:II-4 demonstrated an overlap of cytokine and chemokine
protein expression induced by loss of DNase II activity and
activation of STING, distinct from the inflammatory state related
to mutations in TREX1 (Fig.
5
a). Single analyte ELISA assays
using serum from F1:V-1 and F1:V-3 were consistent with the
multiplex analysis, suggesting consistently elevated protein levels
of TNFα in both patients, a more variable elevation of IL-1β, and
concentrations of IL-6 mostly reflecting normal physiological
levels (Fig.
5
b).
Effects of DNase II loss of function on erythropoiesis.
Mam-malian definitive erythropoiesis takes place in the fetal liver and
bone marrow, where macrophages digest nuclei extruded by
developing erythroblasts
27,28. DNase2 knockout mice die in late
embryogenesis or immediately after birth due to a severe anemia.
Analysis of fetal liver in these mice reveals the accumulation of
undigested DNA from erythroblasts, and in tissues where
apop-tosis occurs during development increased numbers of
macro-phages
filled with DNA are detected
18,19. In keeping with this, all
three children reported here demonstrated severe anemia and
thrombocytopenia at birth necessitating red blood cell and
pla-telet transfusions. Network pathway analysis of RNA-Seq data
obtained from F1:V-1 and F1:V-3, excluding over-expressed ISG
transcripts common to other type I interferonopathies,
high-lighted changes in the expression of genes related to
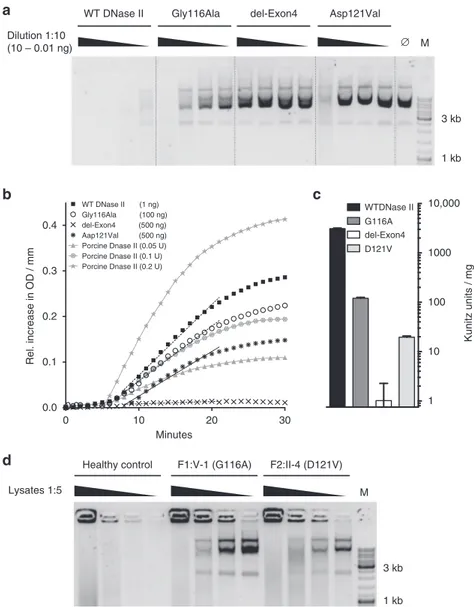
0.0 1 10 100 1000 WTDNase II del-Exon4 D121V
a
b
c
d
0 30 0.4 WT DNase II (1 ng) Gly116Ala (100 ng) del-Exon4 (500 ng) Aap121Val (500 ng) Porcine Dnase II (0.05 U) Porcine Dnase II (0.1 U) Porcine Dnase II (0.2 U)Healthy control F1:V-1 (G116A) F2:II-4 (D121V)
Lysates 1:5 M
WT DNase II Gly116Ala del-Exon4 Asp121Val
Dilution 1:10 (10 – 0.01 ng) ∅ M 3 kb 1 kb 1 kb 3 kb 10,000 Kunitz units / mg G116A 10 20 Minutes 0.3 0.2 0.1 0.0 Rel. increase in OD / mm
Fig. 3 Effect ofDNASE2 mutations on DNase II activity. a DNase II activity of constructs expressed in HEK293T cells against circularized plasmid DNA. Titration of purified protein incubated with plasmid DNA for 1 h. b Quantification of DNase II activity via absorption at 260 nm. The gray lines denote assay calibration with porcine DNase II.c DNase II activity is calculated via linear approximation according to the Kunitz protocol (WT 3108 Ku/mg; G116A 120 Ku/mg; del-Exon4 0 Ku/mg; D121V 19.57 Ku/mg). Linear approximation was performed with PRISM6. Data are shown as the mean± SD (n = 3). These data are representative of two independent experiments.d DNase II activity against circularized plasmid DNA recorded infibroblasts from F1:V-1 and F2:II-4 compared to cells from a healthy control, which could be rescued by transfection of a construct coding for wild-type (WT) protein
erythropoiesis compared to controls and patients with
gain-of-function mutations in STING (Fig.
6
a–c and Supplementary
Fig.
16
). Fresh blood samples from F1:V-1 and F1:V-3
demon-strated a marked increase in the percentage of circulating
ery-throblasts, whilst the number of reticulocytes was the same as in
controls (Fig.
6
d, e and Supplementary Fig.
17
). These features
were suggestive of ineffective erythropoiesis, as confirmed by
bone marrow cytology in F1:V-3 (Supplementary Table
8
). Of
note, examination of a liver biopsy from F1:V-3 revealed
increased numbers of Kupffer cells staining for hemosiderin,
indicating increased phagocytosis of red blood cells (Fig.
6
f).
Discussion
We describe here a multisystem autoinflammatory syndrome due
to biallelic hypomorphic mutations in DNASE2, the gene
encoding the 360 amino acid lysosomal DNase DNase II
29. Each
mammalian cell carries around 6 pg of nuclear DNA, and it has
0.1 HC
STING TREX1 F1:V-1 F1:V-3 F2:II-4 1 10 100 1000 10,000 100,000 1 IFI27 RSAD2 ISG15 IFI44L OTOF IFI44 CMPK2 OAS3 HES4 IFI6 LY6E IFIT3 OAS1 USP18 HERC5 XAF1 SIGLEC1 EPSTI1 OASL KLHDC7B CA1 EIF2AK2 EXOC3L1 MT2A TRIM22 ZCCHC2 LAMP3 OAS2 CXCL10 IRF7 PTPRN2 IFIT5 PARP9 ZBP1 RTP4 CTA-384D8.35 MX1 NEXN SOCS1 RP11–196G18.3 LGALS3BP SAMD9L BPGM RP1–34B20.4
DNASEII TREX1 STING HC IFIT2 TMCC2 PARP12 PARP14 SPATS2L IFIT1 2 3 4 5 6 7 8 9 10 11 12 13 14 0.1 1 10 100 1000 IFN α (fg/ml) STING F1:V-3 F1:V-1 STING DNASE2 + + + – – – – – – – TREX1 – – – + – – – + – – – + – – – + HC + – – – + – – – + – – – + – – – – – – + + – – – – – – + – – – + – – – + – –
T cells B cells NK cells Monocytes
HC F1:V-1 F1:V-1 + JKV Gated on CD3+ pSTAT1 pSTAT3 Gated on CD3+ HC F1:V-3 pSTAT3 Gated on CD3+ Gated on CD14+ Gated on CD3+ Gated on CD14+ pSTAT1 – – + 0 1 2 3 4 10 20 IFI44L – – + 0 1 2 3 4 5 ISG15 – – + 0.1 1 10 100 1000 10,000 IFI27 HC F1:V-3 F1:V-1 F2:II-4 JKV
a
b
c
d
e
f
1 1.5 0.8 0.8 0.6 0.4 0.2 1 0.5 0 0 0.6 0.4 0.2 0 0.8 0.6 0.4 0.6 0.4 0.3 0.2 0.1 0 0.2 0 0.4 0.2 0 103 104 105 103 104 105 0 102 103 104 0 102 103 104 % of gated 103 104 103 IFN α (fg/ml) % of gated RQ valuebeen estimated that in humans more than 1 g of cellular DNA is
eliminated and degraded each day
30. A series of elegant studies in
mice has shown that DNase II digests the DNA of apoptotic cells
and of nuclei expelled from erythroid precursors. DNase II null
mice accumulate DNA in the lysosomes of fetal liver Kupffer cells
and bone marrow macrophages
20, 27, which activates type I
interferon production resulting in a lethal anemia
18–20. Dnase2
knockout mice also lacking the type I interferon receptor
21, or
IRF3 and IRF7
31, live beyond birth, but develop a chronic
poly-arthritis. Importantly, these embryonic and post-natal
pheno-types are each rescued by crossing the DNase II null mouse
against mice defective in STING
23or cGAS
12, thus highlighting
the central role of TLR-independent cytosolic DNA signaling in
either situation.
All three children that we ascertained presented in the neonatal
period with life-threatening anemia and thrombocytopenia,
which resolved spontaneously within a few weeks of birth. A
similar pattern of hematological involvement has been noted in
patients with pseudo-infection syndromes due to loss-of-function
mutations in TREX1
32and USP18
33. Furthermore, studies in
mice have implicated endogenously produced type I interferon in
the depletion of hematopoietic progenitors during virus-induced
transient pancytopenia
34. These observations, together with the
experimental data presented here, including the
finding that
recombinant interferon alpha treatment of erythroid progenitors
derived from cord blood results in increased apoptosis
(Supple-mentary Fig.
18
), suggest a particular sensitivity of both murine
and human fetal erythropoiesis to the abnormal production of
type I interferon by DNase II-deficient macrophages. F1:V-3 also
developed a later-onset anemia necessitating repeated blood
transfusions. Of possible relevance, in both F1:V-1 and F1:V-3 we
observed increased numbers of circulating erythroblasts
sugges-tive of ineffecsugges-tive erythropoiesis, whilst circulating reticulocyte
counts were inappropriate for the level of circulating hemoglobin.
The mechanism by which loss of DNase II function disturbs adult
erythropoiesis will require further exploration.
The phenotype associated with biallelic mutations in DNASE2
is remarkable for its breadth. After the neonatal period, all three
patients experienced recurrent febrile episodes, and both F1:V-3
and F2:II-4 demonstrated
fibrosing hepatitis and
membrano-proliferative glomerulonephritis. Features seen in a single patient
include the deforming arthropathy and vasculitic skin lesions
affecting F2:II-4, while F1:V-3 developed autoantibody-negative
diabetes mellitus, hypogammaglobulinemia and later-onset
ane-mia necessitating long-term insulin replacement, intravenous
immunoglobulin and blood transfusions respectively. In marked
contrast to her younger brother, F1:V-I is essentially clinically
asymptomatic at the age of 10 years, although she has recently
developed significant proteinuria and demonstrates a chronic
elevation of ESR and interferon-induced gene transcripts.
Using a new digital ELISA assay, we recorded increased levels
of interferon alpha protein in serum and plasma from all three
patients with mutations in DNase II, and showed that cells from
these patients produce increased amounts of type I interferon and
demonstrate enhanced STAT1 phosphorylation. Concordantly,
we recorded a significant type I interferon signature by
genome-wide RNA-Seq analysis, similar to that observed in patients with
other type I interferonopathies. Although mouse data emphasize
the induction of both interferon and non-interferon-mediated
inflammation in the absence of DNase II, the post-natal murine
phenotype associated with DNase II deficiency in the context of
functional type I interferon signaling has not been defined. By
multiplex analysis we identified increased expression of a number
of cytokines in patient blood, with a similar pattern of expression
observed in patients with gain-of-function mutations in STING.
Thus, the relative contribution of interferon and non-interferon
dependent pathways to the disease reported here remains unclear.
F2:II-4 has experienced a severe deforming arthropathy possibly
reminiscent of the Dnase2
−/−Ifnar1
−/−mouse model
21. However,
whilst breeding of Dnase2
−/−Ifnar1
−/−mice on a TNFα or IL-6
null background, or treatment with a monoclonal antibody
against the IL-1 receptor, ameliorated the murine polyarthritis
phenotype
22, the use of biologics targeting TNFα and IL-1
sig-naling has shown minimal clinical efficacy in this patient. Of note,
significant joint involvement highly reminiscent of that observed
in F2:II-4 has been seen in patients with gain-of-function
muta-tions in MDA5
35(Supplementary Fig.
19
).
Beyond infection, systemic lupus erythematous (SLE) was the
first human disease to be associated with increased type I
inter-feron signaling
36, and mutations in three distinct DNases, DNase
I
37, DNase III (TREX1)
38and DNase1L3
39,40, have been reported
to predispose to the development of lupus. None of the patients
described here fulfill criteria for a diagnosis of SLE. However,
immunocomplex deposition with C1q accumulation was noted in
a renal biopsy of F2:II-4, and all three patients demonstrated
fluctuating elevations of anti-DNA antibodies. Given the current
young age of these patients, we cannot rule out the possibility that
they will develop a more complete lupus phenotype in the future.
The role of foreign nucleic acid in the induction of type I
interferon was recognized over 50 years ago
41. More recently, the
importance of mechanisms to avoid the mis-sensing of self
nucleic acid as non-self has been highlighted by the
character-ization of the Mendelian type I interferonopathies
3, 7. While
perinatal hematological disturbance, skin vasculitis and
non-deforming arthropathy have been observed in certain type I
interferonopathies, the disorder that we describe here represents a
distinct clinical syndrome. No test to assess type I interferon
status is currently available in routine medical practice, so that the
phenotypic spectrum associated with enhanced type I interferon
signaling will likely broaden as systematic screening, like that
employed here, enters the clinical sphere
13, 26. Phenotypic
dif-ferences do not rule out the possibility of a central role for
dis-turbed type I interferon signaling in these various disorders, but
might be explained by differential tissue and temporal expression.
Fig. 4 Interferon signaling in patients with mutations inDNASE2, STING and TREX1, and in controls. a Heat map derived from RNA-Seq expression data of the top 50 genes ranked byp value (DNASE2-mutated patients vs. controls) with the most significant at the top. 41 of these 50 genes are considered as interferon-stimulated. Lanes 1-14 show individual samples: Lane 1DNASE2 F1:V-1; lane 2 DNASE2 F1:V-3; lane 3 DNASE2 F1:V-3; lane 4 TREX1 P1; lane 5 TREX1 P2; lane 6 STING P1; lane 7 STING P2, lane 8 STING P3; lanes 9–14 individual healthy controls (HC). b Levels of interferon alpha (IFNα) protein assayed by digital ELISA in plasma or serum from healthy controls (HC:n = 20), patients with mutations in STING (n = 28 samples from 8 patients), patients with mutations inTREX1 (n = 4 samples from 4 patients), F1:V-1 (6 samples taken over 3 years), F1:V-3 (7 samples taken over 3 years) and F2:II-4 (2 samples taken over 3 years). Red lines indicate median values.c Analysis of IFNα production by cultured T cells, B cells, natural killer (NK) cells or monocytes from controls (HC;n = 4), and patients with mutations in DNASE2 (F1:V-1 1 sample; F1:V-3 2 samples), STING (n = 3) or TREX1 (n = 1). d Increased phosphorylation of STAT1 and STAT3 observed in unstimulated CD3 positive T cells and CD14 positive monocytes from total blood of F1:V-3 compared to a healthy control (HC).e Increased phosphorylation of STAT1 and STAT3 observed in cultured lymphocytic-enriched fractions from F1:V-1 compared to a healthy control (HC), treated or not with the JAK1/2 inhibitor ruxolitinib. Similar results were obtained with cells from F1:V-3.f Increased expression of selected interferon-stimulated genes in cell fractions enriched for lymphocytes from F1:V-1, F1:V-3 and F2:II-4 with or without ruxolitinibOn the other hand, the Dnase2
−/−mouse clearly indicates both
interferon and non-interferon dependent pathology, so that it is
possible that clinical differences between the disorders currently
classified as type I interferonopathies might also reflect
differ-ential involvement of distinct inflammatory pathways.
Clarifica-tion of these issues, including how closely individual mouse
models recapitulate their respective human genotypes, will likely
become of increasing relevance as therapies directly targeting type
I interferon signaling are developed
42–44.
Methods
Patient and study approval. The study was approved by the Comité de Protection des Personnes (ID-RCB/EUDRACT: 2014-A01017-40) in France, and the Comi-tato Indipendente di Bioetica, IRCCS Burlo Garofolo (19/2015; RC17/2014) in Italy. Investigations were undertaken with written informed parental consent, and the assent of the probands in both families.
Whole-exome sequencing. DNA was extracted from whole blood samples using an in-house salting out method. Agilent SureSelect libraries were prepared from 3 µg of genomic DNA extracted from leukocytes, sheared with a Covaris S2 Ultra-sonicator as recommended by the manufacturer. We used a 51 Mb SureSelect Human All Exon kit V5 (Agilent technologies) for exome capture, with multi-plexed molecular barcodes for sample traceability. Pooled barcoded exome libraries were then sequenced on a HiSeq2500 (Illumina) machine, generating 76 + 76 bp paired-end reads, followed by processing using Genome Analysis Toolkit (GATK), SAMtools, and Picard (http://www.broadinstitute.org/gatk/guide/topic?name= best-practices). Calls were made with the GATK HaplotypeCaller, and variants assessed using the in silico programs SIFT (http://sift.jcvi.org) and Polyphen2 (http://genetics.bwh.harvard.edu/pph2/), and population allele frequencies obtained from the ExAC (http://exac.broadinstitute.org) and gnomAD (http:// gnomad.broadinstitute.org) databases.
We have screened close to 1000 probands for an interferon signature, and performed over 2500 interferon signatures in total (as outlined in Rice et al.14). Not
every patient has had genetic analysis, and it is possible that we are not comprehensively ascertaining DNASE2-mutated patients because, for example, they are dying due to the perinatal hematological phenotype. However, the clinical scenario that we describe in this manuscript is apparently rare in our cohort.
Sanger sequencing. Sanger sequencing was performed on DNA from all three patients and their parents to confirm the DNASE2 variants found by exome sequencing. The reference sequence used for primer design and nucleotide num-bering was DNASE2 (NM_001375.2). The exonic regions andflanking intronic sites of the gene were amplified by polymerase chain reaction (PCR) using specific primers (eurofinsgenomics) designed with Primer3plus (http://www.
bioinformatics.nl/cgi-bin/primer3plus/primer3plus.cgi) (Family 1 primers: DNA-SE2_e3For TGGCCAGGCTGATTTCTAAC-3′ and DNASE2_e4Rev 5′-GACAAGGGGAGGAGGAAATG-3′; Family 2 primers: DNASE2_4For 5′-GTA-GAGATGGGGTTTCGCC-3′ and DNASE2_5Rev 5′-CAAGGGGAGGAG-GAAATGC-3′).
Liver histology. Fragments of core needle liver biopsy from F1:V-3 werefixed in buffered formalin, embedded in paraffin, cut into 3 µm thick sections and stained with hematoxylin, eosin, saffron, Perls’ (equal parts mixture of ferrocyanide and hydrochloric acid than counterstained withfiltered neutral red stain), Masson’s trichrome (stepwise staining in Weigert’s Iron Hematoxylin solution, Biebrich Scarlet-Acid Fuchsin solution, phosphomolybdic-phosphotungstic acid solution and aniline blue solution), Sirius red (0.1% solution of Sirius red in saturated picric acid and then washed in 0.5% acetic acid) and reticulin (0.5% potassium per-manganate followed by 2% potassium metabisulfite, 2% ferric ammonium sulfate, ammonia silver nitrate solution, 20% unbuffered formalin, 0.2% gold chloride, 2% potassium metabisulfite and 2% sodium thiosulfate). A comparison of the number and size of Kupffer cells was made between the patient and three age-matched controls whose histology was normal.
Kidney histology. Biopsy material from F1:V-3 wasfixed in buffered formalin, dehydrated in graded alcohols, embedded in paraffin, cut into 3 µm thick and treated with hematoxylin and eosin, Jones methenamine silver, Masson trichrome, or periodic acid-Schiff reagent.
Splicing defect characterization. Total RNA was extracted from peripheral blood mononuclear cells (PBMCs) using RNAqueous-Micro Kit (Ambion). Reverse transcription was performed using the High-Capacity cDNA Reverse Transcription Kit (Applied Biosystems). For visualization of mutation-induced defective splicing, cDNA from patient and control PBMCs was amplified with primers encompassing exon 4 of human DNASE2 (DNASE2_e3For 5′-TGCCAGCTCTTAGAGGGT-3′ and DNASE2_e5Rev 5′-AGGGTTCTTGGCTAACGTGGTG-3′). The faint band of wild-type size was purified from the gel using MicroElute Gel Extraction Kit from TREX1
ENA MDC eotaxin NMP1 eotaxin2 HGF IP10 MCP2 BLC_CXCL13 IL02R MIG CD30 IFNg IL16 I_TAC SCF MCP1 MIF MIP1b VEGFa TRAIL SDF1a TNFR2 TNFa MIP1a LIF Tweak IL20 sCD40L GRO_a IL15 IL9 IL21 G_CSF IL6 FGF2 eotaxin3 IL4 IL23 IL31 frackalkine GM_CSF IL13 IL3 bNGF IFNa IL12p70 IL10 IL2 M_CSF IL5 TNFb MCP3 MIP3a IL1a IL1b APRIL IL22 IL27 IL8 TSLP IL17a IL18 BAFF IL7
STING F2:II-4 F1:V-3 F1:V-1 P HC HC
a
b
F1:V-1 F1:V-3 0 20 40 60 80 0 50 100 150 0 5 10 15 TNFα (pg/ml) F1:V-1 F1:V-3 IL-1β (pg/ml) F1:V-1 F1:V-3 IL-6 (pg/ml)Fig. 5 Non-interferon signaling in patients with mutations inDNASE2, STING and TREX1, and in controls. a Multiplex cytokine analysis of serum from five patients (five samples) with loss-of-function mutations in TREX1, 7 patients (seven samples) with gain-of-function mutations in STING, FII:II-4 (two samples), F1:V-3 (seven samples), F1:V-1 (five samples) and six healthy controls (comprising three children, PHC, and three adults, HC). A pattern of enhanced expression of cytokine/chemokine proteins shared across patients mutated inSTING and DNASE2 is indicated by the dotted lines, with genes ranked according to Spearman’s correlation. b Levels of TNFα, IL-1β and IL-6 protein in plasma from F1:V-1 and F1:V-3 sampled across 25 months. The dotted lines represent the cutoff for the normal range in controls for each cytokine
HC DNASE II STING
0 5 10 15
Familial hemolytic anemia Hemolysis Rh null disease Beta Thalassemia
Anemia Hemolytic anemia
Hereditary persistence of fetal hemoglobin Familian erythrocytosis Infection of blood Neoplasia of mast cells
GPA HC F1:V-3 0.0 HC DNase II HC DNase II 0.5 1.0 HC F1:V-1 F1:V-3 * 0.06% 0.91% Reticount HC F1:V-3 0.0 4 *** 2
Cells per field
0 HC F1:V-3 0.5 1.0 1.5 1.37% 1.36%
a
b
c
d
e
f
–log 2 (p-value) ATF3 BCL2L1 C1GALT1 CACNA1D CD274 CEACAM1 EPAS1 EPB42 GRIN3A HBG2 HBZ IL1R2 JAK2 KCNMA1 LIF NT5C3A RHAG RHCE/RHD SLC14A1 TGM2 XK ALAS2 KLF1 CD71 106 105 104 104 105 106 103 103 104 105 106 103 103 104 105 106 250 (× 10 3) (× 10 3) 200 150 100 50 0 250 200 150 100 50 0 0 0 104 105 106 103 DAAM2 JUP FMNL2 HESX1 GRB10 IL1R2 LHX4 LOXHD1 CRISP3 GYPA HOXA1 PDE9A SLC1A3 RHCE RP13–216E22. 4 ATF3 ATF2C2 RN7SL600P SLC14A1 FRMD4A SMIM24 KLC3 LINC00570 CTSE FAM225A DUSP13 TRIM10 RP11–476D10. 1 OSBP2 TMCC2 HIST2H2BF SNCA HIST1H2BF TMEM252 IL18R1 KIAA0825 CD274 FAM8A1 TMEM123 C2orf88 JAK2 RP11–85G21. 3 HEMGN TMEM92 ATP1B2 EMID1 CXCL11 RP11–305F5. 2 ABCC13 RPL5P4 RP11–20D14. 6 HIST1H2BD CEACAM1 RP1–221C16. 8 AP000662. 4 NKAIN1 BCL2L1 HBZ ALAS2 SELENBP1 EPB42 THEM5 CTD-2521M24. 5 KLF1 PLEK2 SLC6A9 TGM2 GMPR MOV10 IRG1 LAD1 COL1A2 MDK C8orf31 DZIP1L TRIM5 ANKRD22 TMEM45A AC008079. 10 ETV7 HBG2 HIST1H4H H19 HIST1H2BG DHRS9 RP1–125I3. 2 LL21NC02–21A1. 1 RMI2 THNSL2 FAM122C RP1–193H18. 2 IFIT1B FAM19A2 C1GALT1 NT5C3A HIST1H3E KCNMA1 TMEM158 ZNF684 RP11–686D22. 7 IDO1 RTEL1P1 AF127936. 3 PDGFRL AC093159. 1 OCLN RP11–389C8. 2 HEPACAM2 LURAP1L XK CENPA TSPO2 RP11–367G6. 3 C10orf10 RP11–321E2. 6 RP11–45901. 2 RP5–1024N4. 4 TPST1 HORMAD1 RP3–467D16. 3 GBP6 YBX3 CNRIP1 FRMD3 RIN2 LRRN1 DYRK3 OSBPL6 PFKFB2 CACNA1D ABCA13 CHRM4 RHAG KB–1027C11. 4 NRN1 TTC25 GBP4 GRIN3A AC090616. 2 WASF 4P LIF ABTB2 CCRL2 GBP5 YPEL 4 G0S2 EPAS1 SRGAP2B MYL4 40 μm % of cells FSCH % of cellsFig. 6 Effects ofDNASE2 mutations on red blood cell homeostasis. Heat map of genes derived by statistical analysis of RNA-Seq data selected according to the following criteria: Control vs. DNase II fold change>2 or <−2 (Adj p < 0.05) and STING vs. Controls (Adj p > 0.05) and DNase II vs. STING; (Adj p < 0.05).b Histogram of the 10 hematological functions identified as the most significantly enriched by Ingenuity Pathway Analysis (IPA) of the genes derived ina. Genes included in these networks are annotated in c with known interactions symbolized by the dotted lines. d Representative dot plot of a CD71 GPA staining of blood from F1:V-3 vs. a healthy control (HC). Patients (n = 2) demonstrated an increased proportion of circulating CD71+, GPA+erythroblasts compare to HC (n = 5). e Representative dot plot of a reticulocyte staining of blood from F1:V-3 vs. a healthy control. Reticulocyte percentage is comparable between patients (n = 2) and controls (n = 5). f Liver biopsy (x40) taken from F1:V-3 at age 8 years demonstrating increased numbers of enlarged Kupffer cells containing hemosiderin (identified by Perls’ stain). Quantification of the number of such cells per field in F1:V-3 (n = 20) compared to 2 age-matched non-inflammatory controls (HC) (n = 41) is given on the right (Mann–Whitney test, *p < 0.05; ***p < 0.001)
Omega, cloned in a pGEMT vector from Promega and sequenced by Sanger sequencing using the same primer pair as above. For exon 4 and exon 5 in family F1, quantitative reverse transcription polymerase chain reaction (qPCR) analysis was performed using TaqMan Universal PCR Master Mix (Applied Biosystems) on a ViiA 7 Real-Time PCR system, and cDNA derived from 40 ng total RNA. Using TaqMan probes for DNASE2 exon 4 (Hs00172391_m1) and DNASE2 exon5 (Hs00923081_m1), the relative abundance of each target transcript was normalized to the expression level of HPRT1 (Hs03929096_g1) and 18 S rRNA
(Hs999999001_s1), and assessed with the Applied Biosystems StepOne Software v2.1 and DataAssist Software v.3.01.
ISG RNA expression in total blood. Whole blood was collected into PAXgene tubes. We used a PreAnalytix RNA isolation kit and RNA concentration, assessed with a spectrophotometer (FLUOstar Omega, Labtech), to extract total RNA. We performed quantitative reverse transcription polymerase chain reaction (qPCR) analysis using the TaqMan Universal PCR Master Mix (Applied Biosystems), and cDNA derived from 40 ng total RNA. Using TaqMan probes for IFI27 (Hs01086370_m1), IFI44L (Hs00199115_m1), IFIT1 (Hs00356631_g1), ISG15 (Hs00192713_m1), RSAD2 (Hs01057264_m1), and SIGLEC1 (Hs00988063_m1), the relative abundance of each of 6‘interferon score’ target transcripts was nor-malized to the expression level of HPRT1 (Hs03929096_g1), and 18 S rRNA (Hs999999001_s1), assessed using the Applied Biosystems StepOne Software v2.1 and DataAssist Software v.3.01. Individual data were expressed relative to a single calibrator for each of the six probes. RQ (relative quantification) is equal to 2−ΔΔCt, i.e., the normalized fold change relative to the control data. The median fold change of the 6 genes compared to the median of 29 previously collected healthy controls is used to create an interferon score for each individual, with an abnormal interferon score being defined as greater than +2 SD above the mean of the control group, i.e., 2.466.
For the extended interferon analysis, the relative abundance of target transcripts, was measured using the additional TaqMan probes Ly6E (Hs00158942_m1), MX1 (Hs00895598_m1), USP18 (Hs00276441_m1), OAS1 (Hs00973637_m1), IFI44 (Hs00197427_m1), IFI6 (Hs00242571_m1), IFIT3 (Hs00155468_m1), IRF7 (Hs00185375_m1) and STAT1 (Hs01013989_m1), was normalized to the expression level of HPRT1 (Hs03929096_g1) and 18 s (Hs999999001_s1) and assessed with Applied Biosystems StepOne Software v2.1. ISG RNA expression in PBMCs. Messenger RNA from treated and non-treated cultured cells were quantified by qRT-PCR using TaqMan probes for IFI27 (Hs01086370_m1), IFI44L (Hs00199115_m1), ISG15 (Hs00192713_m1), and SIGLEC1 (Hs00988063_m1), the relative abundance of each target transcript normalized to the expression level of HPRT1 (Hs03929096_g1), and assessed with the Applied Biosystems StepOne Software v2.1.
ISG RNA expression analysis. 1 × 10⁶cells were lysed in 350µL RLT-Buffer (Qiagen), frozen at−80 °C, thawed, supplemented with 1 volume 70% Ethanol and loaded onto a Zymo III column (Zymo). The column was then washed with RW1buffer (Qiagen) and then RNA wash buffer (Zymo) and eluted with DEPC water. Samples were then subjected to DNase I digestion and reverse transcription with OligodT primers and RevertAid (all from ThermoFischer, Waltham, MA, USA) according to the manufacturer’s instructions. RT-PCR was performed using with 5x EvaGreen QPCR-Mix II (ROX) (Biobudget, Krefeld, Germany). Primers for IFIT1, IFI16 and IFI44 were designed using NCBI primer blast. Sequences used were: IFIT1 forward GTGCTTGAAGTGGACCCTGA-3′, IFIT1 reverse 5′-CCTGCCTTAGGGGAAGCAAA-3′, IFI16 forward 5′-ATATCCTTCA-GAGGCCAGCA-3′, IFI16 reverse 5′-ATCTGAGGAGTGTGGGGATG-3′, IFI27 forward 5′- TGCCCATGGTGCTCAGTG-3′ and IFI27 reverse 5′- GAGAGTC-CAGTTGCTCCCAG-3′. Primers were validated with melting curve and agarose gel analysis and tested for efficiency using cDNA dilution.
Gene expression analysis by RNA sequencing. Whole transcriptome expression analysis was performed using one sample from 1 and two samples from F1:V-3 plus three age-matched controls, three patients mutated in TMEM17F1:V-3 and two patients mutated in TREX1 (Supplementary Table5). We extracted total RNA from blood samples in PaxGene tubes (Qiagen, Valencia, CA), and analyzed RNA integrity with an Agilent 2100 Bioanalyzer. We used the Illumina TruSeq RNA Sample Preparation Kit (Illumina) for mRNA purification and fragmentation, complementary DNA synthesis and target amplification. cDNA libraries were then pooled and sequenced on a HiSeq 2000 Illumina platform (Illumina). The RNA-seq workflow was as follows: quality assessment by FastQC (http://www.
bioinformatics.babraham.ac.uk/projects/fastqc/), qualityfiltering with Trimmo-matic (PMID: 24695404), read mapping with STAR (PMID: 23104886) to hg38, read counting into genes with HTSeq (PMID: 25260700) using annotation from GENCODE v24 (http://www.gencodegenes.org/), normalization and differential expression analysis with DESeq2 (PMID: 25516281). Hierarchical clustering was conducted using the Partek software (version 6.6). Patients and healthy controls were compared using ANOVA analysis, and a list of the 2-fold up or down-regulated genes was generated. The statistical significance level adopted was p < 0.05. Gene lists were uploaded into Ingenuity Pathway Analysis (http://www.
ingenuity.com) in order to determine differentially regulated canonical pathways in the patients. Results for interferon-regulated genes are shown as a heat map, with shades of red denoting upregulated genes and shades of blue denoting down-regulated genes.
siRNA knockdown ofDNASE2. siRNA knockdown was performed in primary fibroblasts via repetitive transient transfection using with 150 nM of SMARTpool ON-TARGETplus siRNA (Dharmacon) targeting DNASE2 (NCBI refseq: NM_001375) or a negative control. siRNAs were transfected via complexation with Lipofectamine 2000 (Life Technologies) according to the manufacturer’s instruc-tions. Fibroblasts were transfected twice, with the second transfection after 48 h. DNase 2 assays were performed 24 h after the second transfection. Knockdown efficiency was evaluated by quantitative real-time PCR. The DNASE2 primers used were: (forward) TCGCCTTCCTGCTCTACAAT-3′ and (reverse) 5′-CCCATCTTCGAGAACTGAGC-3′.
Plasmids. Human DNase II gene ORF cDNA clone expression plasmid with a C-terminal Myc-FLAG tag, pCMV6-RC209573, was purchased from OriGene (OriGene Technologies, Rockville, Maryland, USA). The deletion of exon 4 and the mutations c.347G>C and c.362A>T were introduced into pCMV6-RC209573 via site-directed mutagenesis. The deletion of exon 4 was performed using the Q5 Site-Directed Mutagenesis Kit (New England Biolabs, Ipswich, MA, USA) according to the manufacturer’s instructions. The point mutations were introduced via whole plasmid PCR with Pfu Ultra (Stratagene). The primers used were: (deletion exon 4 sense) 5′-GCAAGCAGCTGACCTACAC-3′, (deletion exon 4 antisense) 5′-CCTTCGTGTGCCCACGCA-3′, (c.347G>C sense) 5′-AAGGAGCAGGA-CAGCCTTCGTGTGCCC-3′, (c.347G>C antisense) 5′-GGGCACACGAAGG CTGTCCTGCTCCTT-3′, (c.362A>T sense) 5′-GCCCCCATCGTGGACAAGG AGCAGGAC, and (c.362A>T antisense) 5′- GTCCTGCTCCTTGTCCACGAT GGGGGC-3′. Sequencing confirmed that the respective mutations were incorpo-rated, with no other alteration in the construct.
For lentivirus expression, human DNase II cDNA was transferred from pCMV6-RC209573 via SalI/NotI fusion to a modified version of pLenti6 (Invitrogen, ThermoFisher Scientific, Waltham, MA) with an elongation factor-1a (EF1a) promoter and encephalomyocarditis virus IRES sequence followed by an eGFP sequence and a blasticidin/SV40 promoter resistance cassette.
For CRISPR-Cas9-based editing of human DNase II, the gRNA
GGCACTCATCAACAGCCCGG(AGG) was selected with the CRISPR design tool (Zhang Lab, MIT, crispr.mit.edu) and introduced into an EF1a-Cas9-U6-sgRNA expression plasmid via Gibson assembly45.
All DNase II degradation assays were performed using an empty pBluescript (SK-) bacterial vector.
CRISPR-Cas9 genome editing. A CRISPR/Cas9/gRNA plasmid targeting DNASE2 was introduced into HEK293FT (Invitrogen) using TransIT-LT1 Transfection Reagent (Mirus Bio, Madison, Wisconsin) according to the manu-facturer’s instructions. Cells were then subjected to limited dilution and seeded as single-cell colonies. After expansion, DNase II-deficient clones were identified via Sanger sequencing. A clonal cell line with a heterozygous 7 bp deletion in Exon 2 was used for the experiments in this manuscript.
Lentivirus expression and lentiviral transduction. Lentiviral particles were generated as previously described46. In brief, lentiviral transduction was performed using a second generation lentiviral vector pLenti (Invitrogen), which is a poor stimulator of the type 1 interferon response even during acute infection47
and which are not capable of replication. Viral supernatants were then subjected to ultracentrifugation using a Beckman Coulter SW32 rotor at 21000xg for 2 h. Viral pellets were then resuspended in DMEM and added to primary human fibroblasts at an MOI of 100. After 2 days, positive cells were selected using blasticidin.
Purification and quantification of DNase II protein. Human DNase II constructs with a C-terminal FLAG sequence were introduced into DNase-II-deficient HEK293FT via calcium phosphate transfection. After 36 h, the cells were subjected to cytosolic lysis with a buffer containing 50 mM Tris HCl, pH 7.4, 150 mM NaCl, 50 mM EDTA, 1% TRITON X-100, and a protease inhibitor cocktail (cOmplete Protease Inhibitor Cocktail Tablets, Roche). Nuclei were removed via centrifuga-tion, and the cytosolic supernatant was fractionated with ammonium sulfate and resuspended in 50 mM Tris HCl, pH 7.4, with 150 mM NaCl, 1 mM EDTA. The samples were then subjected to affinity immunoprecipitation with Anti-FLAG M2 Agarose Beads (Sigma) and eluted with FLAG Peptide (Sigma) according to the manufacturer’s instructions. The eluted fractions were precipitated with ammo-nium sulfate, resuspended and dialyzed with SpectraPor #4 tubing MWCO 12–14 kDa (Carl Roth, Karlsruhe, Germany) against 40 mM Tris-HCl 7.4, 25 mM EDTA, 100 mM NaCl, 1 mM DTT to remove FLAG Peptide and residual ammonium sulfate. Proteins were quantified using an in-house developed FLAG-based ELISA assay. In brief, high-binding plates were coated with the proteins of interest and defined amounts of purified IL-1b-FLAG were used as a standard. Plates were then blocked with 1% BSA overnight, and FLAG-tagged proteins were detected using
HRP-coupled Anti-FLAG M2 antibody. These results were then verified via PAGE electrophoresis and immunoblotting with Anti-FLAG M2 antibody.
Activity of purified DNase II protein and in cell lysates. Purified DNase II protein was combined with 1µg plasmid DNA and incubated at pH 5.0 with 60 mM NaOAc and 50 mM EDTA for 1 h. Samples were then neutralized with a loading buffer containing 0.25% bromophenol blue, 25% glycerol, 80 mM Tris-HCl, pH 8, and 5 mM EDTA and subjected to electrophoresis in a 1% agarose gel containing 0.0001% SybrSafe (ThermoFisher, Waltham, MA, USA). DNA was visualized with a Licor®Fc imaging system (Licor, Lincoln, Nebraska, USA).
DNase II activity in patientfibroblasts was measured using a modified version of the protocol from Howell48. In brief, 2 × 10⁶fibroblasts were lysed in 100 µL lysis buffer, containing 1% Triton-X, 50 mM Tris-HCl, pH 7.4, 150 mM NaCl and 25 mM EDTA. Nuclei were removed by centrifugation, Purified plasmid DNA was diluted with assay buffer (60 mM sodium acetate, pH 5, 50 mM) to afinal amount of 0.4 g per 21µL reaction and aliquoted. Cellular supernatants were diluted 1:5 into the DNA solution and incubated at 37 °C as indicated. Samples were then neutralized with loading buffer, subjected to agarose gel electrophoresis and imaged as described above.
Determination of the rate of change of optical density was performed with a modified, microscaled version of the protocol from Kunitz49. In brief, 1µg of
plasmid DNA was incubated with the indicated concentrations and types of DNase II and 0.1 M NaOAc buffer (pH) in a total volume of 3µL at 37 °C in a Biotek Take 3 microplate (Biotek, Winooski, Vermont, USA), and the absorbance at 260 nm was measured once per minute.
Stimulation of primary humanfibroblasts. Fibroblasts were seeded at 2 × 10⁵ cells per well in a 96-well plate. After 16 h, the cells were stimulated. cGAMP transfection was performed via digitonin permeabilization as previously descri-bed50In brief, cells were permeabilized at 37 °C for 30 min with 5µM 2′-3′cGAMP
in 50 mM HEPES pH 7.0, 100 mM KCl, 3 mM MgCL2, 0.1 mM DTT, 85 mM Sucrose, 0.2% BSA, 1 mM ATP, 0.1 mM GTP and 10µg/mL Digitonin. 5′ tripho-sphate dsRNA (5′ pppRNA) was created via in vitro transcription using a com-mercial T7 in vitro transcription kit with the template
5′- TTGTAATACGACTCACTATAGGGACGCTGACCCAGAAGATCTACTA-GAAA TAGTAGATCTTCTGGGTCAGCGTCCC-3′ as in reference51. For
sti-mulation with dsDNA and 5′ pppRNA, 200ng was transfected per well with lipofectamine 2000 (ThermoFisher) according to the manufacturer’s instructions. STAT phosphorylation assay staining. Peripheral blood mononuclear cells (PBMCs) were treated or untreated with ruxolitinib 1µM for 2 h. Cells were fixed using Beckman Coulter PerFix Expose Fixation Buffer (10 min at room tempera-ture) and then permeabilized using BC PerFix Expose Permeabilizing Buffer (5 min at 37 °C). Cells were stained with FITC-anti-STAT1 pY701 (BD Bioscience, cat: 612596, 4a, 1:5), PE-anti-STAT1 pY701 (BD Bioscience, cat: 612564, 4a, 1:5) or FITC-anti-STAT3 pY705 (BD Bioscience, cat: 612564, 4a, 1:5) and cell surface markers CD3 (Miltenyi Biotec, cat: 160-109-462, REA613, 1:30) and APC-Alexa750-CD14 (Beckman Coulter, cat: B92421, RM052, 1:30)) for 1 h at room temperature protected from light. Flow cytometry analysis was performed on a Gallios Beckman Coulterflow cytometer. Results were analyzed using Kaluza software v1.3.
Quantification of circulating protein biomarkers. Serum or plasma concentra-tion of the following 65 immune monitoring biomarkers, APRIL, BAFF, BLC, CD30, CD40L, ENA-78, Eotaxin, Eotaxin-2, Eotaxin-3, FGF-2, Fractalkine, G-CSF, GM-CSF, Groα, HGF, IFN-α, IFN-ɣ, IL-10, IL-12p70, IL-13, IL-15, IL-16, IL-17A, IL-18, IL-1α, IL-1β, IL-2, IL-20, IL-21, IL-22, IL-23, IL-27, IL-2R, IL-3, IL-31, IL-4, IL-5, IL-6, IL-7, IL-8, IL-9, IP-10, I-TAC, LIF, MCP-1, MCP-2, MCP-3, M-CSF, MDC, MIF, MIG, MIP-1α, MIP-1β, MIP-3α, MMP-1, NGF-β, SCF, SDF-1α, TNF-β, TNF-α, TNF-R2, TRAIL, TSLP, TWEAK, and VEGF-A, were assessed in sam-ples from patients and healthy donors. Frozen sera or plasma were thawed and spun (1000 × g, 5 min) immediately before starting the experiment. Quantification was performed based on the Luminex xMAP technology (Luminex Corp., Austin, TX, USA), using the Immune Monitoring 65-Plex Human ProcartaPlex Panel (ThermoFischer Scientific, Waltham, MA, USA), according to the manufacturer’s instructions. Plates were analyzed on a Bioplex 200 analyzer (Biorad, Hercules, CA, USA). Concentrations were calculated from the raw data using the Five-Parameter Logistic (5PL) equation on the GraphPad Prism6 software (GraphPad Software, Inc., La Jolla, CA, USA). Heat maps were made with the R package ctc: Cluster and Tree Conversion and imaged by Java Treeview software.
Single analyte ELISA assays. TNFα, IL-1β and IL-6 were measured by standar-dized ELISA assay (Invitrogen, KAC1751, KAC1211, KAC1261 respectively) in the diagnostic laboratory of the Hôpital Necker-Enfants Malades, and compared to a normal range of controls for each cytokine.
Interferon alpha in serum and supernatant. As reported by Rodero et al.26, a
Simoa interferon alpha (IFN-α) assay was developed using a Quanterix Homebrew
Simoa assay and two autoantibodies specific for IFN-α isolated and cloned from two APS1/APECED patients recently described24. The 8H1 antibody clone was used as a capture antibody after coating on paramagnetic beads (0.3 mg/mL), and the 12H5 was biotinylated (biotin/Ab ratio= 30/1) and used as the detector. Recombinant IFN-α17/αI (PBL Assay Science) was used as a standard curve after cross-reactivity testing. The limits of detection (LOD) were calculated by the mean value of all blank runs + 3SDs and was 0.23 fg/mL.
Cell sorting and culture for interferon alpha dosage. Peripheral blood mono-nuclear cells (PBMCs) were isolated from blood using lymphocyte separation medium. Just after isolation, PBMCs were labeled with CD3 Krome Orange (Beckman Coulter, cat: B00068, UCHT1, 1:30), CD19 PE-Cy7 (BD Bioscience, cat: 557835, SJ25C1, 1:100), CD56 FITC (Miltenyi Biotec cat: 130-100-746, REA196, 1:30) and CD14 APC-Alexa Fluor 750 (Beckman Coulter, cat: B92421, RM052, 1:30). PBMC subsets were isolated using a BD FACS Aria II. Purity of the cell sorting was verified for 9 individual donors, and was high for all populations (mean± SD for CD3: 95.73% ± 3.02; B cells: 97.5% ± 2.3; NK: 97.9% ± 1.6; monocytes: 97.7%± 2.6). After sorting, cells were cultured at 1,500,000 cells per mL in 96 wells plates with 100µL of RPMI SVF10% for 48 h. Supernatant was isolated from non-adherent cells and debris by centrifugation (5 min, 10,000 × g), and stored at−80 °C until analyzed on the Simoa platform.
Erythroid liquid culture. Erythroid cells were generated in vitro from peripheral blood circulating CD34+cells obtained from the cord blood of healthy donors. Isolated CD34+progenitors (Miltenyi Biotec CD34 Progenitor Cell Isolation Kit) were grown in the presence of 100 ng/mL IL-6, 10 ng/mL IL-3 and 100 ng/mL stem cell factor (SCF) for 7 days. On day 7, erythroid progenitors were switched to a second phase of culture allowing the differentiation and maturation of erythro-blasts: thus, cells were cultured in the presence of 10 ng/mL IL-3, 50 ng/mL SCF and 0.2 U/mL erythropoietin (EPO) in IMDM (Gibco cell culture) supplemented with 15% BIT 9500 (Stem Cell Technologies), as previously described52. Cells were
then cultured in the presence of 3 different doses of interferon alpha 2 (0, 100, and 1000 IU/L).
Western blot analysis. Proteins were extracted from monocyte-derived macro-phages enriched from PBMCs by plastic adhesion and from transfected HEKs using lysis buffer (RIPA) supplemented with 1% protease inhibitor and 1% phosphatase inhibitor (all from ThermoFisher Scientific, Waltham, Massachusetts, USA). Bolt LDS Sample Buffer (4×) (Novex Life Technologies) and Bolt Sample Reducing agent (10×) (Novex Life Technologies) were added to protein lysates, samples resolved on 8% Bolt Bis-Tris Plus gels (ThermoFisher Scientific, Waltham, Massachusetts, USA), and then transferred to nitrocellulose membrane (#IB23002, ThermoFisher Scientific, Waltham, Massachusetts, USA). Membranes were blocked by incubation with 3% non-fat milk powder in TBS and primary anti-bodies were incubated overnight. The appropriate Infrared Dye (IRDye)-con-jugated secondary antibody (IRDye 680RD Goat Anti-Mouse IgG C/N 926-68070 or IRDye 800CW Goat Anti-Rabbit IgG C/N 926-32211; dilution 1:10,000; both from Li-Cor, Lincoln, Nebraska, USA) was incubated with the membrane before the detection of antibody binding by Licor Odyssey CLx system (Li-Cor, Lincoln, Nebraska, USA). Proteins were detected with polyclonal anti-DNASE2 (ab8119, dilution 1:500) and Vinculin (EPR8185, ab129002, dilution 1:50000) antibodies (both from Abcam, Cambridge, UK); monoclonal mouse mouse anti-β-Actin (Cell Signaling, Danvers, Massachusetts, USA, 8H10D10, 1:10,000) antibody. DNase II is glycosylated at multiple sites, giving a size at around 47 kDa53.
Protein modeling: PDB reference. Experimental 3D structures of was based on a previously published structure prediction17and analyzed using Chimera
(http://www.cgl.ucsf.edu/chimera/).
URLs. UCSC Human Genome Browser,http://genome.ucsc.edu/; Ensembl, http://www.ensembl.org/; dbSNP,http://www.ncbi.nlm.nih.gov/projects/SNP/; Exome Variant Server, NHLBI Exome Sequencing Project (ESP),http://snp.gs. washington.edu/EVS/; Exome Aggregation Consortium (ExAC),http://exac. broadinstitute.org(accessed January 2017); Clustal Omega,http://www.ebi.ac.uk/ Tools/msa/clustalo/; Alamut,http://www.interactive-biosoftware.com/; GraphPad, http://www.graphpad.com/.
Data availability. All relevant non-patient sensitive data are available from the authors. RNA-seq data are available at ArrayExpress E-MTAB-5735.