ISSN: 2180-3811 Vol. 6 No. 2 July-December 2015
29 FAILURE MODES OF GFRP AFTER MULTIPLE IMPACTS DETERMINED
BY ACOUSTIC EMISSION AND DIGITAL IMAGE CORRELATION A. J. Jefferson1, V. Arumugam2, C. Santulli3* , A. Jennifers4, M. Poorani5 1, 2, 4Department of Aerospace Engineering, Madras Institute of Technology,
Anna University, Chennai, India
3 School of Architecture and Design, Università degli Studi di Camerino, Ascoli Piceno, Italy
5 Wright State University, Dayton, United States
ABSTRACT
The nature and extent of damage in multiple times impacted E-glass/epoxy laminates subjected to compression loading has been investigated, using a correlation of passive image processing and online acoustic emission techniques. Sixteen-ply unidirectional glass fiber reinforced plastic laminates were fabricated, on which low velocity repeated impact tests were conducted at an energy of 8.67 Joules, followed by post-impact compression tests accompanied with acoustic emission monitoring and online recording of the complete loading using a digital camera. The combination of different methods suggested that damage modes during impact change were depending on whether the laminate had been impacted already or not. This compression after impact loading the accrued importance of fiber microbuckling, as assessed from acoustic emission frequency analysis, for growing number of impacts and for higher compression stress. Moreover, different growing levels of critical stress for the laminates during loading were established, linked to damage initiation (first acoustic emission events detected), to damage propagation, (digital images start detecting an increase of damaged area), and to unstable damage growth (maximum compression after impact stress is reached).
KEYWORDS: GFRP; impact; CAI tests; digital image correlation; acoustic emission
1.0 INTRODUCTION
Glass fibre reinforced polymer (GFRP) composite laminates are widely used in aerospace, automotive industries for various engineering applications, because of their strength-to-weight and stiffness-to-weight ratios. Composite laminates, however, do possess severe limitations, which include susceptibility to internal damage when they are subjected to low-velocity impact during service conditions (Siow & Shim, 1998; Li et al., 2000; Abrate, 1998; Voelker, 1991) or even repeatedly (Icten, 2009).
In the case of fibre reinforced laminates, particularly low energy impact may result in BVID (Barely Visible Impact Damage), which it is not consistently apparent from visual inspection of the materials. In spite of its difficult visual detection, BVID may
ISSN: 2180-3811 Vol. 6 No. 2 July-December 2015
30 result in a significant reduction of the residual mechanical properties of the impacted laminates with respect to the non-impacted ones (Delfosse & Poursartip, 1997). Also, BVID may involve a number of different modes of damage, including indentation, matrix cracking, fibre–matrix debonding, delamination, inter-laminar failure and possibly also fibre breakage for higher impact energies (Cantwell & Morton, 1991). Compression after impact (CAI) performance remains a significant design criterion in the use of composite structures, particularly in aerospace industry, mainly because of their susceptibility to impact damage, whose effect may be a significant huge reduction in post-impact compressive strength (Zhang et al., 1999). Ghelli and Minak (2011) studied the effect of geometry by using rectangular and circular quasi-isotropic specimens for CAI testing. The outcome of their investigation was that delamination produced by impact reduces the ultimate strength and change the buckling mode. This study concluded that impact-induced damage did not influence the compressive failure in all the specimens, whereas orientation and dimension of the specimen plays a key role in the residual compression strength of carbon fibre reinforced polymers (CFRP). Naik et al. (2002) carried out the CAI tests using National Aeronautics and Space Administration (NASA) fixture, and proposed that damage tolerance was higher for low mass and high velocity combination as compared to high mass and low velocity combination. The effect of hybrid laminates on CAI was studied by Gustin et al. (2005) on carbon fiber and Kevlar combinations to determine the reduction in compressive strength. The experimental tests have shown that the addition of Kevlar minimized the reduction in CAI strength. de Freitas and Reis (1998) studied the low energy impact and performed CAI tests on CFRP laminates, concluding not only that the delaminated area due to impact loading is a function of the absorbed energy, but also that the residual strength during compression has a relation with the delaminated area.
Post-impact damage characterization in composite laminates entails considerable difficulties, in particular because the mode of failure depends on the material and geometry, so that a variable combination of different compressive failure modes, such as micro buckling, kinking, delamination, debonding and fiber failure may occur in composite laminates (Aktas et al., 2001; Aoki et al., 2008; Fleck et al., 1997). Some researchers considered kinking in CAI specimens as a consequence of micro-buckling, while others treated it as a separate mode of failure (Budianki & Fleck, 1994; Prabhakar & Waas, 2013). Typical investigations of post-impact compression damage starts from visual observations, supported by simple techniques, such as image analysis, (Caneva et al., 1993). From early studies on, the attention has been focused on obtaining information on modes of damage due to impact, usually with visual methods, often enhanced by microscopical techniques, primarily to assess the resistance of the laminate to initiation and propagation of damage during impact (Pritchard & Hogg, 1990). A number of non-destructive testing (NDT) techniques have been used for the characterization of damage mechanisms in post-impacted composite laminates. Acoustic emission (AE) is a non-destructive technique frequently used for real-time structural health monitoring of the damage development in materials (Calabrò et al., 1998). In service monitoring of AE, i.e., ultrasonic waves generated in materials under load, can be used for this purpose. The main concept of AE evaluation and starting point of AE analysis is the comparative consideration that, as suggested by Hamstad, during loading, damaged specimens produce more AE than the undamaged ones (Hamstad et
ISSN: 2180-3811 Vol. 6 No. 2 July-December 2015
31 al., 1992). Many researchers have attempted to identify the failure modes using two different approaches, namely parametric-based approach and signal-based approach (Grosse & Linzer, 1998). Bussiba et al. (2008) adopted AE to evaluate threshold parameters during loading of C/C composites under various states of stress. Most studies involving parametric-based approach have been performed using AE parameters such as energy, counts, amplitude, and duration and rise time (Barre & Benzeggagh, 1994; Bar et al., 2003; Dzenis & Qian, 2001). In signal-based approach, AE waveforms and the determination of their frequency content using Fast Fourier Transform (FFT) are used. This leads to indicate the dominant frequencies of the signal, those which are directly related to main failure mechanism.
Concerning the different damage mechanisms in the carbon/epoxy composites, de Groot et al. (1995) proposed to achieve it via a real-time frequency determination of AE waveforms: this work allowed obtaining a clustered representation of the frequency values along with the density of those clusters. Stage-by-stage approach for the characterization of fiber failure modes, starting from specimens containing one single carbon fiber, showed that the frequencies of AE signals are virtually unchanged irrespective of the propagation distance between the AE source and sensors (Ni & Iwamoto 2002). Park et al. (2002) identified frequency response characteristics of the AE waveforms for single carbon fibers, by applying fragmentation tests. Ramirez-Jimenez et al. (2004) concluded that the event primary frequency alone does suffice to characterize each acoustic event, suggesting that signals having similar frequency content may have also a similar source mechanism. Also the objection that whenever the amplitude of this source is substantially different the frequency of events from the same mechanism may change proved not relevant. A further confirmation of approximately 100 kHz as main frequency associated with matrix cracking on CFRP was recently obtained (Santulli, 2012). Frequency analysis has often been associated with other methods of evaluation of AE activity. In particular, Bussiba et al. (2008) used frequency analysis and AE parametric study to track the damage accumulation profile in terms of AE parameter such as counts rate and cumulative counts. Arumugam et al. (2011a) studied the effect of fiber orientation and the predominance of the different failure mechanisms in GFRP laminates using frequency and parametric analysis. Acoustic emission was globally used for online structural health monitoring, while it always requires a post NDT method such as ultrasonic or X-ray tomography to quantify the nature and extent of damage. To overcome this difficulty AE can be used along with online recording of the loading process using a high-speed camera. Further digital image correlation may be used to estimate the growth of the damage area during the various stages of loading. Failure investigation and fatigue damage studies in GFR composite laminates were recently investigated using optical digital image correlation (DIC) technique. DIC offers a direct measure of displacements by comparing the images of loaded components with load-free components (Giancane et al., 2010). Caneva et al. (1993) performed damage evaluation analysis on post-impacted stitched specimens, using a digitalized image technique and AE technique while conducting CAI test. The damaged area was measured and different zone shape was evaluated by image technique; on the other hand, the AE technique is capable of evidencing the effect of the stitching wire, depending on the size of the mesh created with them.
ISSN: 2180-3811 Vol. 6 No. 2 July-December 2015
32 In this paper, online AE technique combined with DIC technique was used to estimate the nature and extent of damage in impacted glass/epoxy laminates subsequently subjected to compression loading. Combining both the techniques assists in correcting the downsides in both of them; the difficulty in the interpretation of sound waves was made easy with the visual images and the difficulty in making use of the optical technique for practical, large-scale purposes. GFRP composite laminates were fabricated with 16 unidirectional (0°) plies and ASTM D7137M-12 specimens were cut from the laminates. Low velocity repeated impact tests were conducted at 3 m/s followed by post-impact compression tests in a 100 kN universal testing machine, accompanied with acoustic emission monitoring and online recording of the complete loading using a CCD camera. Images were captured every four seconds and the extent of progression of the damage during compression loading was quantitatively determined from the captured images. The study is mainly focused on correlating AE data with that conveyed by the captured images. This is the novelty of this work, in that it offers to AE the possibility of a comparison in addition to that data offered by mechanical characterization with a technique, such as DIC, which is able to capture information in real time at the very moment damage takes place. In particular, DIC was used to estimate the damage area during the different stages of loading from the images captured during the onset of damage initiation, propagation, unstable growth and rupture: all these phenomena were correlated with the frequency content of AE hits and to AE cumulative counts to analyze the nature and extent of damage.
2.0 EXPERIMENTAL PROCEDURES 2.1 Composite manufacturing
E-glass/epoxy unidirectional laminates with 60 wt.% fibers oriented along the longitudinal direction were fabricated using hand lay-up technique. Sixteen layers of stitched-bonded unidirectional glass fiber were rolled and stuck together using Araldite epoxy resin (LY556) with hardener (HY951). The procedure consists of applying alternate layers of fiber and resin and sticking them together with the assistance of hand rollers. They were subsequently left to cure at 30°C temperature under the pressure of a compression molding system setting the pressure at 5.5 MPa. The thickness of the specimens amounted to 4 mm. The void content was measured using a procedure in accordance with ASTM D792 and was evaluated as being equal to 2.5±1%.
2.2 Impact testing
ASTM D7137M-12 standard specimens of size 150 x 100 mm were cut from the laminates using water jet cutting method. Multiple impacts were performed up to three times on three identical samples at an impact velocity of 3 m/s using a CEAST Fractovis falling weight impact tower. The mass of the impactor was 1.926 kg, while the diameter of the indenter was 12.7 mm with a clamping force of 1000 N. Therefore, the nominal impact energy was 8.67 J and the impact crack is located at around 50 mm from each edge of the sample. Between an impact and the following one, only a very short time was allowed, which was devoted to unloading the sample and setting the new impact tests, therefore not exceeding a minute in the worst case. The parameters such as
ISSN: 2180-3811 Vol. 6 No. 2 July-December 2015
33 impact energy, deformation, contact force and velocity were recorded. Care was taken to impact the compression test specimen at the center of their surface to allow an easier comparison among the different impacted laminates.
2.3 Compression after impact (CAI)
The CAI tests were conducted at room temperature, using an ASTM D7137M-12 fixture in a Tinius Olsen UTM with 100 kN load capacity. Constraints were provided against rotation and lateral translation for the upper and lower specimen edges and simply supporting the two vertical sides arresting global buckling. Compressive load was applied under stroke control at a displacement rate of 0.25 mm/min. The experimental set-up also includes a CCD camera of time resolution 22 frames per second with a fixed focal ratio so that they could be calibrated later for real time study. For the visual observation of the impacted specimens during the CAI tests, the CCD camera focus was pointed on the center of the impacted area. The images were captured until complete failure of the specimen.
2.4 Acoustic emission (AE)
The loading was also accompanied by online acoustic emission monitoring, which was operating during CAI tests. An eight-channel AE system, supplied by Physical Acoustics Corporation (PAC), was used for the continuous monitoring of AE data, carried out specifically with a SAMOS E3.10 data acquisition system, again from PAC, with a sampling rate of 3 mega-samples per second (MSPS) and a 40 dB pre-amplification. Ambient noise was filtered using a threshold equal to 45 dB. The impacted site was monitored by three wideband PAC sensors, which have a quasi-flat response in the 100–900 kHz interval. 2D planar location was used for the placement of the three sensors (see Figure 1(a)), which form an equilateral triangle. The amplitude distribution covers the range of 0–100 dB (0 dB corresponds to 1 mV at the transducer output). The input parameters used for AE monitoring were as follows: peak definition time (PDT)—17 µs, hit definition time (HDT)—150 µs, hit lock-out time (HLT)—300 µs. These time intervals enable the partition of the continuous AE stress wave into separate hits, in order to analyze them using signal descriptors, such as counts, amplitude, energy, events, duration, and rise time. AE wave velocity for the specimens was found to be in the order of 3500 m/s.
2.5 Digital image correlation (DIC)
Digital image correlation allowed monitoring the full field displacement during CAI loading on the surface of the specimens visually without any hindrance. Figure 1(b) shows the CCD camera and placement of the specimen in the compression fixture.The range and size of the cracks have no effects whatsoever on DIC technique. Every care has been taken to ensure that the non-impacted side of the laminate appeared with uniform color, although obviously some white noise can be present as the consequence of geometrical differences due to mismatches in production. To account for this, for every laminate a threshold has been applied to gray level histograms of each image, as it appears at time 0 of loading to be able to measure the amount of damage produced
ISSN: 2180-3811 Vol. 6 No. 2 July-December 2015
34 during CAI test. As a consequence, after this filtering procedure, it can be assumed that the differences between consecutive images taken during loading are solely to be ascribed to gradual modification of the laminate as an effect of damage development. Starting with two subsequent images digital image correlation for measurement of range and size of the cracks on the surface of the specimens is based on the following standard steps:
Step 1: Capture and import synthetic images (i.e. grayscale images with some distinct spots).
Step 2: Transform the imported synthetic images into binary images. Fragment the imported grayscale images by generating binary images containing the objects (i.e. crack distribution) in the images.
Step 3: Measure object properties (i.e. range and size of the crack) by means of pixel values of the images.
ISSN: 2180-3811 Vol. 6 No. 2 July-December 2015
35 Figure 1. (a) AE sensor placement, (b) Specimen under static compression test
3.0 RESULTS AND DISCUSSION
The primary objective of this investigation on GFRP laminates subjected to multiple impacts at a very low energy level, which is supposed to be just above BVID. While BVID is subjective by nature, it is often defined as damage visible within a range of 1 m, or causing a detectable permanent indentation. The idea was to estimate the extent of damage by possibly eliciting a correlation between the damage areas measured from the captured images and AE events parameters. The assumption from which this study
Specimen AE sensors
(a)
ISSN: 2180-3811 Vol. 6 No. 2 July-December 2015
36 moves on is the fact that multiple impacts intensify the damage inside the laminate, causing very quick damage accumulation and promoting damage progression at a faster rate. Figure 2 shows a typical visualization of the laminates subjected to multiple impacts. Even though in all the cases the extent of damage was visible on both tension and compression side, as the number of impacts increases the extent of damage area also is growing, with particular evidence on the rear side. Moreover, the impactor trace is much more visible on the rear face for double and even more for triple impact, which suggests that a kind of forming process occurs during the impact event, which may involve the presence of different damage modes. On the other side, a kind of compensation effect may occur, in the sense that slight curvature caused by impact visible on both sides of the laminate may slightly stiffen the composite, when subjected to further impact events (Short et al., 2002) events (Short et al., 2002).
Figure 2. Crack pattern on both surfaces for: (a) Single impacted (b) Double impacted (c) Triple impacted laminates (scale in mm)
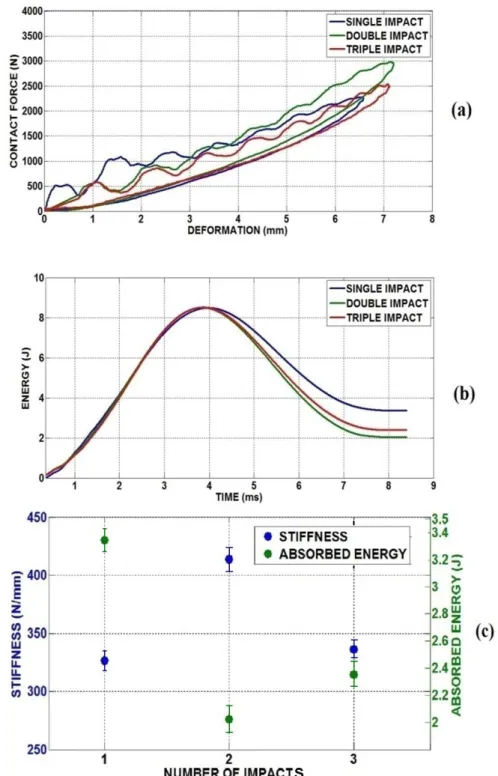
Figure 3(a) and 3(b) show the contact force vs. deformation and energy vs. time response of glass/epoxy laminates subjected to single, double and triple impacts, respectively. The stiffness and absorbed energy were recorded for each category of specimens. It was evident from the results that single impacted laminates retained the largest amount of damage in comparison with double impacted ones: this may be due also to matrix compaction making the impacted site harder on second impact, together with the previously observed effect of curvature (Wyrich & Adams 1988). During the third impact the absorbed energy was again higher, which was likely to be due to damage incurred on the fibers and inadequacy of degraded fiber/matrix interface to withstand damage. This was also quite evident from the linear stiffness values shown in Figure 3(c) for laminates subjected to multiple impacts: the significance of linear stiffness during falling weight impact tests, as an indication of stress relaxation, was discussed already by Santulli (2003). In general, after third impact, the rigidity of the laminate is substantially reduced: it was proposed that the extent of this reduction would
ISSN: 2180-3811 Vol. 6 No. 2 July-December 2015
37 be modified whenever the laminates are allowed to recover by leaving some time between an impact and another (Chakraborty & Kumar 2005). This was purposely not the case in this work, where the impact were consecutive, so to simulate the worst possible conditions.
Figure 3. Response of Glass/Epoxy specimens subject to multiple impacts: (a) Contact force vs. deformation; (b) Energy vs. time; (c) Linear stiffness, Absorbed Energy vs.
ISSN: 2180-3811 Vol. 6 No. 2 July-December 2015
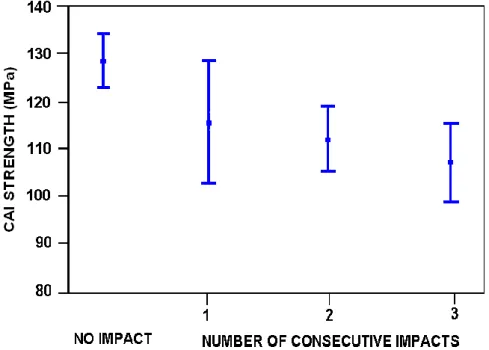
38 In Figure 4 compression strength data for laminates impacted consecutively one; two or three times are reported, compared with the same data for non-impacted laminates. In general terms, the decrease of compression strength appears gradual for each further impact, possibly with more limited degradation between the second and the third impact. It can be therefore suggested, for comparison with what observed also in Figure 3, that the material becomes significantly less rigid in the occasion of the third impact, although it does not lose much strength because of its capability of accommodating further deformation in the form of damage. It is important at this point to try to explain this variation of properties in terms of extension of the damage area.
Figure 4. Compression strength data (average and standard deviation) for laminates impacted one, two or three times
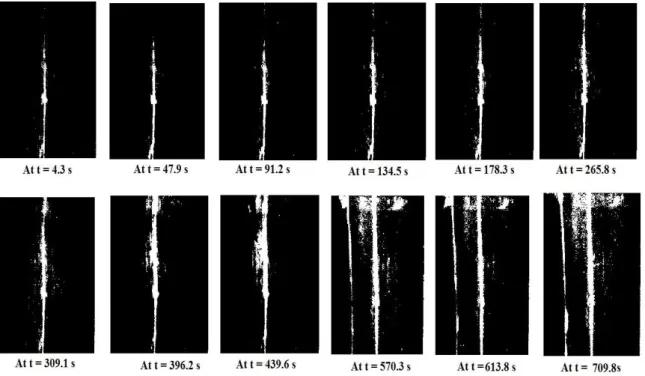
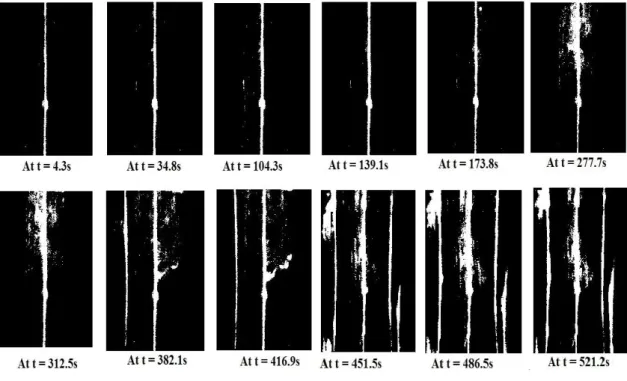
Figures 5 to 7 show the pictorial representation of the processed images of the snapshots captured at different stages of loading for single double and triple impacted specimens subjected to compression loading. A MATLAB code has been developed to separate both the white and black pixels based on the estimated threshold, which will be used further to estimate the damage area pertaining to each image during the different stages of loading. It is clearly visible from processed images that damage progresses from the impact point during compression loading, though in the final part of it also other fronts of propagation open up in other regions of the laminate. However, other differences are perceivable between laminates subjected to single, double and triple impact, in the sense that while the first ones presents a crack that is present only in a part of the surface until some load is reached. This in the case of the sample whose test in shown in Figure 5 is around 200 seconds during testing, corresponding to around 65 MPa. In contrast, in Figure 6 and 7 the sample is already cracked on the impact surface at the beginning of the CAI loading, as the results of two or three impact events, respectively. As from the typical graph depicted in Figure 8, the damage area is much larger for laminates
ISSN: 2180-3811 Vol. 6 No. 2 July-December 2015
39 subjected to triple impact than for those subjected to single and double impact and it starts increasing much earlier during the loading time.
Figure 5. Damage progression of single impacted laminate subjected to CAI test
ISSN: 2180-3811 Vol. 6 No. 2 July-December 2015
40 Figure 7. Damage progression of triple impacted laminate subjected to CAI test
Figure 8. Comparison of cumulative damage area versus loading time response for single, double and triple impacted specimens subjected to CAI test
Acoustic emission can offer more information on damage modes occurring in the composite during CAI loading: Figure 9(a) to (c) show the peak frequency and cumulative damage area versus loading time for laminates subjected to single, double and triple impact events and then subjected to compression tests. Four distinct ranges of peak frequency content such as 90 - 110 kHz, 112 - 128 kHz, 136 - 180 kHz and 180 - 250 kHz were identified which are most likely related to the different failure modes, such as matrix cracking, debonding, delamination, and fiber micro buckling respectively. This was suggested on the basis of a series of studies carried out on AE
ISSN: 2180-3811 Vol. 6 No. 2 July-December 2015
41 frequency analysis on GFRP (Arumugam et al., 2011a; Arumugam et al., 2011b; Arumugam et al., 2013; Asokan et al., 2011). Moreover, failure modes discrimination on CAI loaded carbon/epoxy CFRP with AE analysis offered similar results (Arumugam et al., 2014). In particular, the two ranges of peak frequencies identified in between 112 and 180 kHz, which were attributed as a whole to interface-related damage modes (debonding and delamination), were in some cases overlapping. Parametric analysis was therefore performed on the AE hits ranging between 112 and 180 kHz to discriminate the debonding and delamination failure modes, as indicated in Figure 10, where the events of longer duration were related to delamination and where at higher frequencies, such as 136-180 kHz, while debonding was considered on the lower frequency range, such as 112-128 kHz.
Detailed analysis of the AE cumulative counts behavior plays a significant role in illustrating the damage mechanisms and failure evolution of composite laminates. The profile of AE cumulative counts curve significantly changes as the compression load increases. The investigation of AE cumulative counts of different composite laminates allows a sequential classification of distinct zones of damage during quasi-static compression loading. The damage profile includes three stages:
Stage 1: AE cumulative counts initiates (Location 1) directly after the onset of first damage and the curve advances with a slope closely equal to zero up to damage progression (Location 2).
Stage 2: A gradual variation in the slope of AE cumulative count curve. This moderate increment in the AE response is accentuated by the evolution of macroscopic damage modes (Location 2) like debonding of the fiber/matrix interface and minor fiber failure. Stage 3: A steep increase in the slope of cumulative curve (Location 3) can be noticed until up to rupture (Location 4). During final stages of mechanical loading, the counts of the AE waveform were much higher, associated with predominant fiber failure. This variation in the counts of AE hits was extensively reflected in the slope of AE cumulative counts curve at ultimate failure. This subsequent accumulation of different damage hits is emphasized by an exponential growth of cumulative counts.
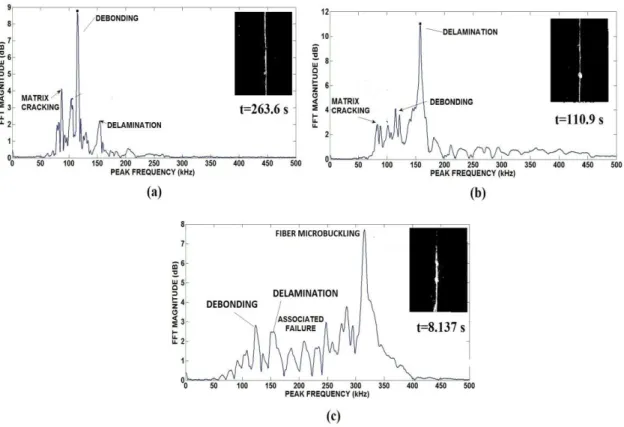
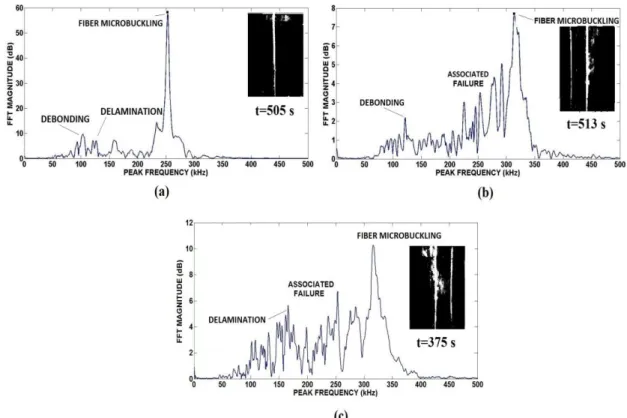
In Figure 9, as in Figure 11 to 15, four points during the compression loading have been marked as 1, 2, 3 and 4. The four consecutive points were respectively attributed:
1: damage initiation (first AE events detected)
2: damage propagation (DIC measures for the first time an increase of damaged area) 3: unstable damage growth (maximum CAI stress is reached)
ISSN: 2180-3811 Vol. 6 No. 2 July-December 2015
42 Figure 9. Peak frequency, Damaged area vs. Time for laminates subjected to:
ISSN: 2180-3811 Vol. 6 No. 2 July-December 2015
43 Figure 10. Peak frequency versus duration for AE hits between 112 and 180 kHz
on laminates subjected to triple impact
From Figure 11, AE cumulative counts were revealed higher for laminate subjected to triple impact, even during the initial stages of loading. It is important to note that AE activity was quite energetic also in periods during loading in which impact-damaged area did not substantially grow, in practice between point 1 and point 2. This occurs also in the case of laminate subjected to double impact, while in the case of laminate subjected to single impact, AE activity remains sparse and not significant up to point 2. To clarify what is the initial AE activity detected in the three cases (laminates subjected to single, double and triple impact events), in Figure 12, AE frequency spectra at point 1 are reported, from which fiber-related AE activity appears very considerable in the case of laminate subjected to triple impact. In Figures 13 to 15, AE frequency spectra at the points 2, 3 and 4 are reported: as loading stress increases, fiber micro-buckling events are increasingly prevalent, with greater evidence with laminates subjected to triple impact. It has been suggested elsewhere that such a prevalence of micro-buckling also on the laminate surface as far as load progresses, is due to the presence of localized delamination between the interior plies and the compressive stress creates an internal blister, gradually propagating to the edge of the plate (Berketis et al., 2008).
ISSN: 2180-3811 Vol. 6 No. 2 July-December 2015
44 Figure 11. AE cumulative counts, cumulative damaged area, and stress versus time during CAI loading for laminates subjected to: (a) Single, (b) Double and (c) Triple
ISSN: 2180-3811 Vol. 6 No. 2 July-December 2015
45 Figure 12. Frequency domain of AE signal at location 1 for (a) Single, (b)
Double and (c) Triple impacted specimens subjected to CAI test
Figure 13. Frequency domain of AE signal at location 2 for (a) Single, (b) Double and (c) Triple impacted specimens subjected to CAI test
ISSN: 2180-3811 Vol. 6 No. 2 July-December 2015
46 Figure 14. Frequency domain of AE signal at location 3 for (a) Single, (b) Double and
(c) Triple impacted specimens subjected to CAI test
Figure 15. Frequency domain of AE signal at location 4 for (a) Single, (b) Double and (c) Triple impacted specimens subjected to CAI test
ISSN: 2180-3811 Vol. 6 No. 2 July-December 2015
47 4.0 CONCLUSION
Glass/epoxy laminates with multiple impacts were subjected to CAI tests following impact at an energy slightly exceeding BVID monitored by acoustic emission. In addition, the images of the impacted laminates acquired during CAI loading were treated by digital image correlation (DIC) to measure the evolution of damaged area. The main conclusions observed can be summarized as follows:
i. Impact absorbed energy for laminates subjected to double impact was slightly lower than that of the ones that underwent single impact: this was attributed to the fact that matrix compaction makes the impacted site harder. The absorbed energy increases then after the third impact owing to the reduction of laminate rigidity. ii. The greatest reduction of CAI strength followed the first impact. For further
impacts, a limited reduction of CAI strength is still observed. It is suggested that damage modes during impact may change on whether this is performed on an intact laminate to impact or on an already impacted one, which may have consequences on CAI performance.
iii. The combined use of different techniques during CAI loading allowed establishing different growing levels of critical stress for the laminates, namely linked to damage initiation, where first AE events are detected; to damage propagation, where DIC starts detecting an increase of damaged area, and to unstable damage growth, where maximum CAI stress is reached.
iv. AE frequency analysis clarified that during CAI loading the prevalent mechanism is fiber microbuckling, which appears increasingly present for higher levels of compression stress and for growing number of impacts from one to three.
In general, online recording of the images obtained for impacted laminates subjected to compression loading and cumulative damage area estimated for the captured images provides better information about damage progression during the different stages of loading. It can be correlated with acoustic emission parameters, such as for example the increase in AE cumulative counts with respect to loading was well in agreement with increase in damage area. It may be concluded therefore that acoustic emission monitoring combined with digital image correlation during loading or pressurization will be used as a better tool to both qualitatively and quantitatively express the nature and extent of damage in composite laminates. As far as AE is concerned, this method could be applied on any composite material and on any damage mode due to the non-specific and non-contact nature of AE, which just detects the amplified "sound" coming from materials. More critical is correlating it with DIC, since acquisition of suitable images depends on the specific conditions of the laminate (color, transparency, roughness, etc.), so that not any material and condition would be adapted to perform this comparative analysis.
ISSN: 2180-3811 Vol. 6 No. 2 July-December 2015
48 REFERENCES
Abrate, S. (1998). Impact on composite structures. Cambridge, UK, Cambridge University Press.
Aktas, M., Karakuzu, R. & Arman, Y. (2009) Compression-after impact behavior of laminated composite plates subjected to low velocity impact in high temperatures. Composite Structures; 89 (1): 77–82.
Aoki, Y., Yamada, K., & Ishikawa, T. (2008) Effect of hygrothermal condition on compression after impact strength of CFRP laminates. Composites Science and Technology; 68 (6): 1376–1383.
Arumugam V, Kumar S, Santulli C, Sarasini F, Stanley, A.J. (2011a) A global method for the identification of failure modes in fibreglass using acoustic emission, Journal of Testing and Evaluation 39 (5): 954-966.
Arumugam, V., Kumar S, Santulli, C., & Stanley, A.J. (2011b) Effect of fiber orientation in uni-directional glass epoxy laminate using acoustic emission monitoring, Acta Metallurgica Sinica (English letters) 24 (5): 351-364.
Arumugam V, Kumar S, Santulli, C., Sarasini F, & Stanley, A.J. (2013) Identification of failure modes in composites from clustered acoustic emission data using pattern recognition and wavelet transformation, Arabian Journal for Science and Engineering 38 (5), 1087-1102.
Arumugam, V., Adhithya Plato Sidharth, A., Santulli, C., (2014) Failure modes characterization of impacted carbon fibre reinforced plastics laminates under compression loading using acoustic emission, Journal of Composite Materials 48 (28): 3457-3468.
Asokan, R., Arumugam, V., Santulli, C., Barath Kumar, S., & Joseph Stanley, A. (2011), Investigation of the strength of the failure modes in GFRP laminates using acoustic emission monitoring, International Journal of Polymers and Technologies 3 (2): 57-65.
Bar, H.N., Bhat, M.R. & Murthy, C.R.L. (2003) Identification of failure modes in GFRP using PVDF sensors: ANN approach. Composite Structures 65 (2): 231– 237.
Barre, S. & Benzeggagh, M.L. (1994) On the use of acoustic emission to investigate damage mechanism in glass-fibre reinforced polypropylene. Composites Science and Technology 52 (3): 369–376.
Berketis, K., Tzetzis, D., & Hogg, P.J. (2008) The influence of long term water immersion ageing on impact damage behaviour and residual compression strength of glass fibre reinforced polymer (GFRP), Materials & Design 29 (7): 1300–1310.
ISSN: 2180-3811 Vol. 6 No. 2 July-December 2015
49 Budianky, B., & Fleck, N.A. (1994) Compressive kinking of fibre composites: a topical
review. Applied Mechanics Review 47 (6): S246–S250.
Bussiba, A., Kupiec, M., Piat, R., & Böhlke, T. (2008) Fracture characterization of C/C composites under various stress modes by monitoring both mechanical and acoustic responses. Carbon 46 (4): 618–630.
Calabrò, A.M., Esposito, C., Lizza, A., Giordano, M., D’Amore, A., & Nicolais, L. (1998), Analysis of the acoustic emission signals associated to failure modes in CFRP laminates, ECCM 8 Conference Proceedings, Naples: 425-432.
Caneva, C., Olivieri, S., Santulli, C., & Bonifazi, G. (1993) Impact damage evaluation on advanced stitched composites by means of acoustic emission and image analysis. Composite Structures 25 (2): 121–128.
Cantwell, W.J. & Morton, J. (1991). The impact resistance of composite materials – a review. Composites; 22 (5): 347–362.
Chakraborty, D. & Kumar, M. (2005) Response of Laminated FRP Composites under Multiple Impact Loading. Journal of Reinforced Plastics and Composites 24 (14): 1457-1477.
de Freitas, M. & Reis, L. (1998) Failure to mechanisms on composite specimens subjected to compression after impact. Composite Structures 42 (4): 365–373. de Groot, P.J., Wijnen, P.A.M., & Janssen R.B.F. (1995) Real time frequency
determination of acoustic emission for different fracture mechanisms in carbon/epoxy composites. Composites Science and Technology 55 (4): 405–12. Delfosse, D & Poursartip, A. (1997), Energy-based approach to impact damage in
CFRP laminates. Composites: Part A 28 (7): 647–655.
Dzenis, Y. & Qian, J. (2001) Hybrid transient-parametric AE analysis of histories of damage micro mechanisms in composites. Advanced nondestructive evaluation for structural and biological health monitoring. Vol. 4335 of Proceedings of SPIE, International Society for Optical Engineering: 361-370.
Fleck, N.A., Sivashanker, S., & Sutcliffe, M.P.F. (1997), Compressive failure of composites due to microbuckle growth. European Journal of Mechanics A/Solids; 16 (1): 65–82.
Ghelli, D. & Minak, G. (2011). Low velocity impact and compression after impact tests on thin carbon/epoxy laminates. Composites: Part B 42: 2067–2079.
Giancane, S., Panella, F.W., Nobile, R., & Dattoma, V. (2010) Fatigue damage evolution of fiber reinforced composites with digital image correlation analysis. Procedia Engineering 2 (1): 1307-3015.Grosse, C.U. & Linzer, L.M. (1998) Signal-based AE analysis. Acoustic Emission Testing, Springer: 53–99.
ISSN: 2180-3811 Vol. 6 No. 2 July-December 2015
50 Gustin, J., Joneson, A. & Matinfalah, M. (2005) Low velocity impact of combination kevlar/carbon epoxy fibre sandwich composites. Composite Structures 69 (4): 396–406.
Hamstad, M.A., Whittaker, J.W., & Brosey WD. (1992) Correlation of residual strength with acoustic emission from impact-damaged composite structures under constant biaxial load. Journal of Composite Materials; 26: 2307–28.
Icten, B.M. (2009). Repeated impact behavior of glass/epoxy laminates, Polymer Composites 30 (11): 1562-1569.
Li G, Pang S-S, Helms, J.E. & Ibekwe, S.I. (2000). Low velocity impact response of GFRP laminates subjected to cycling moistures. Polymer Composites, 21 (5): 686-695.
Naik, N.K., Borade, S.V., Arya, H., Sailendra, M., Prabhu, S.V. (2002) Experimental studies on impact behaviour of woven fabric composites: effect of impact parameters. Journal of Reinforced Plastics and Composites; 21 (15): 1347– 1362.
Ni, Q., & Iwamoto, M. (2002) Wavelets transform of acoustic emission signals in failure of model composites. Engineering Fracture Mechanics 69 (6):717–728. Park, J.M., Kim, J.W., & Yoon, D.J. (2002) Interfacial evaluation and microfailure
mechanisms of single carbon fiber/bismaleimide composites by tensile and compressive fragmentation tests and acoustic emission. Composites Science and Technology 62 (6): 743–56.
Prabhakar, P. & Waas, A.M. (2013) Interaction between kinking and splitting in the compressive failure of unidirectional fibre reinforced laminated composites. Composite Structures 98: 85–92.
Pritchard, J.C. & Hogg P.J. (1990) The role of impact damage in post-impact compression testing, Composites 21 (6): 503-511.
Ramirez-Jimenez, C.R., Papadakis, N., Reynolds, N., Gan, T.H., Purnell, P., & Pharaoh, M. (2004) Identification of failure modes in glass/polypropylene composites by means of the primary frequency content of the acoustic emission event. Composites Science and Technology 64 (12):1819–1827.
Santulli, C. (2003) Study of impact hysteresis curves on E-glass reinforced polypropylene laminates, Journal of Materials Science Letters 22 (22): 1557-1562.
ISSN: 2180-3811 Vol. 6 No. 2 July-December 2015
51 Santulli, C. (2012) Matrix cracking detection by acoustic emission in polymer composites and counts/duration ratio. E – Journal of Non-Destructive Testing 17(11).
Short, G.J, Guild, F.J. & Pavier, M.J. (2002) Post-impact compressive strength of curved GFRP laminates, Composites Part A: Applied Science and Manufacturing 33 (11), 1487–1495.
Siow, Y.P. & Shim, V.P.W. (1998). An experimental study of low velocity impact damage in woven fibre composites. Journal of Composite Materials, 32 (12): 1178–1202.
Voelker, M.J. (1991). Low temperature impact properties of long fiber thermoplastic composite molding materials. Polymer Composites, 12 (2): 119-121.
Wyrick, D.A. & Adams D.F. (1988) Residual strength of a carbon/epoxy composite material subjected to repeated impact. Journal of Composite Materials 22 (8): 749–765.
Zhang, X., Davies, G.A.O. & Hitchings D (1999). Impact damage with compressive preload and post-impact compression of carbon composite plates. International Journal of Impact Engineering; 22: 485–509.