Brain morphometry in Multiple Sclerosis
Short title: Brain morphometry in MSLipp Ilona*1,2, Muhlert Nils*2,3, Tomassini Valentina1,2,4
*Joint first authors
1 Institute of Psychological Medicine and Clinical Neurosciences, Cardiff University School of Medicine, Cardiff, UK 2 Cardiff University Brain Research Imaging Centre (CUBRIC), School of Psychology, Cardiff, UK
3 School of Psychological Sciences, University of Manchester, Manchester UK. 4 IRCCS Fondazione Santa Lucia, Rome, Italy
Key words:
multiple sclerosis, MRI, atrophy, cortical thickness, brain volume, cognition, disability Word count:
Abbreviations
BMS: benign multiple sclerosis CNS: central nervous system CSF: cerebrospinal fluid
DMT: disease-modifying treatment DTI: diffusion tensor imaging
EDSS: expanded disability status scale GM: gray matter
MRI: magnetic resonance imaging MS: multiple sclerosis
MSFC: multiple sclerosis functional composite RRMS: relapsing-remitting multiple sclerosis PPMS: primary progressive multiple sclerosis SPMS: secondary progressive multiple sclerosis VBM: voxel-based morphometry
WM: white matter
Introduction
Multiple sclerosis (MS) is an autoimmune condition of the central nervous system (CNS) characterized by recurrent episodes of inflammation with demyelination and neurodegeneration1.
These episodes manifest themselves through a variety of symptoms, most commonly affecting motor, sensory, visual and cognitive functions2. MS usually onsets in young adulthood (aged 20-40
years) and is more common in women. In the majority of cases, after a clinically isolated syndrome, MS evolves in a relapsing-remitting form, followed by secondary progression (SPMS); a progressive worsening of clinical disability over time, with an insidious onset, characterizes the primary progressive form of the disease (PPMS)3.
MS is characterized by an immune attack against the myelin sheaths surrounding the axons of the neurons4. This inflammation can lead to axonal damage5. Evidence of neurodegeneration that
extends beyond the areas of inflammation suggested that there is a primary neurodegenerative component in MS, followed by secondary inflammation6–8.
Inflammatory damage in MS can be detected with magnetic resonance imaging (MRI)9, which has
been used both as a diagnostic and a prognostic tool. MS lesions in the white matter (WM) can be seen as hyperintense on T2-weighted acquisitions. Active lesions are detected as hyperintense areas on T1-weighted scans acquired after the injection of the contrast agent Gadolinium-DTPA and indicate a breakdown in the blood-brain barrier. Hypointense lesions visible on post-contrast T1-weighted scans reflect severe tissue damage and are called “chronic black holes”10,11. Lesions also
occur in the gray matter (GM)12 and are characterized by transection of axons and dendrites as well
as cell death13. GM lesions histopathologically differ from WM lesions, as they do not involve
breakdown of the blood brain barrier, and show significantly less inflammation14–16.
MS lesions have traditionally been the main focus of disease diagnosis17, prognosis18 and response
to treatment19,20. More recently, MS research has turned its focus to GM abnormalities and brain
volume loss not only as prognostic factors21, but also as outcome measures of clinical trials
assessing the efficacy of disease modifying treatments (DMTs)22. In this chapter, we discuss the
available methods for measuring MS pathology in the brain GM using MRI. We then discuss potential causes for GM changes and the relationship with damage in WM. Last, we outline the
relationship between GM damage and disability, and its potential applicability to monitor and predict disease evolution. This chapter will not cover global or tract-specific WM atrophy, or atrophy of the spinal cord and optic nerve, despite their undisputed contribution to symptom and disease severity23–25. The term atrophy will be used to describe a decrease in GM volume over time.
In contrast, we will use the term volume loss to describe a mean difference between patients with MS and healthy controls.
Measuring atrophy in MS: common methods and challenges
Brain volume is commonly measured using high-resolution T1-weighted MRI scans. Isotropic resolutions of, or around, 1 mm can be acquired within clinically feasible times (<10 minutes) and have sufficient contrast for distinguishing separate tissue classes (e.g. GM, WM, cerebrospinal fluid [CSF]). Delineation of specific structures is occasionally carried out using manual tracing, but the vast majority of studies use automated analytic techniques for estimating volume. These automated techniques benefit from less user bias, are highly reproducible and demonstrate comparable results to manually-defined region-of-interest approaches26 .
Segmentation algorithms first separate the brain images into different tissue classes. Tissue fractions can be generated by dividing each tissue volume by the summed GM, WM and CSF volumes, called the intracranial volume. Regional brain volumes can also be estimated by voxel-based morphometry (VBM) or shape-based parcellation algorithms. The former relies on registration of each voxel within the image to a common template, with the amount of warping needed to move voxels from their original, native space into the common space serving as an index of regional volume. Common analysis routines used for VBM are implemented in the Statistical Parametric Mapping (SPM; Wellcome Trust Centre for Neuroimaging, UCL Institute of Neurology, http://www.fil.ion.ucl.ac.uk)27 software and in FSL (the FMRIB Software Library, where FMRIB is
the Oxford Centre for Functional MRI of the Brain28). Shape-based parcellation of sub-cortical
structures (such as the hippocampus, thalamus and caudate nucleus) can be carried out using Freesurfer29,30 or FSL’s FIRST (FMRIB’s Integrated Registration and Segmentation Tool31), which
exploits the probabilistic relationships between the intensity and shape of these structures. Use of shape-based parcellation routines is particularly advantageous for determining volumes of striated structures (i.e. those containing both GM and WM), like the thalamus and globus pallidus, which can be challenging to segment using standard techniques. Alternatively, surface-based analysis methods can be used to measure the cortical surface area or cortical thickness, using the Freesurfer software32. The variety of software tools available provides a number of choices for measuring brain
tissue volumes in people with MS. These methods are not free from confounds, as the algorithms used by each software package can affect the final results. The results of VBM analysis can differ depending on whether it is carried out in SPM or FSL33,34. This can be relatively small differences
introduced by segmentation algorithms, through to large differences introduced by registration algorithms and statistical approaches. The lack of a gold-standard for measuring volume precludes calibration of algorithms, or even an assessment of which software offers the most accurate results. A number of potential confounds are known to affect findings in studies of brain volume and cortical thickness. VBM results may be influenced by the field strength, with regional differences seen when comparing images acquired on 1.5 T and 3 T MRI scanners35. Many clinical studies are
conducted on hospital scanners with 1.5 or 1 T field strengths. The choice of smoothing kernel can also influence findings36, as well as the use of modulation, a scaling method, which maintains local
volume size during registration to standard space37. Additional factors specific to MS should also be
considered. In MS, the presence of WM lesions can affect both estimates of GM volumes38 and
intensities into WM signal intensity distributions, affecting the estimation of the boundary between different tissue classes, and subsequent tissue volumes. The bias caused by WM lesions can be minimised by marking and “filling” lesions using mean WM intensities from the whole brain38 or
from the surrounding neighbouring voxels of lesions39–42.
Regional distribution of GM volume changes
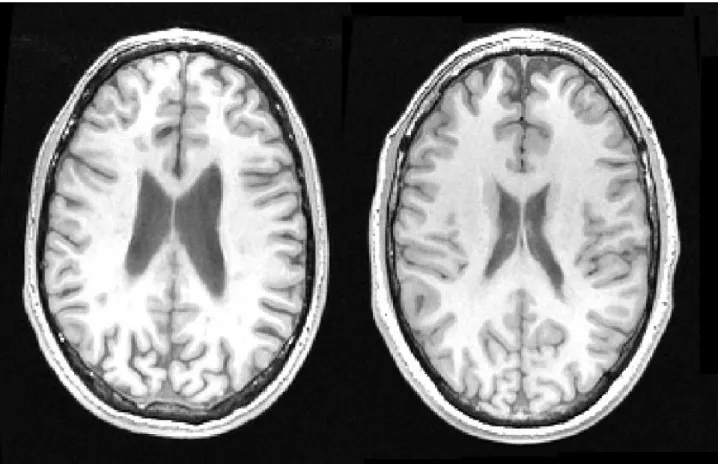
Most studies on GM volume in MS have examined global whole brain or GM volume. Most commonly used measures have been brain parenchymal fraction (BPF; e.g. Bermel et al.43) or the
width of the third ventricle (a surrogate marker of brain atrophy). Both suggest decreased total brain volume in MS patients relative to healthy controls44–48, and ventricle size is highly correlated with
BPF49. Enlarged ventricles are commonly observed in MS brains with long disease duration
(FIGURE 1).
# include FIGURE 1 #
MS related damage is not randomly distributed over the brain1. In the WM, lesions are particularly
common within periventricular regions, such as those neighbouring the lateral ventricle and in the superior and posterior corona radiata. This observation has been quantitatively confirmed by demonstrating highly consistent lesion probability maps across studies50–53. Similarly, within GM,
demyelinated lesions, which are more frequently sub-pial, are seen along the entire cortical ribbon, but their incidence and size are significantly larger in cortical sulci, and in deep invaginations of the
brain surface1. GM and WM damage do not happen completely independently and histochemistry
shows that GM neurodegenerative processes are mostly pronounced in the cortex overlaying
sub-Figure 1: left: T1 weighted axial brain slice of a 36 year old male with RRMS and a disease duration of 12 years. Right: scan acquired with the same parameters in similar location of a male of the same age.
cortical demyelinated lesions1. Histopathological16,54,55 and neuroimaging studies56 show the greatest
number of cortical lesions in the frontal and temporal lobes. However, comparing patients with healthy controls, GM volume loss has been reported throughout cortical and sub-cortical areas. Individual studies have reported significant loss within the cingulate cortex57,58, temporal lobe57,59,
insula59,60 and cerebellum57,60,61. A meta-analysis of 19 studies62 has concluded that GM loss in
RRMS and CIS is most pronounced in the thalamus and basal ganglia, within the cingulate cortex and around the central gyrus. Cortical thinning in MS patients compared to healthy controls has been found in frontal, parietal, occipital, temporal and insular lobes63–66. The volume loss in MS
patients compared to healthy controls is likely a result of higher atrophy rates. In a longitudinal study conducted with patients with PPMS, Eshaghi et al.67 showed regional differences in GM
atrophy, with the greatest atrophy observed in the cingulate gyri. Regional differences in GM atrophy studies may be influenced by methodological factors, as discussed above. Despite this caution, it is clear that atrophy in MS occurs in both cortical and sub-cortical GM.
The basal ganglia form complex circuits with cortical and sub-cortical structures and are involved in motor and cognitive functions68. In RRMS, focal atrophy within basal ganglia structures has been
reported, with up to 20% volume loss within the caudate nuclei49,69. Many basal ganglia circuits also
involve the thalamus, which coordinates several sensory-motor pathways and has been viewed as a hub between cortical and sub-cortical regions. Thalamic volume changes are frequently reported in MS70, with neuronal volume loss at levels up to 30%45,71. Thalamic atrophy impacts significantly
upon cortical functional networks in MS72. Indeed given the role of the thalamus as a hub region in
the brain, it has become clear that GM volume within this region may be one of the most important predictors of clinical and cognitive dysfunction in MS73–75.
Interplay between GM and WM pathology
The processes that characterise MS occur primarily through loss of myelin, followed by axonal degeneration as a result of demyelination and subsequent metabolic changes76. MRI research in MS
was initially dominated by a focus on WM changes. Despite increasingly common investigations of GM changes, at a theoretical level these effects are persistently attributed mainly to prior WM changes66. This attribution is partly supported by evidence that the distribution of GM damage
throughout the brain is in part related to damage to connected WM. This relationship has been shown using WM lesions and also more subtle changes in “normal appearing” WM. For example, the ventricular enlargement seen in the lateral and third ventricles is associated with the total volume of WM lesions77. Also, regional GM atrophy in MS can be statistically predicted by
diffusion tensor imaging (DTI) metrics (probing microstructural alterations) in connected WM
tracts66. This relationship between GM and WM damage was observed in both deep and cortical
GM in those with RRMS, and with deep GM in those with SPMS. These findings provide a clear link between WM and GM changes, but also suggest that pathology in different subtypes of MS may be driven by separate pathophysiological mechanisms1. We do not yet know the order in which
different forms of pathology occur, or what drives each form of pathology, but well-designed longitudinal imaging studies in MS can help to address these questions.
The thalamus has also been well studied in MS, with evidence suggesting that it may be both directly affected by GM pathology and indirectly affected by WM pathology in connected tracts. A correlation between total lesion volume and GM volume in the thalamus has been reported repeatedly78–81. In people with clinically isolated syndrome (CIS), thalamocortical tracts show a
tenfold higher lesion density than other tracts82. In the same study, lesion volume specifically within
these thalamo-cortical tracts was found to significantly predict thalamic volume. Similarly in MS, thalamic volume has been found to be associated with WM lesion volume and diffusion MRI
metrics (fractional anisotropy) in its connected tracts66. At histopathology, substantial deep GM
pathology is seen in MS, with focal demyelinating lesions, inflammation and diffuse neurodegeneration83. However, a recent MRI study has identified substantial GM abnormalities on
magnetisation transfer imaging in GM regions neighbouring ventricles, suggesting the role of CSF factors in driving pathology84. This interesting hypothesis is supported by the general finding that
deep GM lesions tend to follow ventricles and CSF, providing an alternative pathophysiological mechanism for atrophy in deep GM structures16.
Atrophy and the influence of disease stage
Throughout adulthood the normal brain shrinks and the rate of shrinkage accelerates throughout the lifespan. In MS this shrinking happens faster, at a rate of about 0.5% per year compared to 0.3% per year in healthy controls85–87. Some studies report even higher atrophy rates of up to 2%88,89, and
atrophy rates may be higher still in those with faster disease evolution90. This increase in atrophy
rate can explain the, often substantial, brain volume differences between MS patients and healthy controls90,91. Volume loss compared to controls has been reported in RRMS62,92, as well as in
progressive forms67,93,94.
It has been argued that MS is a neurodegenerative disease and it enters the progressive stage when the brain's capacity to compensate for damage has exceeded its limit6. With this in mind, one would
expect GM damage to be more extensive and accelerated in progressive stages, which is supported by histological studies83,95, but which is not always found in MRI studies46,96,97. Some studies suggest
that the spatial distribution of atrophy differs between disease subtypes and could be responsible for the different clinical phenotypes1,77.
GM volume loss has been observed at the earliest stages of the disease, with changes apparent in patients with CIS, i.e. those who have experienced a single inflammatory event and in whom MS has not yet been diagnosed. Cross-sectional studies report GM volume loss in whole brain GM98,
the thalamus, basal ganglia and brain stem in CIS99 and within both deep GM and cortical areas60.
However, these findings are not consistently seen, with many failing to show GM alterations98,100,101.
Differences in the nature of samples could help to explain these inconsistencies. For example, CIS patients with higher lesion load have been found to have lower sub-cortical GM volumes102.
Additionally, there are likely to be differences between those with CIS who eventually convert to MS and those who do not. “Converters” have been found to show lower GM volume before conversion compared to “non-converters”61, as well as higher GM atrophy rates within the first few
years after the clinical event103,104.
Ceccarelli et al.100 found significantly different rates of GM volume loss among clinical phenotypes
(CIS, RRMS, SPMS, and PPMS), with it being highest in SPMS patients. Similarly, lower GM volume has been reported for RRMS when compared to patients with progressive MS98,105,106. Such
comparisons may sometimes be confounded by the typically longer disease duration and older age of SPMS compared to RRMS patients, as disease duration influences brain volumes in both RRMS and SPMS89. However, other factors are likely to have a greater influence, as a longitudinal study
has demonstrated that RRMS patients who later convert to progressive course show lower baseline BPF and GM and greater decreases in these metrics than those who do not convert within the subsequent four years87. Therefore, it is likely that pathophysiological mechanisms relating to the
progressive pathology of MS accelerate volume changes over and above the effects of age or disease duration. Additionally, the regional distribution of volume loss seems to differ between early MS and later stages of progressive MS107.
One approach to study the influence of disease severity on GM volume is by comparing patients with benign MS (BMS)108 to MS patients with a similar disease duration but more severe disease.
Patients with BMS show lower GM volumes than healthy controls79, but also lower cortical lesion
volume109 and less severe GM volume changes than patients with RRMS98,110 or SPMS79. Some
evidence indicates that it may be the spatial distribution of GM changes, rather than the extent, that differs between patients with BMS and other patients53. Additionally, patients with clinically BMS,
but cognitive deficits do have GM volume loss similar to more severe forms of MS111.
Only a few longitudinal studies have directly compared atrophy rates between disease subtypes. Ge et al.89 compared rates between RRMS and SPMS, reporting a 2% annual decrease in brain volume
in SPMS and a 1.5% decrease in RRMS, but this difference was not statistically significant. Similarly, Kalkers et al.112 and De Stefano et al.85 showed no differences in annualized atrophy rate
between MS subtypes. Korteweg et al.113 suggest that patients with higher baseline lesion volume
have a greater atrophy rate over the subsequent two years. Looking at cortical thickness, Calabrese
et al.107 demonstrated a faster change over time in SPMS and late RRMS than in early RRMS.
Studies examining BMS suggest that it may be characterized by slower rates of atrophy than patients with more active early MS110,114. Possible confounds for studies comparing atrophy rates
across different disease subtypes are the baseline characteristics of the cohorts115. Larger scale
studies are needed to identify predictors of brain atrophy rates.
Mechanisms leading to GM atrophy
As GM volume loss seems to be a hallmark in MS and relates to both disease severity and disease prognosis116, identifying the mechanisms underlying GM atrophy in MS could offer useful tools for
both monitoring the disease and measuring the efficacy of therapeutic interventions117. In order to
identify and understand the molecular and cellular processes underlying the GM changes visible on MRI, a combination of histopathological evidence and advanced brain imaging tools is crucial. Initial views on disease mechanisms in MS focused on axonal loss as the cause for degeneration of connected GM tissue (i.e. Wallerian degeneration). A recent line of thought is that MS is not initially triggered by the immune system malfunctioning (outside-in hypothesis118) but that
demyelination may be the underlying disease mechanism, with myelin debris then triggering the immune system to react, amplifying the tissue damage (inside-out hypothesis6). This view was
bolstered by Stys et al.8, amongst others, based on evidence that demyelination also occurs in areas
with low levels of inflammation (such as the GM13), which argues against a purely
inflammation-driven disease process; note that cortical inflammation has been reported in early MS119,120 and
meningeal inflammation might be involved in cortical neuronal loss121. In either case, the
demyelination that co-occurs with inflammation triggers several mechanisms that can affect the GM.
Recently, attention has been drawn to the involvement of mitochondria and energy metabolism following demyelinating events122. These biochemical processes can also trigger neuronal loss in
MS tissue. Active microglia and macrophages, which are present at inflammatory sites, release radical oxygen species and nitric oxide, which can oxidize macromolecules in the neurons, inhibit their function, and promote their degeneration123. In particular, radical oxygen and nitric oxygen
species can impact upon mitochondrial function as they directly inhibit parts of the respiratory chain124. Additionally, due to demyelination, ion channels are rearranged along the axons of the
neurons, and more energy is needed for ion transport. This can lead to an increase in non-energy demanding ion exchange mechanisms and to a Ca2+ overload in the cell, further triggering mechanisms of neurodegeneration124. Iron is stored as ferritin in myelin and if myelin is destructed,
iron starts to move freely and contributes to oxidative stress76. An increased demand in energy
coupled with energy deficiency can lead to cell death and axonal transection. These findings suggest that axonal loss and demyelination can affect GM damage in both direct and indirect ways.
In a recent paper, Haider et al.1 distinguish two main patterns of neurodegeneration. The first is
characterized by retrograde degeneration and the pattern of damage that follows WM lesions, as discussed above. The second is related to oxidative stress and happens across the entire cortex. Combining ex vivo MRI scanning with histology in post-mortem studies can help to understand which of these molecular processes underlie MRI measures of GM volume. For example, Popescu et al.125 found that neuronal density, neuronal size and axonal density all contribute to GM volume
measures. Therefore, axonal degeneration, as well as demyelination, could contribute to in vivo measures of GM atrophy. In deep GM, there is reduced neuronal density in MS patients compared to healthy controls, with lower neuronal density in demyelinated MS brain tissue than in non-demyelinated tissue, and lower neuronal density in non-non-demyelinated MS brain tissue compared to healthy control tissue16,45. These findings indirectly suggest that the GM volume loss detected with
MRI might be at least influenced by neuronal loss triggered by demyelination.
As with most studies of MRI changes in MS, imaging studies investigating GM changes are challenging to carry out. For example, it is estimated that only a small subset of existing cortical lesions can be detected with conventional MRI methods126,127. Therefore, abnormalities and changes
in GM volume measures may reflect the presence of undetected GM lesions14. In support of this
view, non-lesional MS cortical tissue shows similar cell density (neuronal, glial and synaptic density) to tissue in healthy volunteers128. A recent MRI study investigated the spatial
co-localisation of GM lesions and atrophy and found only weak correspondance129. In a longitudinal
study107 the appearance of new cortical lesion correlated with cortical atrophy early in the disease
course, but only when averaged across the whole GM and not on a region by region basis. Even if undetected GM lesions contribute to findings of GM atrophy in MS, it still needs to be resolved whether this is a methodological effect (e.g. different relaxation time in lesioned GM) or whether the cellular changes within lesions (e.g. cell death) compromise GM volume. Another challenge concerns the registration between MRI data and histological slices. Newer methods such as CLARITY, which permits histological assessment in intact tissue, will allow more direct links and comparisons between MRI images and histology130.
Application and predictive value of GM volume measures
Whilst the mechanisms underlying GM atrophy are not fully understood, GM volume measures might be useful as markers for disease evolution and prognosis22. WM lesion count and volume
remain the most commonly used clinical outcome measures for pharmaceutical studies, as DMTs aim to reduce risk of developing new lesions and new symptoms. However, there are substantial drawbacks to an exclusive focus on WM pathology. The correlation between WM lesion load and disability scores is inconsistent, a phenomenon often referred to as the “clinico-radiological paradox”131. It is unclear whether this paradox is caused by methodological limitations, such as
missed lesional tissue132,133, or whether parameters other than lesions are better predictors of MS
damage. Increasingly, researchers have focussed on the relationship between atrophy and disability. It has been proposed that GM volume can explain some of the remaining variance, and may even be a better indicator of disease progression and clinical outcome than WM damage134,135. Only recently
studies have started looking at the effects of drugs on GM atrophy, with DMTs having been shown to slow atrophy rates22.
The clinical relevance of whole brain and regional GM volumes can be established by examining their associations with disability scores. The heterogeneity of disability in MS creates obvious challenges when assessing this relationship. The symptoms cover a wide range of sensory, motor and cognitive dysfunctions, which creates difficulties when summarising overall disability levels. The most commonly used measure of disability is the expanded disability status scale (EDSS136),
which is based on the neurological examination of various functional systems, but is primarily affected by the mobility of a patient. The second most frequently used measure of disability is the multiple sclerosis functional composite (MSFC137), which consists of tests of mobility, fine motor
skills and cognition. The range of symptoms covered by the EDSS and MSFC makes pinpointing of regional associations between disability and GM atrophy challenging. Additionally, the EDSS scale is not an interval scale, which makes it statistically more challenging to detect clinical-MRI associations138. Despite these limitations, a number of studies have reported negative correlations
between disability scores and GM volume measures in the form of either whole brain volume, GM volume, ventricular volume or cortical thickness46,49,87,98,106,139–142.
More regionally specific correlations have been demonstrated for cortical, as well as deep GM. Correlations between EDSS and GM volume and thickness were shown in the precentral, medial and superior frontal cortices, cingulate, insula and other cortical regions61,65,143, thalamus, putamen
and cerebellum61,102. In a more symptom specific analysis approach, Calabrese et al.
(2007)63 showed that the severity of motor symptoms was correlated with cortical thickness in the
precentral gyrus, while visual symptoms were correlated with thickness in the occipital cortex. Similarly, Henry et al. (2008)99 related cerebellar system symptoms with atrophy in the cerebellum,
and disability measured with the MSFC with atrophy in cerebellum, caudate and putamen.
Due to the variety of methods used, results across studies are far from consistent with some failing to find an association between disability and GM volumes or cortical thickness64,144. In an approach
to combine existing evidence, Lansley et al (2013)62 conducted a meta-analysis of 19 VBM studies
that had looked at the relationship between EDSS and GM volume. While widespread brain volume loss in patients compared to healthy controls was confirmed, the analysis revealed only a single cluster, in which GM volume was related to EDSS, encompassing the left pre- and post-central cortex.
The relationship between GM damage and cognition
A burgeoning area of MS research is the one exploring links between GM changes and cognitive impairment145. This work has become of increasing importance as the drugs used to treat MS have
proven effective in slowing disability worsening, but as yet have had limited impact on slowing cognitive decline145. GM lesions and volume are significant predictors of cognitive impairment,
both in cross-sectional146 and longitudinal studies147. GM lesions and atrophy are independent
predictors of cognitive function129, emphasising the need to consider each separately. In addition,
other MRI metrics have proved useful for understanding cognitive changes, such as alterations in the complexity of diffusion in GM148,149, or abnormally low levels of glutamate in relevant GM
regions150. These changes offered similar or greater predictive value than measures of regional brain
volume alone, so complement the use of conventional imaging techniques when trying to understand the role of subtle structural GM damage on cognitive impairment.
Atrophy rate correlates with disability change
that show how both of these variables change in synchrony. The change of GM volume per year has been shown to correlate with change of disability as measured by EDSS and MSFC67,77,87,139,151–155.
This is the case even when correlating the short term change of GM volume with long term change in disability139, suggesting that brain atrophy may not spontaneously slow down. Even GM volume
at baseline can predict disease progression. Most of this evidence comes from studies comparing CIS patients who convert to MS with patients who do not convert. In particular, lower baseline GM volume and more pronounced GM atrophy are reported in “converters”61,87,103.
Recent studies by Filippi et al.156 and Popescu et al.157 showed that baseline GM atrophy can predict
EDSS up to 13 years later even when controlling for baseline EDSS157.
The size of these reported effects are all small but statistically significant at a group level. This makes it difficult to predict an individual patient's prognosis based on their MRI scans. Additionally, the effects seem to be wide-spread across the brain with regional differences between studies, making it challenging to judge which GM measures are the most useful brain imaging markers and predictors of disability progression. In order to identify markers suitable for assessing an individual's prognosis we need further information about “normal” and “pathological” rates of atrophy. De Stefano et al.85 attempted to find a cut-off in annualised percent brain volume change
that differentiates patients from controls, as well as patients with strong disability incline from patients with weak disability incline. As the effects of GM atrophy seem to be regionally dependent, region specific markers might allow even higher specificity and sensitivity. This needs large, multi-centre longitudinal studies with clear validation samples.
Atrophy as an outcome measure in clinical trials
Due to the increasing evidence of the importance of GM pathology in MS, GM volume measures are starting to be used as outcome measures in clinical trials. DMTs such as laquinimod158,
fingolimod159,160, interferon beta161–164 and glatiramer acitate162,164 have been shown to slow down GM
atrophy161–163 (for a review see De Stefano et al.22), but no effect165,166 or the opposite effect has also
been reported167. A recent trial based meta-analysis has indicated that DMTs may impact upon
disability through independent effects on both lesions and atrophy168.
Clinical trials using GM atrophy as an outcome measure have also had to contend with treatment-related decreases in volume. This “pseudoatrophy” can be seen as a paradoxical acceleration in brain volume loss following the initiation of therapy. It is thought to be caused by the resolution of inflammation, and may reflect a decrease in oedema169 or changes in the volume of inflammatory
cells, such as glial cells170. Studies of regional brain volume indicate that pseudoatrophy may be
confined to WM regions171, suggesting that VBM studies of GM volume may be less affected.
Summary & Conclusions
Substantial evidence supports the existence and clinical relevance of both cortical and sub-cortical GM volume loss and atrophy in all MS subtypes. Neuropathology1 and neuroimaging172 are
progressively clarifying the nature of GM pathology in MS and its relationship with WM damage173.
Improving further our understanding of the mechanisms underlying GM damage and the relationship between GM and WM damage remains a goal of future research. The clinical relevance of GM damage is supported by the association between clinical characteristics of MS and GM pathology. There is relationship between GM damage and the development of clinical disability, especially cognitive dysfunction145. GM plays a role in predicting the evolution of the disease, i.e.,
the conversion from CIS to MS and from RRMS to progressive MS61,87. GM damage is becoming a
relevant outcome measure for immunomodulatory22 and neuroprotective strategies174. Despite this
References
1. Haider L, Zrzavy T, Hametner S, et al. The topograpy of demyelination and
neurodegeneration in the multiple sclerosis brain. 2016:807-815. doi:10.1093/brain/awv398. 2. Weiner H, Stankiewicz J. Multiple Sclerosis: Diagnosis and Therapy. Vol 1st ed. (Weiner H,
Stankiewicz J, eds.). Wiley-Blackwell; 2012.
3. Lublin FD, Reingold SC, Cohen JA, et al. Defining the clinical course of multiple sclerosis The 2013 revisions. Neurology. 2014;83:278-286.
4. Steinman L. Multiple Sclerosis: A coordinated immunological attack against myelin in the central nervous system. Cell. 1996;85:299-302.
5. Bjartmar C, Trapp BD. Axonal and neuronal degeneration in multiple sclerosis: mechanisms and functional consequences. Curr Opin Neurol. 2001;14:271-278.
6. Trapp BD, Nave K. Multiple sclerosis : an immune or neurodegenerative disorder ? Ann Rev
Neurosci. 2008;31:247-269. doi:10.1146/annurev.neuro.30.051606.094313.
7. Hauser SL, Oksenberg JR. The neurobiology of multiple sclerosis : genes, inflammation, and neurodegeneration. Neuron. 2006;52:61-76. doi:10.1016/j.neuron.2006.09.011.
8. Stys PK, Zamponi GW, Minnen J Van, Geurts JJG. Will the real multiple sclerosis please stand up? Nature. 2012;13(507):514.
9. Tomassini V, Palace J. Multiple sclerosis lesions: insights from imaging techniques. Expert
Rev Neurother. 2009;9(9):1341-1359.
10. van Walderveen M, Kamphorst W, Scheltens P, et al. Histopathologic correlate of hypointense lesions on Tl-weighted spin-echo MRI in multiple sclerosis. Neurology. 1998;50(95):1282-1288.
11. Sahraian M et al. Black holes in multiple sclerosis: definition, evolution, and clinical correlations. Acta Neurol Scand. 2010;(122):1-8. doi:10.1111/j.1600-0404.2009.01221.x. 12. Kidd D, Barkhof F, Mcconnell R, Algra PR, Allen I V, Revesz T. Cortical lesions in multiple
sclerosis. 1999:17-26.
13. Peterson JW, Bö L, Mörk S, Chang A, Trapp B. Transected neurites, apoptotic neurons, and reduced inflammation in cortical multiple sclerosis lesions. Ann Neurol. 2001;50:389-400. doi:10.1002/ana.1123.
14. Geurts JJ, Barkhof F. Grey matter pathology in multiple sclerosis. Lancet Neurol. 2008;7(9):841-851. doi:10.1016/S1474-4422(08)70191-1.
15. Klaver R, De Vries HE, Schenk GJ, Geurts JJG. Grey matter damage in multiple sclerosis: a pathology perspective. Prion. 2013;7(1):66-75. doi:10.4161/pri.23499.
16. Vercellino M, Masera S, Lorenzatti M, et al. Demyelination, inflammation, and neurodegeneration in multiple sclerosis deep gray matter. J Neuropathol Exp Neurol.
2009;68(5):489-502. doi:10.1097/NEN.0b013e3181a19a5a.
17. Polman CH, Reingold SC, Banwell B, et al. Diagnostic Criteria for Multiple Sclerosis: 2010 Revisions to the McDonald Criteria. Ann Neu. 2011;69:292-302. doi:10.1002/ana.22366. 18. Pestalozza IF, Pozzilli C, Legge S Di, et al. Monthly brain magnetic resonance imaging scans
in patients with clinically isolated syndrome. Mult Scler. 2005;11(January):390-394. 19. Havrdova E, Galetta S, Hutchinson M, et al. Effect of natalizumab on clinical and
radiological disease activity in multiple sclerosis: a retrospective analysis of the Natalizumab Safety and Efficacy in Relapsing-Remitting Multiple Sclerosis (AFFIRM) study. Lancet
Neurol. 2009;8(March):254-260. doi:10.1016/S1474-4422(09)70021-3.
20. Tomassini V, Paolillo A, Russo P, et al. Predictors of long-term clinical response to interferon beta therapy in relapsing multiple sclerosis. J Neurol. 2006;253:287-293.
doi:10.1007/s00415-005-0979-5.
21. Sbardella E, Tomassini V, Stromillo ML, et al. Pronounced focal and diffuse brain damage predicts short-term disease evolution in patients with clinically isolated syndrome suggestive of multiple sclerosis. Mult Scler J. 2011;17(12):1432-1440. doi:10.1177/1352458511414602. 22. De Stefano N, Airas L, Grigoriadis N, et al. Clinical relevance of brain volume measures in
multiple sclerosis. CNS Drugs. 2014;28(2):147-156. doi:10.1007/s40263-014-0140-z. 23. Audoin B, I, Cozzone PJ, Pelletier J, Ranjeva J. Onset and underpinnings of white matter
atrophy at the very early stage of multiple sclerosis a two-year longitudinal MRI/MRSI study of corpus callosum. 2007;(May 2006).
24. Bernitsas E, Bao F, Seraji-bozorgzad N, et al. Spinal cord atrophy in multiple sclerosis and relationship with disability across clinical phenotypes. Mult Scler Relat Disord.
2015;4(1):47-51. doi:10.1016/j.msard.2014.11.002.
25. Schlaeger R et al. Spinal cord gray matter atrophy correlates with multiple sclerosis disability. Ann Neurol. 2014;76(5):568-580.
26. Bergouignan L, Chupin M, Czechowska Y, et al. NeuroImage Can voxel based
morphometry , manual segmentation and automated segmentation equally detect hippocampal volume differences in acute depression ? Neuroimage. 2009;45(1):29-37. doi:10.1016/j.neuroimage.2008.11.006.
27. Ashburner J. A fast diffeomorphic image registration algorithm. Neuroimage. 2007;38:95-113. doi:10.1016/j.neuroimage.2007.07.007.
28. Douaud G et al. Anatomically related grey and white matter abnormalities in adolescent-onset schizophrenia. Brain. 2007;130:2375-2386. doi:10.1093/brain/awm184.
29. Fischl B, Salat DH, Busa E, et al. Whole Brain Segmentation: Neurotechnique Automated Labeling of Neuroanatomical Structures in the Human Brain. Neuron. 2002;33:341-355.
Sequence-independent segmentation of magnetic resonance images. Neuroimage. 2004;23:69-84. doi:10.1016/j.neuroimage.2004.07.016.
31. Patenaude B, Smith SM, Kennedy DN, Jenkinson M. NeuroImage A Bayesian model of
shape and appearance for subcortical brain segmentation. Neuroimage. 2011;56(3):907-922. doi:10.1016/j.neuroimage.2011.02.046.
32. Gogtay N, Giedd JN, Lusk L, et al. Dynamic mapping of human cortical development during
childhood through early adulthood. PNAS. 2004;101(21):8174-8179.
33. Rajagopalan V, Yue GH, Pioro EP. Do Preprocessing Algorithms and Statistical Models Influence Voxel-Based Morphometry ( VBM ) Results in Amyotrophic Lateral Sclerosis Patients ? A Systematic Comparison of Popular VBM Analytical Methods. J Magn Reson Imaging. 2014;667:662-667. doi:10.1002/jmri.24415.
34. Muhlert N, Ridgway GR. Discussion forum Failed replications , contributing factors and careful interpretations : Commentary on “ A purely confirmatory replication study of structural brain- behaviour correlations ” by Boekel et al ., 2015. CORTEX. 2015:1-5. doi:10.1016/j.cortex.2015.02.019.
35. Tardif CL, Collins DL, Pike GB. Regional Impact of Field Strength on Voxel-Based Morphometry Results. Hum Brain Mapp. 2010;957:943-957. doi:10.1002/hbm.20908.
36. Shen S, Sterr A. Is DARTEL-Based Voxel-Based Morphometry Affected by Width of
Smoothing Kernel and Group Size ? A Study Using Simulated Atrophy. J Magn Reson Imaging. 2013;1475:1468-1475. doi:10.1002/jmri.23927.
37. Radua J, Canales-rodríguez EJ, Pomarol-clotet E, Salvador R. NeuroImage Validity of modulation and optimal settings for advanced voxel-based morphometry. Neuroimage. 2014;86:81-90. doi:10.1016/j.neuroimage.2013.07.084.
38. Chard DT, Jackson JS, Miller DH, Wheeler-kingshott CAM. Reducing the Impact of White
Matter Lesions on Automated Measures of Brain Gray and White Matter Volumes. J Magn
Reson Imaging. 2010;228:223-228. doi:10.1002/jmri.22214.
39. Magon S, Gaetano L, Chakravarty MM, et al. White matter lesion filling improves the accuracy of cortical thickness measurements in multiple sclerosis patients : a longitudinal study. BCM Neurosci. 2014;15(1):1-10. doi:10.1186/1471-2202-15-106.
40. Sdika M, Pelletier D. Nonrigid Registration of Multiple Sclerosis Brain Images Using Lesion Inpainting for Morphometry or Lesion Mapping. Hum Brain Mapp. 2009;1067:1060-1067. doi:10.1002/hbm.20566.
41. Battaglini M, Jenkinson M, Stefano N De. Evaluating and Reducing the Impact of White Matter Lesions on Brain Volume Measurements. Hum Brain Mapp. 2012;33:2062-2071. doi:10.1002/hbm.21344.
42. Gelineau-morel R, Tomassini V, Jenkinson M, Johansen-berg H, Matthews PM, Palace J. The
Multiple Sclerosis. Hum Brain Mapp. 2011. doi:10.1002/hbm.21402.
43. Bermel R a., Sharma J, Tjoa CW, Puli SR, Bakshi R. A semiautomated measure of
whole-brain atrophy in multiple sclerosis. J Neurol Sci. 2003;208(1-2):57-65. doi:10.1016/S0022-510X(02)00425-2.
44. Berg D, Mäurer M, Warmuth-Metz M, Rieckmann P, Becker G. The correlation between
ventricular diameter measured by transcranial sonography and clinical disability and cognitive dysfunction in patients with multiple sclerosis. Arch Neurol. 2000;57(9):1289-1292. doi:10.1001/archneur.57.9.1289.
45. Cifelli A, Arridge M, Jezzard P, Esiri MM, Palace J, Matthews PM. Thalamic neurodegeneration in multiple sclerosis. Ann Neurol. 2002;52(5):650-653. doi:10.1002/ana.10326.
46. De Stefano N, Matthews PM, Filippi M, et al. Evidence of early cortical atrophy in MS: relevance to white matter changes and disability. Neurology. 2003;60(7):1157-1162. doi:10.1212/01.WNL.0000055926.69643.03.
47. Lin X, Blumhardt LD, Constantinescu CS. The relationship of brain and cervical cord volume to disability in clinical subtypes of multiple sclerosis: a three-dimensional MRI study. Acta Neurol Scand. 2003;108(6):401-406. doi:10.1046/j.1600-0404.2003.00160.x. 48. Ramasamy DP, Benedict RHB, Cox JL, et al. Journal of the Neurological Sciences Extent of
cerebellum , subcortical and cortical atrophy in patients with MS A case-control study. J
Neurol Sci. 2009;282(1-2):47-54. doi:10.1016/j.jns.2008.12.034.
49. Bermel R a, Innus MD, Tjoa CW, Bakshi R. Selective caudate atrophy in multiple sclerosis: a 3D MRI parcellation study. Neuroreport. 2003;14(3):335-339.
doi:10.1097/00001756-200303030-00008.
50. Kincses Z. Lesion probability mapping to explain clinical deficits and cognitive performance in multiple sclerosis. Mult Scler. 2010;(DECEMBER). doi:10.1177/1352458510391342. 51. Bodini B, Battaglini M, Stefano N De, et al. T2 lesion location really matters: a 10 year
follow-up study in primary progressive multiple sclerosis. J Neurol Neurosurg Psychiatry. 2010. doi:10.1136/jnnp.2009.201574.
52. Perri C Di, Battaglini M, Stromillo ML, Bartolozzi ML. Voxel-Based Assessment of Differences in Damage and Distribution of White Matter Lesions Between Patients With Primary Progressive and Relapsing-Remitting Multiple Sclerosis. Arch Neurol.
2008;65(2):236-243.
53. Ceccarelli A, Rocca M a., Pagani E, et al. The topographical distribution of tissue injury in benign MS: A 3T multiparametric MRI study. Neuroimage. 2008;39(4):1499-1509.
doi:10.1016/j.neuroimage.2007.11.002.
54. Brownell B, Hughes JT. The distribution of plaques in the cerebrum in multiple sclerosis. J
55. Bo L et al. Subpial Demyelination in the Cerebral Cortex of Multiple Sclerosis Patients. J
Neuropathol Exp Neurol. 2003;62(7):723-732.
56. Calabrese M et al. Imaging distribution and frequency of cortical lesions in patients with multiple sclerosis. Neurology. 2010;75:1234-1240.
57. Bendfeldt K, Kuster P, Traud S, et al. Association of regional gray matter volume loss and progression of white matter lesions in multiple sclerosis - A longitudinal voxel-based
morphometry study. Neuroimage. 2009;45(1):60-67. doi:10.1016/j.neuroimage.2008.10.006. 58. Prinster A, Quarantelli M, Orefice G, et al. Grey matter loss in relapsing-remitting multiple
sclerosis: A voxel-based morphometry study. Neuroimage. 2006;29(3):859-867. doi:10.1016/j.neuroimage.2005.08.034.
59. Raz E, Cercignani M, Sbardella E, et al. Gray- and white-matter changes 1 year after first clinical episode of multiple sclerosis: MR imaging. Radiology. 2010;257(2):448-454. doi:10.1148/radiol.10100626.
60. Audoin B, Zaaraoui W, Reuter F, et al. Atrophy mainly affects the limbic system and the deep grey matter at the first stage of multiple sclerosis. J Neurol Neurosurg Psychiatry.
2010;81(6):690-695. doi:10.1136/jnnp.2009.188748.
61. Calabrese M et al, Rinaldi F, Mattisi I, et al. The predictive value of gray matter atrophy in clinically isolated syndromes. Neurology. 2011;77:257-263.
62. Lansley J, Mataix-Cols D, Grau M, Radua J, Sastre-Garriga J. Localized grey matter atrophy in multiple sclerosis: A meta-analysis of voxel-based morphometry studies and associations with functional disability. Neurosci Biobehav Rev. 2013;37(5):819-830.
doi:10.1016/j.neubiorev.2013.03.006.
63. Calabrese M, Atzori M, Bernardi V, et al. Cortical atrophy is relevant in multiple sclerosis at clinical onset. J Neurol. 2007;254(9):1212-1220. doi:10.1007/s00415-006-0503-6.
64. Narayana PA, Govindarajan KA, Goel P, et al. NeuroImage : Clinical Regional cortical thickness in relapsing remitting multiple sclerosis : A multi-center study. Neuroimage Clin.
2013;2:120-131. doi:10.1016/j.nicl.2012.11.009.
65. Matsushita T, Madireddy L, Sprenger T, et al. Genetic associations with brain cortical thickness in multiple sclerosis. Genes, Brain Behav. 2015;14:217-227.
doi:10.1111/gbb.12190.
66. Steenwijk MD, Daams M, Pouwels PJW, et al. Unraveling the Relationship Between
Regional Gray Matter Atrophy and Pathology in Connected White Matter Tracts in Long-Standing Multiple Sclerosis. Hum Brain Mapp. 2015;36:1796-1807. doi:10.1002/hbm.22738. 67. Eshaghi A, Bodini B, Ridgway GR, et al. Temporal and spatial evolution of grey matter
atrophy in primary progressive multiple sclerosis. Neuroimage. 2014;86:257-264. doi:10.1016/j.neuroimage.2013.09.059.
68. Tziortzi AC, Haber SN, Searle GE, et al. Connectivity-Based Functional Analysis of Dopamine Release in the Striatum Using Diffusion-Weighted MRI and Positron Emission Tomography. Cereb Cortex. 2014;24(5):1165-1177. doi:10.1093/cercor/bhs397.
69. Hasan KM, Halphen C, Kamali A, Nelson FM, Wolinsky JS, Narayana P a. Caudate nuclei
volume, diffusion tensor metrics, and T 2 relaxation in healthy adults and relapsing-remitting multiple sclerosis patients: Implications for understanding gray matter degeneration. J Magn
Reson Imaging. 2009;29(1):70-77. doi:10.1002/jmri.21648.
70. Minagar A, Barnett MH, Benedict RHB, et al. The thalamus and multiple sclerosis: Modern views on pathologic, imaging, and clinical aspects. Neurology. 2013;80(2):210-219.
doi:10.1212/WNL.0b013e31827b910b.
71. Wylezinska M, Cifelli A, Jezzard P, Palace J, Alecci M. Thalamic neurodegeneration in relapsing-remitting multiple sclerosis. Neurology. 2003;60:1949-1954.
72. Tewarie P, Schoonheim MM, Schouten DI, et al. Functional Brain Networks: Linking
Thalamic Atrophy to Clinical Disability in Multiple Sclerosis , A Multimodal fMRI and MEG Study. Hum Brain Mapp. 2015;618(August 2014):603-618. doi:10.1002/hbm.22650.
73. Batista S, Zivadinov R, Hoogs M, Bergsland N, Michael MH, Benedict BWRHB. Basal
ganglia, thalamus and neocortical atrophy predicting slowed cognitive processing in multiple sclerosis. J Neurol. 2012;259:139-146. doi:10.1007/s00415-011-6147-1.
74. Gamboa OL, Tagliazucchi E, Wegner F Von, et al. Working memory performance of early
MS patients correlates inversely with modularity increases in resting state functional connectivity networks. Neuroimage. 2014;94:385-395.
doi:10.1016/j.neuroimage.2013.12.008.
75. Houtchens MK, Killiany R. Thalamic atrophy and cognition in multiple sclerosis. Neurology. 2007;69:1213-1223.
76. Haider L. Oxidant stress in the pathogenesis of multiple sclerosis. Neurosci Behav Physiol. 2015;37(3):209-213.
77. Pagani E, Rocca MA, Gallo A, et al. Regional Brain Atrophy Evolves Differently in Patients with Multiple Sclerosis According to Clinical Phenotype. Am J Neuroradiol.
2005;26(February):341-346.
78. Mesaros S, Rocca M a., Absinta M, et al. Evidence of thalamic gray matter loss in pediatric multiple sclerosis. Neurology. 2008;70(13 PART 2):1107-1112.
doi:10.1212/01.wnl.0000291010.54692.85.
79. Mesaros S, Rovaris M, Pagani E, et al. A magnetic resonance imaging voxel-based morphometry study of regional gray matter atrophy in patients with benign multiple sclerosis. Arch Neurol. 2008;65(9):1223-1230. doi:10.1001/archneur.65.9.1223.
80. Duan Y, Liu Y, Liang P, et al. Comparison of grey matter atrophy between patients with neuromyelitis optica and multiple sclerosis: A voxel-based morphometry study. Eur J Radiol.
2012;81(2):e110-e114. doi:10.1016/j.ejrad.2011.01.065.
81. Audoin B, Davies GR, Thompson AJ, Miller DH, Davies GR, Thompson AJ. Localization of
grey matter atrophy in early RRMS A longitudinal study. J Neurol. 2006;253:1495-1501. doi:10.1007/s00415-006-0264-2.
82. Henry RG, Shieh M, Amirbekian B, Chung S, Okuda DT, Pelletier D. Connecting white
matter injury and thalamic atrophy in clinically isolated syndromes. J Neurol Sci. 2009;282(1-2):61-66. doi:10.1016/j.jns.2009.02.379.
83. Haider L, Simeonidou C, Steinberger G, et al. Multiple sclerosis deep grey matter: the relation between demyelination, neurodegeneration, inflammation and iron. J Neurol
Neurosurg Psychiatry. 2014. doi:10.1136/jnnp-2014-307712.
84. Pardini M et al. Periventricular gradient in thalamic abnormalities in MS: A magnetisation transfer ratio imaging study. In: European Committee for Research & Treatments in MS,
Barcelona, Spain. Vol ; 2015.
85. De Stefano N, Stromillo ML, Giorgio a., et al. Establishing pathological cut-offs of brain atrophy rates in multiple sclerosis. J Neurol Neurosurg Psychiatry. 2015:1-7.
doi:10.1136/jnnp-2014-309903.
86. Filippi M, Preziosa P, Rocca M a. Magnetic resonance outcome measures in multiple sclerosis trials : time to rethink ? Curr Opin Neurol. 2014;27(3):290-299.
doi:10.1097/WCO.0000000000000095.
87. Fisher E, Lee JC, Nakamura K, Rudick R a. Gray matter atrophy in multiple sclerosis: A longitudinal study. Ann Neurol. 2008;64(3):255-265. doi:10.1002/ana.21436.
88. Hardmeier M, Wagenpfeil S, Freitag P, et al. Atrophy is detectable within a 3-month period in untreated patients with active relapsing remitting multiple sclerosis. Arch Neurol.
2003;60(12):1736-1739. doi:10.1001/archneur.60.12.1736.
89. Ge Y, Grossman RI, Udupa JK, et al. Brain atrophy in relapsing-remitting multiple sclerosis and secondary progressive multiple sclerosis: longitudinal quantitative analysis. Radiology. 2000;214(3):665-670. doi:10.1148/radiology.214.3.r00mr30665.
90. Chard DT, Griffin CM, Rashid W, et al. Progressive grey matter atrophy in clinically early relapsing-remitting multiple sclerosis. Mult Scler. 2004;10(4):387-391.
doi:10.1191/1352458504ms1050oa.
91. Nygaard GO, Walhovd KB, Sowa P, et al. Cortical thickness and surface area relate to specific symptoms in early relapsing – remitting multiple sclerosis. Mult Scler J. 2015;21(4):402-414. doi:10.1177/1352458514543811.
92. Battaglini M, Giorgio A, Stromillo ML, et al. Voxel-wise assessment of progression of regional brain atrophy in relapsing-remitting multiple sclerosis. J Neurol Sci. 2009;282(1-2):55-60. doi:10.1016/j.jns.2009.02.322.
93. Selpucre J et al. Regional Gray Matter Atrophy in Early Primary Progressive Multiple Sclerosis. Arch Neurol. 2008;63:1175-1180.
94. Khaleeli Z, Cercignani M, Audoin B, Ciccarelli O, Miller DH, Thompson a. J. Localized grey matter damage in early primary progressive multiple sclerosis contributes to disability.
Neuroimage. 2007;37(1):253-261. doi:10.1016/j.neuroimage.2007.04.056.
95. Kutzelnigg A, Lucchinetti CF, Stadelmann C, et al. Cortical demyelination and diffuse white matter injury in multiple sclerosis. 2005:1-8. doi:10.1093/brain/awh641.
96. Redmond I, Barbosa S, Blumhardt L, Roberts N. Short-term ventricular volume changes on
serial MRI in multiple sclerosis. Acta Neurol Scand. 2000;102(2):99-105.
97. Turner B, Lin X, Calmon G, Roberts N, Blumhardt LD. Cerebral atrophy and disability in relapsing remitting and seco ndary pro gressive multiple sclero sis o ver four years. Mult
Scler. 2003;9:21-28.
98. Fisniku LK, Chard DT, Jackson JS, et al. Gray matter atrophy is related to long-term disability in multiple sclerosis. Ann Neurol. 2008;64(3):247-254. doi:10.1002/ana.21423. 99. Henry RG, Shieh M, Okuda DT, Evangelista A, Pelletier D. Regional grey matter atrophy in
clinically isolated syndromes at presentation. J Neurol Neurosurg Psychiatry. 2008;79(table 1):1236-1244. doi:10.1136/jnnp.2007.134825.
100. Ceccarelli A, Rocca M a., Pagani E, et al. A voxel-based morphometry study of grey matter loss in MS patients with different clinical phenotypes. Neuroimage. 2008;42(1):315-322. doi:10.1016/j.neuroimage.2008.04.173.
101. Raz E, Matter G, Cercignani M, Pozzilli C, Bozzali M, Pantano P. Clinically Isolated
Syndrome Suggestive of Multiple Sclerosis: Voxelwise Regional Investigation of White and Gray. Radiology. 2010;254(1):227-234.
102. Bergsland N, Horakova D, Dwyer MG, et al. Subcortical and cortical gray matter atrophy in a large sample of patients with clinically isolated syndrome and early relapsing-remitting multiple sclerosis. AJNR. 2012;33(8):1573-1578. doi:10.3174/ajnr.A3086.
103. Dalton CM, Chard DT, Davies GR, et al. Early development of multiple sclerosis is
associated with progressive grey matter atrophy in patients presenting with clinically isolated syndromes. Brain. 2004;127(5):1101-1107. doi:10.1093/brain/awh126.
104. Raz, Cercignani M, Sbardella E, Pozzilli C, Bozzali M, Pantano P. Gray- and White-Matter Changes 1 Year after First Clinical Episode. 2010;257(2).
105. Lin X, Blumhardt LD. Inflammation and atrophy in multiple sclerosis : MRI associations with disease course. J Neurol Sci. 2001:99-104.
106. Kalkers NF, Bergers E, Castelijns JA, Polman CH, Barkhof F. Optimizing the association between disability and biological markers in MS. Neurology. 2001;57:1253-1258.
Matter Damage in Different Populations of Multiple Sclerosis Patients. 2015:1-12. doi:10.1371/journal.pone.0135428.
108. Rovaris M, Barkhof F, Calabrese M, et al. MRI features of benign multiple sclerosis.
Neurology. 2009:1693-1701.
109. Calabrese M, Filippi M, Rovaris M, et al. Evidence for relative cortical sparing in benign multiple sclerosis : a longitudinal magnetic resonance imaging study. 2009;(May 2008):36- 41.
110. Calabrese M et al. Low degree of cortical pathology is associated with benign course of multiple sclerosis. Mult Scler J. 2012;19(7):904-911. doi:10.1177/1352458512463767. 111. Rovaris M. Cognitive impairment and structural brain damage in benign multiple sclerosis.
Neurology. 2001;71:1521-1526.
112. Kalkers F, Polman C, Barkhof F. Longitudinal Brain Volume Measurement in Multiple Sclerosis. Arch Neurol. 2002;59:1572-1576. http://scholar.google.com/scholar?
hl=en&btnG=Search&q=intitle:Longitudinal+Brain+Volume+Measurement+in+Multiple+Sc lerosis#0.
113. Korteweg T, Rovaris M, Neacsu V, et al. Can rate of brain atrophy in multiple sclerosis be explained by clinical and MRI characteristics ? Mult Scler. 2009;15(November 2008):465-471.
114. Gauthier SA, Berger AM, Liptak Z, et al. Rate of Brain Atrophy in Benign vs Early Multiple Sclerosis. 2009;66(2):234-238.
115. Stefano N De, Giorgio A. Assessing brain atrophy rates in a large population of untreated multiple sclerosis subtypes. Neurology. 2010;74:1868-1876.
116. Bermel R a, Bakshi R. The measurement and clinical relevance of brain atrophy in multiple sclerosis. Lancet Neurol. 2006;5(2):158-170. doi:10.1016/S1474-4422(06)70349-0.
117. Geurts JJG, Calabrese M, Fisher E, Rudick R a. Measurement and clinical effect of grey matter pathology in multiple sclerosis. Lancet Neurol. 2012;11(12):1082-1092.
doi:10.1016/S1474-4422(12)70230-2.
118. Hohlfeld R, Wekerle H. Autoimmune concepts of multiple sclerosis as a basis for selective immunotherapy : From pipe dreams to ( therapeutic ) pipelines. 2004;101:14599-14606. 119. Lucchinetti CF, Popescu BFG, Bunyan RF, et al. Inflammatory cortical demyelination in
early multiple sclerosis. N Engl J Med. 2011;365(23):2188-2197. doi:10.1056/NEJMoa1100648.
120. Popescu BFG, Bunyan RF, Parisi JE, Ransohoff RM, Lucchinetti CF. A case of multiple sclerosis presenting with inflammatory cortical demyelination. Neurology.
2011;76(20):1705-1710. doi:10.1212/WNL.0b013e31821a44f1.
Inflammation in Multiple Sclerosis. 2010:477-493. doi:10.1002/ana.22230.
122. Paling D, Golay X, Miller D. Energy failure in multiple sclerosis and its investigation using MR techniques. J Neurol. 2011;258:2113-2127. doi:10.1007/s00415-011-6117-7.
123. Lassmann H, Horssen J Van. Oxidative stress and its impact on neurons and glia in multiple sclerosis lesions . ☆ BBA - Mol Basis Dis. 2016;1862(3):506-510.
doi:10.1016/j.bbadis.2015.09.018.
124. Witte ME, Mahad DJ, Lassmann H, van Horssen J. Mitochondrial dysfunction contributes to neurodegeneration in multiple sclerosis. Trends Mol Med. 2014;20(3):179-187.
doi:10.1016/j.molmed.2013.11.007.
125. Popescu V, Klaver R, Voorn P, et al. What drives MRI-measured cortical atrophy in multiple sclerosis? Mult Scler J. 2015:1-11. doi:10.1177/1352458514562440.
126. Geurts JJG, Bo L, Pouwels PJW, Castelijns JA, Polman CH, Barkhof F. Cortical Lesions in Multiple Sclerosis : Combined Postmortem MR Imaging and Histopathology. 2005;
(March):572-577.
127. Seewann A, Roosendaal SD, Wattjes MP, Valk P Van Der, Barkhof F, Polman CH. Postmortem verification of MS cortical lesion detection with 3D DIR. Neurology. 2012;78(09):302-308.
128. Wegner C, Esiri MM, Chance S a, Palace J. Neocortical neuronal, synaptic, and glial loss in Multiple Sclerosis. Neurology. 2006;67:960-967. doi:10.1212/01.wnl.0000237551.26858.39. 129. Pavert SHP Van De, Muhlert N, Sethi V, et al. DIR-visible grey matter lesions and atrophy in
multiple sclerosis : partners in crime ? J Neurol Neurosurg Psychiatry. 2015:1-7. doi:10.1136/jnnp-2014-310142.
130. Spence RD, Kurth F, Itoh N, et al. NeuroImage Bringing CLARITY to gray matter atrophy.
Neuroimage. 2014;101:625-632. doi:10.1016/j.neuroimage.2014.07.017.
131. Barkhof F. MRI in multiple sclerosis: correlation with expanded disability status scale (EDSS). Mult Scler. 1999;5(4):283-286. doi:10.1191/135245899678846221.
132. Hackmack K, Weygandt M, Wuerfel J, Pfueller CF, Friedemann JB, Haynes PJ. Can we overcome the “ clinico-radiological paradox ” in multiple sclerosis ? J Neurol.
2012;259:2151-2160. doi:10.1007/s00415-012-6475-9.
133. Mistry N, Tallantyre EC, Dixon JE, et al. Focal multiple sclerosis lesions abound in “ normal appearing white matter .” Mult Scler J. 2011;17(11):1313-1323.
doi:10.1177/1352458511415305.
134. Horakova D, Dwyer MG, Havrdova E, et al. Gray matter atrophy and disability progression in patients with early relapsing-remitting multiple sclerosis. A 5-year longitudinal study. J
Neurol Sci. 2009;282(1-2):112-119. doi:10.1016/j.jns.2008.12.005.
patients: relation to MRI parameters and disability. Mult Scler. 2011;17(9):1098-1106. doi:10.1177/1352458511404916.
136. Kurtzke JF. Rating neurologic impairment in multiple sclerosis : An expanded disability status scale ( EDSS ). Neurology. 1983;33(November):1444-1453.
137. Fischer JS, Rudick RA, Cutter GR, Reingold SC, Ms N, Clinical S. The Multiple Sclerosis Functional Composite measure ( MSFC ): an integrated approach to MS clinical outcome assessment. Mult Scler. 1999;5:244-250.
138. Twork S, Wiesmeth S, Spindler M, et al. Disability status and quality of life in multiple sclerosis : non-linearity of the Expanded Disability Status Scale ( EDSS ). Health Qual Life Outcomes. 2010;8(55):8-13.
139. Fisher E, Rudick RA, Simon JH, et al. Eight-year follow-up study of brain atrophy in patients with MS. Neurology. 2002;59:1412-1420.
140. Sailer M, Fischl B, Salat D, et al. Focal thinning of the cerebral cortex in multiple sclerosis.
Brain. 2003;126(8):1734-1744. doi:10.1093/brain/awg175.
141. Tedeschi G, Lavorgna L, Russo P, et al. Brain atrophy and lesion load in a large population of patients with. Neurology. 2005;65:280-285.
142. Sanfilipo MP, Benedict RHB, Sharma J, Weinstock-guttman B, Bakshi R. The relationship between whole brain volume and disability in multiple sclerosis: A comparison of normalized gray vs . white matter with misclassification correction. Neuroimage. 2005;26:1068-1077. doi:10.1016/j.neuroimage.2005.03.008.
143. Charil A, Dagher A, Lerch JP, Zijdenbos AP, Worsley KJ, Evans AC. Focal cortical atrophy in multiple sclerosis: Relation to lesion load and disability. Neuroimage. 2007;34(2):509-517. doi:10.1016/j.neuroimage.2006.10.006.
144. Prinster A, Quarantelli M, Lanzillo R, et al. A voxel-based morphometry study of disease severity correlates in relapsing-- remitting multiple sclerosis. Mult Scler. 2010;16(1):45-54. doi:10.1177/1352458509351896.
145. Rocca MA, Amato MP, Stefano N De, et al. Clinical and imaging assessment of cognitive dysfunction in multiple sclerosis. Lancet Neurol. 2015;14(3):302-317. doi:10.1016/S1474-4422(14)70250-9.
146. Calabrese M. Cortical Lesions and Atrophy Associated With Cognitive Impairment in Relapsing-Remitting Multiple Sclerosis. Arch Neurol. 2009;66(9):1144-1150.
147. Nygaard GO, Celius EG, Benavent SADR, Sowa P. A Longitudinal Study of Disability , Cognition and Gray Matter Atrophy in Early Multiple Sclerosis Patients According to Evidence of Disease Activity. PLoS One. 2015:1-15. doi:10.1371/journal.pone.0135974. 148. Muhlert N, Sethi V, Schneider T, et al. Diffusion MRI-Based Cortical Complexity Alterations
doi:10.1002/jmri.23970.
149. Muhlert N, Sethi V, Cipolotti L, et al. The grey matter correlates of impaired decision-making in multiple sclerosis. J Neurol Neurosurg Psychiatry. 2015;86:530-536. doi:10.1136/jnnp-2014-308169.
150. Muhlert N, Atzori M, Vita E De, et al. Memory in multiple sclerosis is linked to glutamate concentration in grey matter regions. J Neurol Neurosurg Psychiatry. 2014.
doi:10.1136/jnnp-2013-306662.
151. Losseff NA, Wang L, Lai HM, et al. Progressive cerebral atrophy in multiple sclerosis A serial MRI study. Brain. 1996;119:2009-2019.
152. Minneboo A, Jasperse B, Barkhof F, et al. Predicting short-term disability progression in early multiple sclerosis: added value of MRI parameters. J Neurol Neurosurg Psychiatry. 2008;79:917-924. doi:10.1136/jnnp.2007.124123.
153. Rudick R a, Cutter G, Baier M, et al. Use of the Multiple Sclerosis Functional Composite to predict disability in relapsing MS. Neurology. 2001;56(10):1324-1330.
doi:10.1212/WNL.56.10.1324.
154. Chen JT, Narayanan S, Collins DL, Smith SM, Matthews PM, Arnold DL. Relating
neocortical pathology to disability progression in multiple sclerosis using MRI. Neuroimage. 2004;23(3):1168-1175. doi:10.1016/j.neuroimage.2004.07.046.
155. Rudick R a., Lee JC, Nakamura K, Fisher E. Gray matter atrophy correlates with MS
disability progression measured with MSFC but not EDSS. J Neurol Sci. 2009;282(1-2):106-111. doi:10.1016/j.jns.2008.11.018.
156. Filippi M, Preziosa P, Copetti M, Riccitelli G, Horsfield MA, Martinelli V. Gray matter damage predicts the accumulation of disability 13 years later in MS. Neurology.
2013;81:1759-1767.
157. Popescu V, Agosta F, Hulst HE, et al. Brain atrophy and lesion load predict long term disability in multiple sclerosis. J Neurol Neurosurg Psychiatry. 2013;84(10):1082-1091. doi:10.1136/jnnp-2012-304094.
158. Filippi M, Rocca MA, Pagani E, et al. Placebo-controlled trial of oral laquinimod in multiple sclerosis: MRI evidence of an effect on brain tissue damage. J Neurol Neurosurg Psychiatry. 2013. doi:10.1136/jnnp-2013-306132.
159. Kappos L, Radue E, O’Connor P, et al. A Placebo-Controlled Trial of Oral Fingolimod in Relapsing Multiple Sclerosis. N Engl J Med. 2011;362(5):387-401.
160. Radue E, O’Connor P, Polman C, Hohlfeld R, Calabresi P, Selmaj K et al. Impact of Fingolimod Therapy on Magnetic Resonance Imaging Outcomes in Patients With Multiple Sclerosis. Arch Neurol. 2012;69(10):1259-1269. doi:10.1001/archneurol.2012.1051.
atrophy in relapsing-remitting multiple sclerosis predominantly by reducing gray matter atrophy. Mult Scler. 2007;13(October 2005):490-501.
162. Calabrese M, Bernardi V, Atzori M, et al. Effect of disease-modifying drugs on cortical lesions and atrophy in relapsing – remitting multiple sclerosis. Mult Scler J. 2012;18(4):418-424. doi:10.1177/1352458510394702.
163. Rudick RA, Fisher E, Lee J, Simon J, Jacobs L. Use of the brain parenchymal fraction to measure whole brain atrophy in relapsing-remitting MS. Neurology. 1999;53:1698-1704. 164. Rinaldi F, Perini P, Atzori M, Favaretto A, Seppi D, Gallo P. Disease-Modifying Drugs
Reduce Cortical Lesion Accumulation and Atrophy Progression in Relapsing-Remitting Multiple Sclerosis : Results from a 48-Month Extension Study. Mult Scler Int. 2015:1-6.
165. Stefano N De, Pia M, Stubinski B, et al. Efficacy and safety of subcutaneous interferon beta-1a in relapsing – remitting multiple sclerosis: Further outcomes from the IMPROVE study. J
Neurol Sci. 2012;312(1-2):97-101. doi:10.1016/j.jns.2011.08.013.
166. Rovaris M, Comi G, Rocca MA, Wolinsky JS, Filippi M. Short-term brain volume change in relapsing – remitting multiple sclerosis Effect of glatiramer acetate and implications. Brain. 2001;124:1803-1812.
167. Bendfeldt K, Egger H, Nichols TE, et al. Effect of immunomodulatory medication on regional gray matter loss in relapsing – remitting multiple sclerosis — A longitudinal MRI study. Brain Res. 2010;1325:174-182. doi:10.1016/j.brainres.2010.02.035.
168. Sormani MP, Arnold DL, Stefano N De. Treatment Effect on Brain Atrophy Correlates with Treatment Effect on Disability in Multiple Sclerosis. Ann Neurol. 2014;75:43-49.
doi:10.1002/ana.24018.
169. Zivadinov R, Stu O. Mechanisms of action of disease-modifying agents and brain volume changes in multiple sclerosis. Neurology. 2008:136-144.
170. Stefano N De, Arnold DL. Towards a better understanding of pseudoatrophy in the brain of multiple sclerosis patients. Mult Scler J. 2015;21(6):675-676.
doi:10.1177/1352458514564494.
171. Vidal-jordana A, Sastre-garriga J, Pérez- F, et al. Early brain pseudoatrophy while on natalizumab therapy is due to white matter volume changes. Mult Scler J. 2013. doi:10.1177/1352458512473190.
172. Calabrese M, Magliozzi R, Ciccarelli O et al. Exploring the origins of grey matter damage in multiple sclerosis. Nat Rev Neurosci. 2015;16(3):147-158. doi:10.1038/nrn3900.
173. Bodini B, Altmann DR, Tozer D, Miller DH, Wheeler- C. White and gray matter damage in primary progressive MS The chicken or the egg ? Neurology. 2016;86:170-176.
174. Barkhof F, Calabresi P, Miller D, Reingold S. Imaging outcomes for neuroprotection and repair in multiple sclerosis trials. Nat Rev Neurol. 2009;5:256-266.
175. Wattjes M, Rovira À, Miller D, et al. MAGNIMS consensus guidelines on the use of MRI in multiple sclerosis — establishing disease prognosis and monitoring patients. Nat Publ Gr.