Graphical Analysis of Links in a Transport Network
via Multidimensional Scaling
Paolo Chirico DIGSPES Alessandria University of Eastern Piedmont, Italty
Abstract The present paper proposes the use of Multidimensional Scaling (MDS) to point out graph-ically critical links in a transport network. The method is applied to a Italian regional case: the Pied-mont rail network. The non-integration of the western areas with the eastern areas is shown and it is so evident that it seems there are two different rail network.
1 Introduction
The aim of this paper is to propose the use of Multidimensional Scaling (MDS) to point out graphi-cally critical links in a transport network. In particular we have analyzed a Italian regional case: the rail network of Piedmont. This is probably the oldest in Italy, but from several years there haven’t been significative investments on the secondary links. The result is a strong difference between prin-cipal links (Torino-Vercelli-Novara and Torino-Asti-Alessandria) and other links, that are slow and unsatisfactory integrated in the regional network. This state can be shown either numerically by table of traveling times or graphically by suitable MDS representations.
1.1 Multidimensional Scaling
Multidimensional scaling (MDS) is a set of data analysis techniques that display the structure of distance-like data as a geometrical picture. Torgerson proposed the first MDS method and coined the term (see [4]). MDS pictures the structure of a set of objects from data that represent the simil-itarities/dissimilarities (distances or proximities) between pairs of the objects. Each object or event is represented by a point in a multidimensional space. The points are arranged in this space so that the distances between pairs of points have the strongest possible relation to the similarities among the pairs of objects. The space is usually a two- or three-dimensional Euclidean space, but may be non-Euclidean and may have more dimensions.
There are two different type of MDS: metric MDS if the similarities are distances (in mathemati-cal sense); nonmetric MDS if the similarities are either quantitative, but not distances or qualitative at ordinal level. Metric MDS is easy to be solved (by means of Principal Components), but very
Post print copy
2
rare (similarities are usually not distances). Nonmetric MDS is more common and can be solved by means of iterative algorithms (see [2]). The base model formulation is:
m(si, j) = di, j+ ei, j (1)
where m(si, j) is a monotonic transformation of the ordered similarity si, jbetween the ithand the jth object; di, jis the correspondent distance in the X1,X2, ...space and ei, jthe approximation error.
One of the most common algorithm for nonmetric MDS is ALSCAL (see [3]) that we have used for our study (see sec. 2. ALSCAL is a ALSOS (Alternating Least Squares with Optimal Scaling) method and consist of a iterative procedure that alternate the estimation of the monotonic transfor-mation m() and the estimation of the coordinates (xi,1,xi,2, ...). The coordinates are estimated one at a time, then it need to fix the number of dimension.
Both in metric MDS and in nonmetric MDS, the goodness of the final solution is measured by:
S − Stress = v u u t ∑[m(si, j)2− d2i, j]2 ∑di, j4 (2)
A very common evaluation criteria is: excellent if S-Stress < 0.05; good if < 0.1; medium if <0.2; bad if > 0.2.
2 The rail network in Piedmont
We have considered the rail traveling times among the eight provincial chief-towns of Piedmont (Torino TO, Alessandria AL, Asti AT, Biella BI, Cuneo CN, Novara NO, Vercelli VC, Verbania VB) as dissimilarities. On these dissimilarities we have run an ALSCAL algorithm to get a bi-dimensional representation, obtaining a good S-Stress (0,0856). We have repeated the operation with the rail traveling kilometers. Then we have compared the traveling times picture (T T picture) with the traveling kilometers picture (T K picture) by adding the two representations. If all links are direct (don’t need to change train) and have the same traveling speed, the two pictures coincide. But they aren’t, because some links are direct and very speedy and others not. Then it needs an adding criterion. So we have centered both pictures in Torino and we have rotated them in order to minimize a weighted sum of Euclidean distances between the correspondent towns (the weights reflect the link importance).
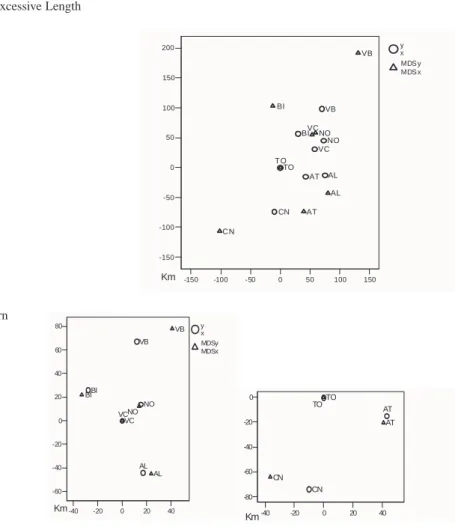
If a distance is bigger in the T T picture than in T K picture, it means that the traveling speed of the correspondent link is slower than the average. It takes more time and the links seems longer than actually, because the T T picture reflects the traveling times. It is the case of the links connecting Verbania, Cuneo, Biella and Asti (Fig.1). In particular Verbania seems 100 km farther. This situation is obviously due to slower trains, but also to long waiting times when you have to change trains (indirect links). In other words there is a problem of low integration of secondary lines with principal lines. Moreover we can suppose there are two separate rail networks in the same region. This idea is supported by the results of two separate analyzes on western and eastern links (Fig.2). We can note that the differences between T T and T K pictures are smaller in both representations. That means the links among eastern towns and links among western towns are more homogeneous and better integrated. Only Verbania in the East and Cuneo in the West show strong differences, but that is due to their particular geographical positions.
Title Suppressed Due to Excessive Length 3
Fig. 1 Geographical and
MDS representation -150 -100 -50 0 50 100 150 -150 -100 -50 0 50 100 150 200 AL AT BI CN NO T O VB VC AL AT BI CN NO TO VB VC y x MDS y MDS x Km
Fig. 2 Eastern and western
representations -40 -20 0 20 40 -60 -40 -20 0 20 40 60 80 AL BI NO VB VC AL BI NO VB VC y x MDSy MDSx Km -40 -20 0 20 40 -80 -60 -40 -20 0 AT CN TO AT CN TO Km
3 Conclusions
The simultaneous representation of MDS pictures reflecting traveling times and traveling kilometers of a transport network can be useful to analyze it (see also [1]). By means of this double repre-sentation we can note which links are slower than average (they are longer in the traveling time representation) and which are faster (shorter in the traveling time representation). This method can point out also if a transport network is homogeneous or not, in other words, if there are some points well connected and others not (points not well connected present a visible gap between the two MDS pictures).
The analysis of the Piedmont rail network has shown that some provincial chief-towns are not well connected (it takes too time to get them). In general the links among the western areas and those among the eastern ones are low integrated so that seem quite two different transport systems.
In these days there is a great attention about the realization of a high-speed rail link between Lyon and Turin. It will involve high production and environmental costs, but it would improve a lots the European transport system as well as it would integrate the France rail system with the Italian one. A further evaluation tool could be given by the proposed MDS use.
4
References
1. Chirico, P., Lo Presti, A.: Analysis of peripheral industrial areas via multidimensional scaling: the EU case, Proceedings of Meeting of Classification and Data Analysis Group of the Italian Statistical Society, Parma June (2005)
2. Kruskal, J.B.: Nonmetric multidimensional scaling: a numerical Method, Psychometrika 29, 115-129, (1964) 3. Takane, Y., Young, F.W., de Leew J.: Nonmetric individual differences multidimensional scaling: An alternating
least squares method, Psychometrika, 42, 7-67, (1977)