Ficus carica L., the common fig (2n = 2x = 26), an ancient species from the eastern portion of Mediter-ranean basin, including Turkey and Iran [Ikegami et al. 2009], belongs to Ficus, a genus including 600 to 1,900 species [Datwyler and Weiblen 2004, Flaishman et al. 2008].
Large number of the existing fig varieties may be the result of selection focused on agronomic charac-teristics and/or selection and transportation to distant
regions by growers and breeders [Condit 1955]. The identification of commonly used varieties depends on phenotypic traits, which is not completely correct as same varieties may have different names depending on the location (synonyms) or different varieties may have the same name (homonyms). Fig varieties grow wild throughout the Mediterranean basin, but only three types (parthenocarpic and/or non-parthenocar-pic) are grown commercially: 1) the Common-type,
ANALYSIS OF GENETIC DIVERSITY OF Ficus carica L. (Moraceae)
COLLECTION USING SIMPLE SEQUENCE REPEAT (SSR) MARKERS
Ilaria Marcotuli
1, Andrea Mazzeo
2, Domenica Nigro
2, Stefania Lucia Giove
1,
Angelica Giancaspro
1, Pasqualina Colasuonno
1, Željko Prgomet
3, Iva Prgomet
4,
Annalisa Tarantino
5, Giuseppe Ferrara
2, Agata Gadaleta
11 Department of Environmental and Territorial Sciences, University of Bari “Aldo Moro”, via G. Amendola 165/A, 70126 – Bari, Italy 2 Department of Soil, Plant and Food Sciences, University of Bari “Aldo Moro”, via G. Amendola 165/A, 70126 – Bari, Italy 3 Collegium Fluminense Polytechnic of Rijeka, Trpimirova 2/V, 51000 – Rijeka, Croatia
4 Skink, Valalta bb, 52210 – Rovinj, Croatia
5 Department of Science Agriculture, Food and Environment, University of Foggia, via Napoli 25, 71122 – Foggia, Italy
ABSTRACT
Modern technologies and accurate information on genetic diversity and structure are contributing to improve the plant breeding, in particular for all the minor species with a lack of data. Genetic diversity of 139 differ-ent Ficus carica L. genotypes collected from Italy and Croatia, and divided into two subgroups: uniferous (only main crop) and biferous (breba and main crop), was investigated using 49 microsatellite markers. A total of 70 alleles were generated, of which 64 (91.4%) showed a polymorphic pattern indicating high level of genetic diversity within the studied collection. The mean heterozygosity over the 64 single locus micro-satellites was 0.33 and the expected and observed averaged variance were 16.50 and 184.08, respectively. The 139 fig genotypes formed two clusters in the PCoA analysis, suggesting a division between Italian and Croatian genotypes. Moreover, the fig accessions could be divided into two main clusters based on the STRUCTURE analysis according to the biological type, uniferous or biferous, with partly overlapping varieties. In conclusion, our results demonstrated that molecular markers were able to discriminate among genotypes and useful for the authentication of fig tree varieties (homonymies and synonymies).
Key words: fig, breba, SSRs, genetic diversity, population structure
with parthenocarpic fruits, either breba (first crop) or main crop (second crop); 2) the Smyrna-type, with non-parthenocarpic fruits (main crop); and 3) the San Pedro-type, with parthenocarpic fruits (breba) and non-parthenocarpic (main crop) [Storey 1976, Ferrara et al. 2016]. However, this division into three groups could be questionable if we rely only on the pollina-tion requirement (caprificapollina-tion or not), thus dividing varieties only into two groups [Ferrara et al. 2016].
The world fresh fig production was estimated to be 1,050,459 tons per year [FAO 2016], of which its pro-duction in Turkey was estimated to be 305,450 tons (29% of the world fig production) [FAO 2016].
Italy ranks 16th in world fig cultivation with 11,297
tons per year (1.1% of the worldwide production) and Croatia 38th (1,165 tons) amongst the fig producing
countries [FAO 2016].
Traditionally, plant germplasm characterization has been carried out using morphological and agro-nomical traits with fluctuation among years, environ-ments and repetitions [Giraldo et al. 2010] and con-sequently difficulties have arisen in identifying the varieties. Because plant phenotype is unstable due to genotype-environment interactions, a genetic analysis is crucial for the assessment and accurate characteriza-tion of fig genetic resources.
Despite the progresses that have been made with the next generation sequencing technologies, in re-cent years, molecular markers, and in particular mi-crosatellites (SSR), continue to be developed and used [Achtak et al. 2009, Perez-Jiménez et al. 2012].
The present work aimed to describe and charac-terize a collection of 139 different fig (F. carica L.) genotypes through microsatellite marker analysis to better understand their core biological behavior and their genetic relationships in order to create a molecu-lar markers database for fig breeding.
As part of an ongoing germplasm characterization effort, the presented fig collection, including both Ital-ian and CroatItal-ian genotypes, was analyzed with SSR markers. Since these two countries are on two faces of the Adriatic Sea, an exchange of plant material has been carried on since ancient times (exchange of fig varieties in the Roman Empire and even earlier) and cases of synonyms and homonyms are found to be present and widespread within these regions [Prgomet and Bohac 2003]. This study attempts to assess
genet-ic diversity and differentiation within the collection following both the geographical origin/site of cultiva-tion and the number of crops per year.
MATERIAL AND METHODS Plant material
Genetic analysis was carried out on a set of 139 different F. carica L. genotypes originating from Italy and Croatia (Tab. 1). Italian genotypes were collected from small private orchards in the Puglia region, in commercial farms or at the fig repository located at the ‘P. Martucci’ experimental station in Valenzano (Uni-versity of Bari ‘Aldo Moro’, DiSSPA, Fruit Tree Unit, Italy). The Croatian accessions were kindly provided by Skink Ltd from Rovinj (Istria county) from their fig collection orchard populated with figs from different parts of Croatia, Slovenian Istria and part of Bosnia and Herzegovina, as well as from Italy (Tuscany re-gion). Fig varieties that were purchased in Tuscany can be found in Croatian orchards, as it is not rare for Croatian fig growers to buy plant material in Italy. Molecular characterization
Total genomic DNA was isolated from fresh leaves of 139 different fig genotypes using the DNeasy Plant Mini Kit (Qiagen) according to manufacturer’s in-struction, except for the addition of 1% of Poly-vi-nylpyrrolidone (PVP 40,000) to the buffer AP1. Ge-nomic DNA concentration was measured using the Nanodrop spectrophotometer (Thermo Scientific, Wilmington, DE, USA) and standardized to 50 ng/μl prior to amplification.
PCR reactions were performed using BIOTAQTM
(Bioline) in a 20 μl volume containing: 150 ng of DNA, 2 μl of 10× NH4 reaction buffer, 0.85 μl of 50 mM MgCl2 solution, 0.2 μl of 200 μM dNTP mix, 0.6 μl of Fam- or Hex-labeled M13 tail, 0.15 μl of 1 μM of M13 tailed forward primer, 0.6 μl of 1 μM of reverse primer and 0.07 μl of Taq DNA polymerase.
PCR was carried out on a BioRad thermal cycler as follow: 5 min at 95°C, and 20 touchdown cycles of 30 s at 95°C, 45 s at 60°C (−0.5°C each cycle) and 40 s at 72°C, followed by 25 cycles of 30 s at 95°C, 30 s at 50°C and 40 s at 72°C, with a final hold of 7 min at 72°C. Aliquot of 1.6 μl of PCR product was mixed with 14 μl of formamide and 0.4 μl of Rox-500
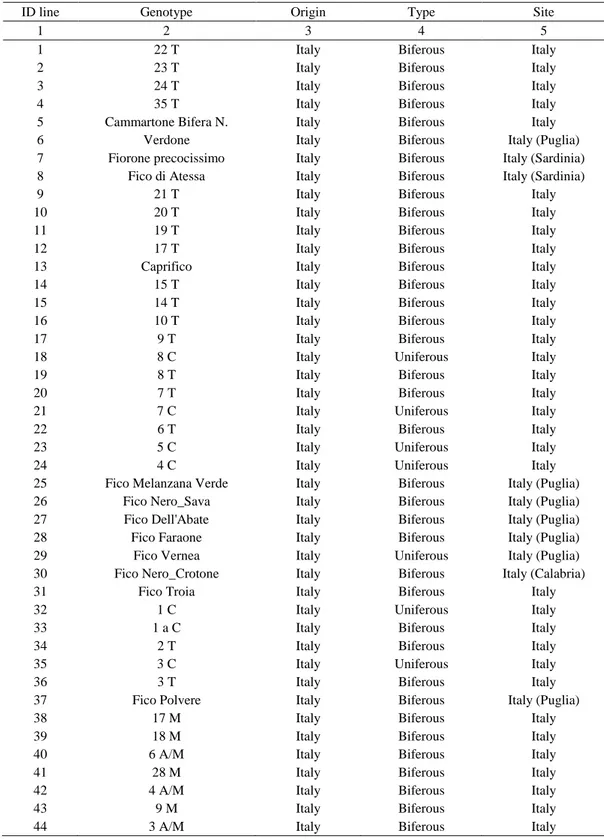
Table 1. List of the 139 analyzed Ficus carica L. genotypes, their name, geographical origin, biological type and the site
(country/region) of cultivation/collection
ID line Genotype Origin Type Site
1 2 3 4 5
1 Italy Biferous Italy
2 Italy Biferous Italy
3 Italy Biferous Italy
4 Italy Biferous Italy
5 Italy Biferous Italy
6 Italy Biferous Italy (Puglia)
7 Italy Biferous Italy (Sardinia)
8 Italy Biferous Italy (Sardinia)
9 Italy Biferous Italy
10 Italy Biferous Italy
11 Italy Biferous Italy
12 Italy Biferous Italy
13 Italy Biferous Italy
14 Italy Biferous Italy
15 Italy Biferous Italy
16 Italy Biferous Italy
17 Italy Biferous Italy
18 Italy Uniferous Italy
19 Italy Biferous Italy
20 Italy Biferous Italy
21 Italy Uniferous Italy
22 Italy Biferous Italy
23 Italy Uniferous Italy
24 Italy Uniferous Italy
25 Italy Biferous Italy (Puglia)
26 Italy Biferous Italy (Puglia)
27 Italy Biferous Italy (Puglia)
28 Italy Biferous Italy (Puglia)
29 Italy Uniferous Italy (Puglia)
30 Italy Biferous Italy (Calabria)
31 Italy Biferous Italy
32 Italy Uniferous Italy
33 Italy Biferous Italy
34 Italy Biferous Italy
35 Italy Uniferous Italy
36 Italy Biferous Italy
37 Italy Biferous Italy (Puglia)
38 Italy Biferous Italy
39 Italy Biferous Italy
40 Italy Biferous Italy
41 Italy Biferous Italy
42 Italy Biferous Italy
43 Italy Biferous Italy
44 22 T 23 T 24 T 35 T Cammartone Bifera N. Verdone Fiorone precocissimo Fico di Atessa 21 T 20 T 19 T 17 T Caprifico 15 T 14 T 10 T 9 T 8 C 8 T 7 T 7 C 6 T 5 C 4 C
Fico Melanzana Verde Fico Nero_Sava Fico Dell'Abate Fico Faraone Fico Vernea Fico Nero_Crotone Fico Troia 1 C 1 a C 2 T 3 C 3 T Fico Polvere 17 M 18 M 6 A/M 28 M 4 A/M 9 M
Table 1 cont.
1 2 3 4 5
45 Italy Biferous Italy
46 Italy Biferous Italy
47 Italy Biferous Italy
48 Italy Biferous Italy
49 Italy Biferous Italy
50 Italy Biferous Italy
51 Italy Biferous Italy
52 Italy Biferous Italy
53 Italy Biferous Italy
54 Italy Biferous Italy (Puglia)
55 Italy Biferous Italy (Puglia)
56 Italy Biferous Italy (Puglia)
57 Italy Biferous Italy (Puglia)
58 Italy Biferous Italy (Puglia)
59 Italy Biferous Italy (Puglia)
60 Italy Biferous Italy
61 Italy Biferous Italy
62 Italy Biferous Italy
63 Italy Biferous Italy
64 Italy Biferous Italy (Puglia)
65 Italy Biferous Italy (Puglia)
66 Italy Biferous Italy (Puglia)
67 Italy Biferous Italy (Puglia)
68 Italy Biferous Italy (Puglia)
69 Italy Biferous Italy (Puglia)
70 Italy Biferous Italy (Puglia)
71 Italy Biferous Italy (Calabria)
72 Italy Biferous Italy
73 Italy Biferous Italy
74 Italy Biferous Italy
75 Italy Biferous Italy
76 Italy Biferous Italy
77 Italy Biferous Italy
78 Italy Biferous Italy
79 Italy Biferous Italy (Calabria)
80 Italy Biferous Italy
81 Italy Biferous Italy
82 Italy Biferous Italy
83 Italy Uniferous Italy
84 Italy Biferous Italy (Calabria)
85 Italy Biferous Italy
86 Italy Biferous Italy
87 Italy Biferous Italy
88 Italy Biferous Italy
89 Italy Biferous Italy
90 Italy Biferous Italy
91 Italy Biferous Italy
92 Italy Biferous Italy
93 37 M 15 M 1 A/M 43 M 5 M 23 M 42 M 4 M 10 A/M Fico Fracazzano Oria
Petrelli Bianco Oria Fiorone di S.Giovanni
Fiorone B Oria Stafiero AZ Facoltà Caprifico Cep 2 Bari
22 M 41 M 24 M 20 M Fico verdone Sava Fiorone della Regina
Fiorone bianco Fico A Bianco Oria Fiorone Testa di Gatto
Fico 3 volte Gioia Caprifico Cep 1 Bari Troiano Nero Crotone
33 M 44 M 19 M 35 M 34 M 45 M 13 M Vera Bianca Crotone
7 M 1 M 26 M Nerello Marchese Fico Nataline Crotone
D G F 6 M 2 M 29 M M 21 M
Table 1 cont. 1 2 3 4 5 94 Italy Biferous 95 Italy Biferous 96 Italy Biferous 97 Italy Biferous 98 Italy Biferous 99 Croatia Uniferous 100 Croatia Uniferous 101 Slovenia Uniferous 102 Croatia Uniferous 103 Croatia Uniferous 104 Croatia Biferous 105 Italy Biferous 106 Croatia Uniferous 107 Croatia Biferous 108 Italy Biferous 109 Croatia Uniferous 110 Croatia/Bosnia Biferous 111 Croatia Uniferous 112 Italy Biferous 113 Italy Uniferous 114 Italy Biferous 115 Croatia Biferous 116 Italy Biferous 117 Croatia Uniferous 118 Italy Uniferous 119 Italy Biferous 120 Italy Biferous 121 Italy Biferous 122 Italy Biferous 123 Italy Biferous 124 Italy Uniferous 125 Italy Uniferous 126 Italy Uniferous 127 Italy Uniferous 128 Italy Uniferous 129 Italy Biferous 130 Croatia Uniferous 131 Italy Biferous 132 Italy Uniferous 133 Italy Uniferous 134 Italy Biferous 135 Italy Uniferous 136 Italy Uniferous 137 Italy Biferous 138 Croatia Uniferous 139 Columbro B Crotone 7 M 10 M 27 M 40 M Bružetka bijela Bružetka crna Miljska figa Zamorčica Zimica Petrovača bijela Poli pistoia Šaraguja Bjelica Bottaccio Rezavica Fico della Madonna
Crnica Rosso di Trani Verdino Columbro bianco_B Divlja (Wild) Fiorone Split Cavalierino S.Martino Faraone Sardo bianco Piombionese Melanzana Bianca Corvo siculo New Bianco Nic.
Montalcino rosa Bianco di Carmingano Bamborino Raffaone Francuska crna Caietti nero Bianchetto Dattero Ficazzano Columbro bianco_U Troiano Zuchetto Momjan
Brogiotto Bi. Bocci Italy Uniferous
Italy Italy (Calabria) Italy Italy Italy Croatia Croatia (Medulin) Croatia (Medulin) Croatia (Seca) Croatia/Bosnia Croatia (Medulin) Croatia Croatia Croatia (Medulin) Croatia (Plavje) - Croatia (Medulin) Croatia (Medulin) Croatia (Medulin) Croatia Croatia Croatia Croatia Croatia Croatia Croatia Croatia Croatia Croatia Croatia Croatia Croatia Croatia Croatia Croatia Croatia Croatia Croatia Croatia Croatia Croatia Croatia Croatia Croatia Italy Croatia
(Applied Biosystems), the internal molecular weight standard, and denatured at 95°C for 5 min. PCR prod-ucts were then visualized by capillary electrophoresis on 3500 Genetic Analyzer (Applied Biosystems) and analyzed by Gene Mapper v.5.0 genotyping software. Microsatellite analysis and genetic relationship
A number of 49 microsatellite primer pairs taken from the literature and available on NCBI [www.ncbi. nlm.nih.gov] was tested to estimate genetic similarity and distances among the 139 fig genotypes. The
selec-tion of the fig SSRs was based on their high polymor-phism information content.
Genetic data were converted into a pairwise by individual genetic distance matrix using the haploid SSR markers distance matrix. Once a genetic distance matrix was calculated, a principal coordinate analy-sis (PCoA) was carried out using GenALEx software (v. 6.5) [Peakall et al. 2006, 2012] and phylogenetic tree was performed by NTSYS pc v. 2.1 software based upon the UPGMA (Unweighted Pair Group Method with Arithmetical averages) method. The Bayesian
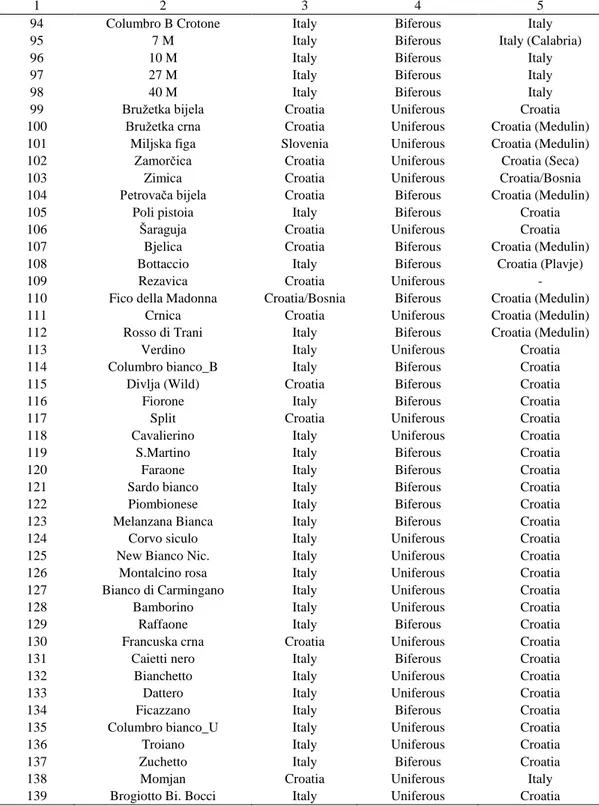
Table 2. Allelic frequencies reported for all the alleles of each microsatellite tested in this study
Locus Allele Allelic frequency Locus Allele Allelic frequency
1 2 3 1 2 3 MFC1 190 0.635 LMFC30 249 0.071 203 0.530 258 0.342 208 0.525 270 0.265 MFC3 138 0.326 277 0.071 151 0.532 LMFC31 244 0.296 140 0.408 258 0.403 143 0.319 LMFC36 241 0.469 MFC4 213 0.446 243 0.097 233 0.408 LMFC37 222 0.378 237 0.424 227 0.270 LMFC17 203 0.218 LMFC38 231 0.316 207 0.845 237 0.393 214 0.077 220 0.841 LMFC18 131 0.763 233 0.536 138 0.481 Frub391 175 0.500 LMFC19 312 0.338 179 0.191 316 0.868 182 0.562 320 0.221 196 0.041 LMFC21 280 0.750 Frub422 185 0.224 284 0.229 195 0.102 LMFC22 297 0.474 208 0.240 299 0.755 221 0.077 LMFC25 228 0.204 Frub436 167 0.554 232 0.092 172 0.154 236 0.199 FCUP027-4 202 0.300 LMFC26 241 0.087 206 0.333 251 0.423 218 0.357 LMFC27 202 0.332 FCUP038-6 170 0.165 213 0.347 175 0.456 LMFC28 209 0.071 188 0.210 214 0.255 192 0.278 216 0.332 220 0.071
clustering program STRUCTURE (version 2.3.4) was used selecting an admixture model with correlated al-lele frequencies. The number of sub-groups (K) was estimated by 20 independent runs for each K (from 1 to 10) applying the admixture model, with allele frequencies uncorrelated for SSR markers, 100,000 Markov Chain Monte Carlo (MCMC) repetitions, and a 100,000 burning period. Means of the log-likeli-hood estimates for each K were calculated. The true K was determined using both an estimate of the pos-terior probability of the data for a given K [Pritchard et al. 2000], and the Evanno ÄK [Evanno et al. 2005]. A genotype was considered to belong to a group if its membership coefficient was ≥0.50.
Statistical analysis
Genetic diversity parameters of the fig collection were reported. Percentage of polymorphic loci (P%), number of different alleles (Na), number of alleles with a frequency greater than 5% (Na F ≥ 5%), number of effective alleles (Ne), Shannon’s information index (I), number of private alleles (NPA, equivalent to the num-ber of alleles unique to a single genotype in the data set), heterozygosity (H), expected variance (Ve),
ob-served variance (Vo), and disequilibrium index (Vo/Ve), were calculated by GenALEx software (v. 6.5) [Peak-all et al. 2006, 2012]. The same software was also used to perform the Analysis of MOlecular VAriance (AM-OVA), within and among geographical groups (Italy and Croatia). Heterozygosity was calculated following the formula (1 – Ópi2), where p
i2 is the frequency of
allele i averaged over the subpopulations. RESULTS
Molecular analysis of fig genotypes
The collection included a total of 139 genotypes, of which 98 from Italy and 41 from Croatia was di-vided into two subgroups, biferous and uniferous, according to the number of crops per year, thus ob-taining 107 and 32 genotypes for each group, respec-tively (Tab. 3).
DNA polymorphisms were scored across the fig collection and out of 49 tested primer pairs, 24 (48%) gave clear and reliable amplification products and thus could be used for molecular characterization of the collection. PCR amplification produced a total of 70 microsatellite alleles: 6 (8.6%) monomorphic.
Table 3. Genetic diversity statistics estimated for all the analysed microsatellite loci in the Ficus carica L. collection
Population P Na Na F Ne I H Ve Vo Vo/Ve
Overall 82.1 69.5 2.34 1.65 0.54 0.33 16.50 184.08 11.15
Italy 100 2.69 2.30 1.79 0.67 0.41 15.45 76.45 4.92
Croatia 64.3 2.00 1.74 1.51 0.41 0.26 9.58 64.31 6.71
P = percentage of polymorphic loci; Na = number of different alleles; Na F = number of alleles with frequency greater than 5%; Ne = number of
effective alleles = 1/(Σpi2); I = Shannon’s information index = −Σpi2*Ln (pi); H = heterozygosity (1 − Σpi2); Ve = expected variance; Vo =
observed variance; Vo/Ve = disequilibrium index
pi is the frequency of the ith allele for the population and Σpi2 is the sum of the squared population allele frequencies
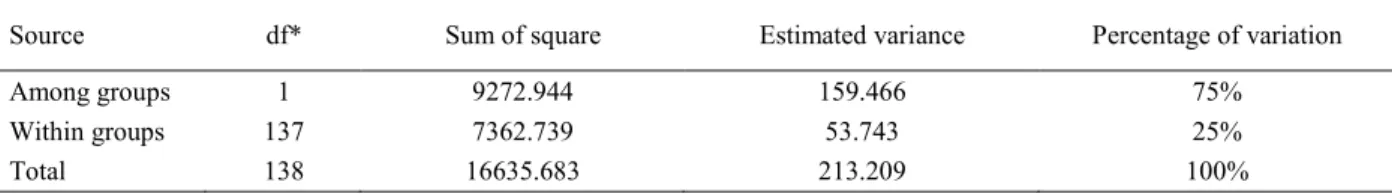
Table 4. Analysis of molecular variance (AMOVA) within and among Ficus carica L. accessions from two different
countries (Italy and Croatia)
Source df* Sum of square Estimated variance Percentage of variation
Among groups 1 9272.944 159.466 75%
Within groups 137 7362.739 53.743 25%
Total 138 16635.683 213.209 100%
* degree of freedom Fixation index (Fst) = 0.748
Whereas, the remaining 64 alleles (91.4%), produced by 22 primer pairs, showed a polymorphic pattern, and thus they were suitable to evaluate the genetic diversi-ty and estimate genetic distances in the collection. The number of amplified alleles per locus ranged between 2–4, with a length of the amplified alleles ranged be-tween 131–320 bp (Tab. 4).
The estimation of genetic diversity in the fig col-lection is summarized in Table 1. The overall number of different alleles, alleles with frequency greater than 5% and effective ones were 69.5, 2.34 and 1.65, re-spectively.
Shannon’s index of the whole collection (0.54) and heterozygosity (0.33) were used as two intra-region gene diversity. The disequilibrium index (Vo/Ve) was 11.15 for the whole collection with a value of 4.92 for the Italian group and 6.71 for the Croatian one. The lowest number of polymorphic loci within geographi-cal groups was detected for Croatia (64.3), while Italy showed 100% polymorphism.
Heterozygosity and Shannon’s information index, as two useful intra-region gene diversity indices, were 0.41 and 0.67 for Italy, and 0.26 and 0.41 for Croatia, respectively.
In order to discriminate between different groups in the fig collection, analysis of molecular variance (AMOVA) was also performed and the percentage of intra and inter-region genetic variation was esti-mated (Tab. 2). The fixation index (Fst) of the whole collection was 0.748 (P < 0.001), as reported in Ta- ble 2, meaning that 75% of the total variation occurred among different groups, while 25% was found within individual groups. The results of AMOVA for this ger-mplasm collection indicated that, at a molecular level, fig accessions coming from the same geographical ar-eas were similar compared to accessions of different origin.
Collection structure
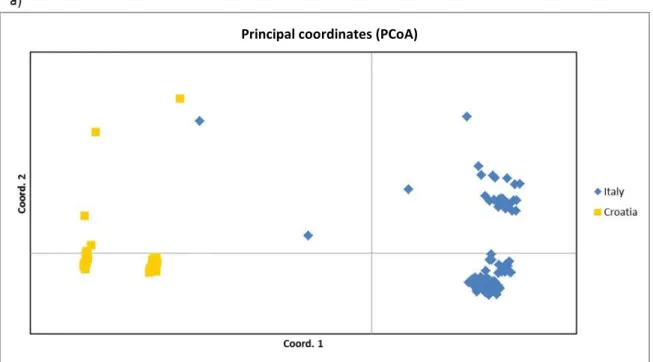
All the 70 polymorphic loci were used to estimate genetic diversity among the 139 fig genotypes and to determine the structure of the collection. Principal coordinate analysis (PCoA) (Fig. 1) was carried out to identify genetic structure within the data set. The first three coordinates explained 63.40%, 9.95% and 7.40% of genetic variation, respectively, accounting
for 80.75% in total. The PCoA was reported in two different ways identifying the geographical origin/lo-cation (Italy and Croatia) (Fig. 1a), and the number of crops (breba and/or main crop) per year of each ac-cession (uniferous and biferous) (Fig. 1b). As shown in the first plot (Fig. 1a), genotypes were split by the first axis in two distinct groups according to the geo-graphical site.
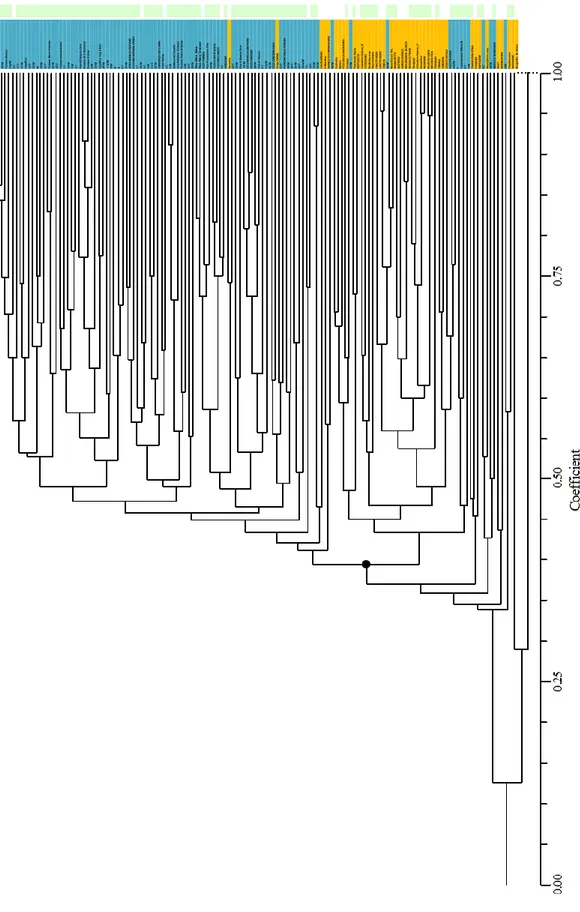
In order to elucidate genetic relationships among the 139 fig genotypes, 70 polymorphic microsatel-lite loci were used to build a phylogenetic tree based on the UPGMA algorithm using Jaccard’s similarity coefficient matrix. The highly dissected nature of the tree suggested that accessions were distinct from each other and most variation was confined to within clus-ters. Interestingly, cluster analysis split different gen-otypes in two groups based on their molecular simi-larity matching the geographical site (Fig. 2). Group I included the highest number of genotypes (89), of which the majority Italian (84 genotypes) and only 5 Croatians.
PCoA analysis and phylogenetic tree showed that group I included biferous genotypes, whereas group II included both uniferous and biferous types without distinction.
To assign the individuals into subpopulations based on genetic similarity, we used a Bayesian ap-proach implemented in STRUCTURE. Following the methodology described in Evanno et al. [2005], the ΔK were plotted against the K numbers of the groups, indicating the most likely number of sub-populations was 2 (Fig. 3a). Therefore, considering K = 2, the collection was split in two sub-groups (group 1, group 2) containing 55 and 84 accessions each (Fig. 3b). In particular, all of the Croatian and some Italian genotypes were assigned to group 1, with a Q1 mean of 0.86, while the Italian genotypes clustered to group 2, with a Q2 mean membership of 0.87.
Looking at the number of crops per year, group 1 contained 45% of uniferous accessions and 55% of biferous, whereas group 2 was composed by all bif-erous genotypes, except for the Italian lines 4 C, 7 C, 3 C, 1 C, 5 C and Fico Vernea, and the Croatian line Crnica (Tab. 5). The reason why some uniferous acces-sion clustered with the biferous in the group 2 could be due to a possible common origin of these varieties.
Fig. 1. Principal coordinates analysis (PCoA) plot of the first two components obtained from 70 SSRs for
139 fig accessions. The first three axis explained the 63.40%, 9.95% and 7.40% of genetic variation, respectively for a total of 80.75%. The graph reported the subdivision following a) the geographical origin/location of the ac-cessions and b) the number of crops per year (uniferous or biferous)
Principal coordinates (PCoA)
Fig. 2. Phylogenetic tree showing genetic distances within 139 fig genotypes resulting from SSR
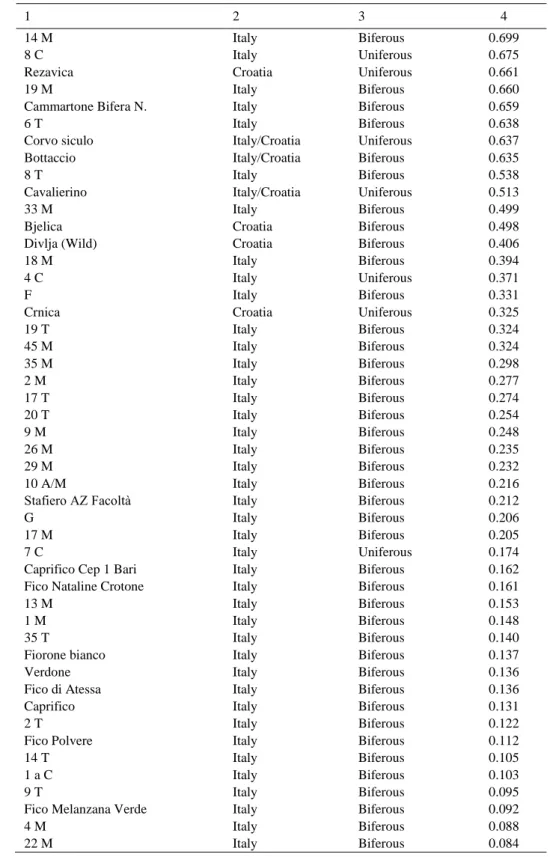
Table 5. List of the 139 Ficus carica L. genotypes with the site of origin/collection and the number of crops per year
(uniferous or biferous) with the Q values derived from the STRUCTURE analysis at K = 2
Genotype Site Type Q value
1 2 3 4 Uniferous 0.977 Uniferous 0.971 Italy Croatia Italy/Croatia Uniferous 0.971 Biferous 0.970 Uniferous 0.969 Uniferous 0.969 Uniferous 0.967 Uniferous 0.967 Croatia Italy/Croatia Italy/Croatia Croatia Croatia Croatia Uniferous 0.966 Biferous 0.966 Biferous 0.965 Uniferous 0.965 Biferous 0.962 Biferous 0.961 Biferous 0.959 Italy/Croatia Italy Croatia Italy/Croatia Italy Italy Croatia Uniferous 0.958 Biferous 0.955 Biferous 0.952 Biferous 0.950 Italy/Croatia Italy/Croatia Italy/Croatia Italy/Croatia Uniferous 0.949 Uniferous 0.948 Croatia Italy/Croatia Biferous 0.948 Biferous 0.946 Uniferous 0.942 Italy/Croatia Italy/Croatia Italy/Croatia Biferous 0.940 Biferous 0.940 Italy Italy/Croatia Uniferous 0.917 Biferous 0.914 Uniferous 0.913 Italy/Croatia Italy/Croatia Italy/Croatia Uniferous 0.909 Biferous 0.907 Uniferous 0.900 Biferous 0.895 Uniferous 0.894 Biferous 0.836 Biferous 0.834 Uniferous 0.824 Biferous 0.819 Biferous 0.799 Biferous 0.799 Uniferous 0.790 Biferous 0.746 Biferous 0.730 Biferous 0.723 Nerello Marchese Split Bamborino Fico della Madonna Montalcino rosa Brogiotto Bi. Bocci Bružetka bijela Momjan Šaraguja Piombionese 44 M Zimica Raffaone 40 M 6 M Francuska crna Rosso di Trani Caietti nero Zuchetto Bianco di Carmingano Bružetka crna Faraone Poli pistoia Verdino Columbro bianco_B 27 M Bianchetto Fiorone Columbro bianco_U New Bianco Nic. 7 M Miljska figa Ficazzano Dattero 10 M Melanzana Bianca Zamorčica S. Martino
Vera Bianca Crotone M Troiano Petrovača bijela D Sardo bianco 21 M Italy Slovenia/Croatia Italy/Croatia Italy/Croatia Italy Italy/Croatia Croatia Italy/Croatia Italy Italy Italy/Croatia Croatia Italy Italy/Croatia Italy Biferous 0.702
Table 5 cont. 1 2 3 4 Italy Biferous 0.699 Italy Uniferous 0.675 Croatia Uniferous 0.661 Italy Biferous 0.660 Italy Biferous 0.659 Italy Biferous 0.638 Italy/Croatia Uniferous 0.637 Italy/Croatia Biferous 0.635 Italy Biferous 0.538 Italy/Croatia Uniferous 0.513 Italy Biferous 0.499 Croatia Biferous 0.498 Croatia Biferous 0.406 Italy Biferous 0.394 Italy Uniferous 0.371 Italy Biferous 0.331 Croatia Uniferous 0.325 Italy Biferous 0.324 Italy Biferous 0.324 Italy Biferous 0.298 Italy Biferous 0.277 Italy Biferous 0.274 Italy Biferous 0.254 Italy Biferous 0.248 Italy Biferous 0.235 Italy Biferous 0.232 Italy Biferous 0.216 Italy Biferous 0.212 Italy Biferous 0.206 Italy Biferous 0.205 Italy Uniferous 0.174 Italy Biferous 0.162 Italy Biferous 0.161 Italy Biferous 0.153 Italy Biferous 0.148 Italy Biferous 0.140 Italy Biferous 0.137 Italy Biferous 0.136 Italy Biferous 0.136 Italy Biferous 0.131 Italy Biferous 0.122 Italy Biferous 0.112 Italy Biferous 0.105 Italy Biferous 0.103 Italy Biferous 0.095 Italy Biferous 0.092 Italy Biferous 0.088 14 M 8 C Rezavica 19 M Cammartone Bifera N. 6 T Corvo siculo Bottaccio 8 T Cavalierino 33 M Bjelica Divlja (Wild) 18 M 4 C F Crnica 19 T 45 M 35 M 2 M 17 T 20 T 9 M 26 M 29 M 10 A/M Stafiero AZ Facoltà G 17 M 7 C
Caprifico Cep 1 Bari Fico Nataline Crotone 13 M 1 M 35 T Fiorone bianco Verdone Fico di Atessa Caprifico 2 T Fico Polvere 14 T 1 a C 9 T
Fico Melanzana Verde 4 M
Table 5 cont. 1 2 3 4 Italy Biferous 0.080 Italy Biferous 0.079 Italy Biferous 0.078 Italy Biferous 0.072 Italy Biferous 0.069 Italy Biferous 0.067 Italy Biferous 0.066 Italy Biferous 0.063 Italy Uniferous 0.063 Italy Biferous 0.062 Italy Biferous 0.062 Italy Biferous 0.061 Italy Uniferous 0.057 Italy Biferous 0.054 Italy Biferous 0.053 Italy Biferous 0.053
Troiano Nero Crotone 7 T 4 A/M 37 M Fico Dell'Abate Fiorone precocissimo 21 T Fico Troia 3 C
Fiorone della Regina Fiorone Testa di Gatto Caprifico Cep 2 Bari 1 C
42 M
Fico Nero Sava 10 T 28 M Italy Biferous 0.053 Italy Biferous 0.051 Italy Biferous 0.050 Italy Biferous 0.049 41 M 34 M 23 M 24 M Italy Biferous 0.046 Italy Biferous 0.045 Italy Biferous 0.044 Italy Biferous 0.043 Italy Biferous 0.042 Italy Biferous 0.040 Italy Biferous 0.040 Italy Biferous 0.037 Italy Biferous 0.037 Italy Biferous 0.037 Italy Biferous 0.036 Italy Biferous 0.035 Italy Biferous 0.031 Italy Biferous 0.031 Italy Biferous 0.030 Italy Uniferous 0.030 Italy Biferous 0.030 Italy Biferous 0.029 Italy Biferous 0.028 Italy Biferous 0.028 Italy Biferous 0.027 Italy Biferous 0.027 Italy Biferous 0.026 Italy Uniferous 0.025 Italy Biferous 0.025
Fico A Bianco Oria 3 A/M 7 M 5 M 22 T 6 A/M 23 T 15 T 3 T Columbro B Crotone Petrelli Bianco Oria 15 M
Fico verdone Sava Fico Nero Crotone 5 C
1 A/M 20 M 24 T Fico Faraone Fico Fracazzano Oria Fiorone di S.Giovanni Fiorone B Oria Fico Vernea 43 M
DISCUSSION
Germplasm characterization of plant accessions has been restricted, thus limiting the breeding pro-grams. Fig is one of the ancient species from the Med-iterranean basin adapted to a wide range of climate conditions characterized by numerous ecotypes and landraces selected and cultivated in different agri-cultural areas, with a growth of homonyms and syn-onyms, causing problems for genotype categorization [Galet 1990, Lebot and Aradhya 1991, Aradhya et al. 1995]. More than 700 varieties were listed by Con-dit [1955] in the monograph on fig varieties and many of them have large numbers of synonyms. The lack of information and the occurrence of extensive syn-onyms complicated the deciphering of genetic identi-ty and relationships among the genoidenti-types. Moreover, genetic and site of origin of most of the fig genotypes is unknown and all data concerning the genotypes are incomplete, inaccurate, or missing in most germplasm collections.
In this study, 70 microsatellite loci were used to investigate the genetic relationships among 139 fig genotypes collected in two different Mediterranean countries (Italy and Croatia) in order to describe the relationship among the collection and try to character-ize uniferous and biferous genotypes.
In the present study, the average expected hetero-zygosity (H) of 0.335 was similar or slightly lower to previously published works, 0.482 in 194 worldwide fig tree accessions [Aradhya et al. 2010], 0.44 in 19 European and Asian fig tree varieties [Ikegami et al. 2009] and 0.53 in 57 Spanish fig tree accessions [Pe-rez-Jimenez et al. 2012]. However, this value was lower compared to 0.678 reported in 76 Turkish fig varieties [Caliskan et al. 2012].
In addition, AMOVA analysis indicated that only 25% of the total genetic diversity is distributed with-in groups, whereas 75% of the diversity is attributed to differences between regions. This high variability between regions indicated that, at a molecular level, fig accessions coming from different geographical ar-eas were diverse with respect to accessions with the same area of origin. Although Croatia and Puglia are on two sides of the Adriatic Sea and exchange of plant material have occurred since ancient times (Roman, Byzantines, Venetians, Turkish, etc.) and Croatian
have carried fig varieties from Italy, the fig varieties diversified their biological features in the two differ-ent countries. Our data differ from a previous report on the analysis of genetic diversity among European and Asian fig varieties [Ikegami et al. 2009], which explained the low divergence between collections/ groups with the occurrence of gene flow or common origin of the populations [Salhi-Hannachi et al. 2005, Ikegami et al. 2009], probably because they analyzed only 19 fig genotypes.
Our data were confirmed by PCoA, phylogenetic tree and the structure analysis. These results indicat-ed that the examinindicat-ed fig genotypes clusterindicat-ed in two distinct groups according to their geographical lo-cation. Moreover, Bayesian analysis showed that at K = 2, without prior population information, the simulation attained the highest likelihood value and had the higher clusterness, confirming the previous work on genetic diversity and structure of Mediter-ranean basin Ficus carica genotypes [Ganopoulos et al. 2015]. Herein, we supposed that the fig collection was characterized by a typical continuous genetic diversity, supported by two independent clusters ob-tained in relation to their origin/location. Maybe figs in Italy and Croatia had common ancestors in ancient times and diversified their features in the successive centuries as a consequence of different criteria: a different selection of growers (types of crops), other introduced materials, use for fresh or dried consump-tion, etc. Furthermore, as reported in literature, many uniferous and biferous varieties clustered together in the same group indicating a possible common origin of these varieties [Salhi Hannachi et al. 2006, Chatti et al. 2007, Baraket et al. 2009, 2011, Ganopoulos at al. 2015], due to the monoecious origin of Ficus that has evolved into two gynodioecious forms as suggested by Machado et al. [2001]. Probably all the fig varieties were ‘biferous’, at least physiologically, and can be considered as ‘commercially uniferous’ since the breba crop is absent or in traces in many ‘uniferous’ varieties. However, the buds of the breba (fruit buds) are present also in the uniferous varieties thus suggesting the fig to be at least physiologically biferous for all the varieties (with some triferous va-rieties). The distinction on the PCoA of two not well defined groups for uniferous and biferous could con-firm this idea indicating that the difference should be
only related to varieties requiring pollination or not as previously reported [Ferrara et al. 2016].
CONCLUSION
Data presented in the current study on a collection of fig genotypes from Italy and Croatia could be a useful tool towards understanding the fig biology and breeding programs. We demonstrated that (1) genetic diversity of this fig collection was higher compared to the other previous studies, and (2) SSR markers suc-cessfully contributed to the estimation of the related-ness of fig at the varietal level.
ACKNOWLEDGEMENT
This work has been supported by grants from ‘Pro-getti integrati per la Biodiversità’, Progetto Recupero del Germoplasma Frutticolo Pugliese, Re.Ge.Fru.P., SVILUPPO RURALE FEASR 2007–2013 Reg. (CE) 1698/2005. Asse II ‘Miglioramento dell’Ambiente e dello Spazio Rurale’. Misura 214 ‘Pagamenti Agroam-bientali’. Azione 4, Sub azione a.
REFERENCES
Achtak, H., Oukabli, A., Ater, M., Santoni, S., Kjellberg, F., Khadari, B. (2009). Microsatellite markers as reliable tools for fig cultivar identification. J. Am. Soc. Hortic. Sci., 134, 624–631.
Aradhya, M.K., Stove, E., Velasco, D., Koehmstedt A. (2010). Genetic structure and differentiation in cultivat-ed fig (Ficus carica L.). Genetica, 138, 681–694. Aradhya, M.K., Zee, F.T., Manshardt, R.M. (1995). Isozyme
variation in lychee (Litchi chinensis Sonn). Sci. Hortic., 63, 21–35.
Baraket, G., Chatti, K., Saddoud, O., Abdelkarim, A.B., Mars, M., Trifi, M., Hannachi, A.S. (2011). Compara-tive assessment of SSR and AFLP markers for evalua-tion of genetic diversity and conservaevalua-tion of fig, Ficus
carica L., genetic resources in Tunisia. Plant Mol. Biol.
Report., 29, 171–184.
Baraket, G., Chatti, K., Saddoud, O., Mars, M., Marrakchi, M., Trifi, M., Salhi-Hannachi, A. (2009). Genetic analy-sis of Tunisian fig (Ficus carica L.) cultivars using am-plified fragment length polymorphism (AFLP) markers. Sci. Hortic., 120, 487–492.
Caliskan, O., Polat, A.A., Celikkol, P., Bakir, M. (2012). Molecular characterization of autochthonous Turkish fig accessions. Span. J. Agric. Res., 10, 130–140.
Chatti, K., Saddoud, O., Salhi Hannachi, A., Mars, M., Mar-rakchi, M., Trifi, M. (2007). Inferring of genetic diver-sity and relationships in a Tunisian fig (Ficus carica L.) germplasm collection by random amplified microsatel-lite polymorphisms. J. Integr. Plant Biol., 49, 386–391. Condit, I.J. (1955). Fig varieties: a monograph. Hilgardia,
23, 323–539.
Datwyler, S.L., Weiblen, G.D. (2004). On the origin of the fig: phylogenetic relationships of Moraceae from ndhF sequences. Am. J. Bot., 91, 767–777.
Evanno, G., Regnaut, S., Goudet, J. (2005). Detecting the number of clusters of individuals using the software STRUCTURE: A simulation study. Mol. Ecol. Notes, 14, 2611–2620.
Ferrara, G., Mazzeo, A., Pacucci, C., Matarrese, A.M.S., Tarantino, A., Crisosto, C., Incerti, O., Marcotuli, I., Nigro, D., Blanco, A., Gadaleta, A. (2016). Character-ization of edible fig germplasm from Puglia, southeast-ern Italy: is the distinction of three fig types (Smyrna, San Pedro and Common) still valid? Sci. Hortic., 250, 52–58.
Flaishman, M., Rodov, V., Stover, E. (2008). The fig: bota-ny, horticulture and breeding. Hortic. Rev., 34, 113–96. Galet, P. (1990). Cepages et Vignobles de France. Tome II
L’Ampelographie FranHaise. 2nd ed. Imprimerie Charles
Dehan Press, Montpellier, France.
Ganopoulos, I., Xanthopoulou, A., Molassiotis, A., Karagi-annis, E., Moysiadis, T., Katsaris, P., Aravanopoulos, F., Tsaftaris, A., Kalivas, A., Madesis, P. (2015). Mediter-ranean basin Ficus carica L. from genetic diversity and structure to authentication of a Protected Designation of Origin cultivar using microsatellite markers. Trees. Struct. Funct., 29, 1959–1971.
Giraldo, E., Viruel, M.A., Lopez-Corrales, M., Hormaza, J.I. (2005). Characterisation and cross-species transfer-ability of microsatellites in the common fig tree (Ficus
carica L.). J. Hortic. Sci. Biotechnol., 80, 217–224.
Ikegami, H., Nogata, H., Hirashima, K., Awamura, M. (2009). Analysis of genetic diversity among European and Asian fig varieties (Ficus carica L.) using ISSR, RAPD, and SSR markers. Genet. Resour. Crop Evol., 56, 201–209.
Lebot, V., Aradhya, K.M. (1991). Isozyme variation in taro [Colocasia esculenta (L.) Schott] from Asia and the Pa-cific. Euphytica, 56, 55–66.
Machado, C.A., Jousselin, E., Kjellberg, F., Compton, S.G., Herre, E.A. (2001). Phylogenetic relationships,
histori-cal biogeography and character evolution of fig pollinat-ing wasps. Proc. R. Soc. B-Biol. Sci., 268, 7–10. Peakall, R., Smouse, P.E. (2006). GenAlex 6: genetic
anal-ysis in Excel. Population genetic software for teaching and research. Mol. Ecol. Notes, 6, 288–295.
Peakall, R., Smouse, P.E. (2012). GenAlEx 6.5: genet-ic analysis in Excel. Population genetgenet-ic software for teaching and research − an update. Bioinformatics, 28, 2537–2539.
Perez-Jiménez, M., López, B., Dorado, G., Pujadas-Salvá, A., Guzmán, G., Hernández, P. (2012). Analysis of ge-netic diversity of southern Spain fig tree (Ficus carica L.) and reference materials as a tool for breeding and conservation. Hereditas, 149, 108–113.
Prgomet, Ž., Bohač, M. (2003). Smokva (Ficus carica L.). Skink, Rovinj.
Salhi-Hannachi, A., Chatti, K., Mars, M., Marrakchi, M., Trifi, M. (2005). Comparative analysis of genetic di-versity in two Tunisian collections of fig cultivars based on random amplified polymorphic DNA and inter sim-ple sequence repeats fingerprints. Genet. Resour. Crop Evol., 52, 563–573.
Salhi-Hannachi, A., Chatti, K., Saddoud, O., Mars, M., Rhouma, A., Marrakchi, M., Trifi, M. (2006). Genetic diversity of different Tunisian fig (Ficus carica L.) col-lections revealed by RAPD fingerprints. Hereditas, 143, 15–22.
Storey, W.B. (1976). Subtropical and tropical fruit and nut crops in California, USA. I International Symposium on Tropical and Subtropical Fruits, 57, 53–62.