In situ dynamic characterization of soils by
means of measurement uncertainties and
random variability
G. Vessia & C. Cherubini
Department of Civil and Environmental Engineering, Polytechnic of Bari, Italy
Abstract
In situ dynamic characterization of natural granular soils by means of VS values is accomplished by direct and indirect investigation techniques. Integration among those types of field test are encouraged by Eurocode 8 through correlations amongst VS and NSPT but this does not suggest the best correlation formulation among the ones presented over the last thirty years. Besides such correlations can provide highly disperse values of VS. Thus a rational design of investigation campaign and measurement interpretation and calculations appears to play an important role in dynamic characterization of granular soils accomplished by in situ tests. It should rely on selecting the best fitting correlation formulations site by site according to soil types, their random structures and the characteristics of investigation techniques measured dynamic soil properties. An application of statistical approach to the issues previously sketched is carried out in the Pomigliano d’Arco urban area where Down-Hole and Standard Penetration tests were performed for dynamically characterizing the foundation soils. Assessment of uncertainties in VS values should allow the performance of hazard analyses and reliability-based design in seismic areas.
Keywords: Down-Hole tests, SPT, model uncertainty, NSPT-VS relations,
measurement errors.
1 Introduction
Dynamic characterization of granular soils at low strain level is the first step of seismic response analyses or of soil basement dynamic classification whenever is needed for building designing activity in urbanized areas. Various “in field”
©2007 WIT Press WIT Transactions on Engineering Sciences, Vol 57,
www.witpress.com, ISSN 1743-3533 (on-line) doi:10.2495/MC070341
techniques have been developed and enhanced to that scope as Down-Hole and Standard Penetration Test or similar tests. The first device allows to directly record arrival times and convert them into VS and VP; whereas the second one gives indirectly the velocity VS by means of correlations, developed by different authors over the years, with the number of blow counts NSPT. Such direct and indirect techniques for VS estimation are concerned with uncertainties and suffer the inherent variability and heterogeneity that granular soil deposits show. Accordingly it should be useful to recognize the most affecting sources of uncertainties for the two types of investigation techniques in order to make them more reliable whenever geostatistical approach is employed.
The study presented below deals with the proposal of statistical methods to improve the reliability of VS values both from direct and indirect measure. As indirect device concerns, that are NSPT measurements, the uncertainties in NSPT values and uncertainties given by the transformation models will be taken into account.
2 V
Sdirect measurements and their interpretation
A common geotechnical in field test to measure shear wave velocity (VS) is the Down-Hole test. It is a punctual investigation and it exploits the theory of refraction of waves in order to measure the first arrival times of S and V waves.
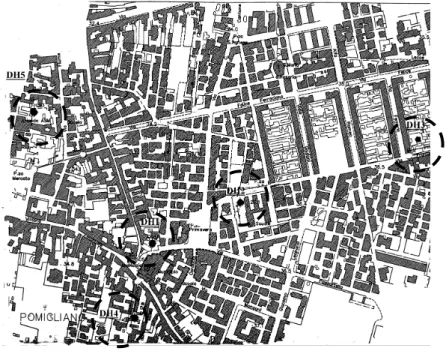
Figure 1: Down-Hole tests setting at Pomigliano d’Arco town.
©2007 WIT Press WIT Transactions on Engineering Sciences, Vol 57,
Besides geophysics investigates the real soil deposits with a lot of approximations and simplifications because they are very complex and heterogeneous media in spite the theory of refraction and propagation of elastic waves within a homogeneous and elastic medium.
Hence, the interpreting phase of recorded arrival times play a fundamental role even though it is heavily influenced by the operator judgement. This is the most relevant issue why the application of reliability approach to that dataset is a hard work. Let us now consider the case of five Down-Hole tests performed in the urban area of Pomigliano d’Arco, a town near Naples (Italy), where a microzonation activity was recently carried on (fig. 1). Five borings of 30m depth were investigated and five Down-Hole tests were performed. Direct analyses of soil samplings over the five profiles show successions of pyroclastic sandy deposits from 0 to 16m depth and lava and sand alternate levels from 16m to 30m. This evidence can be caught from the five time vs. depth diagrams illustrated in fig. 2. 1 3 5 7 9 11 13 15 17 19 21 23 25 27 29 31 0 20 40 60 80 100 120 140 Time (ms) De p th ( m ) DH1 DH2 DH3 DH4 DH5
Figure 2: Time versus depth diagram for the five Down-Hole tests performed in Pomigliano d’Arco town.
As can be pointed out at 16m a change in arrival times is evident but more variability can be drawn deeper. Furthermore some differences in resulting VS values can be read, affecting seismic strata distribution, whether different methods are employed. Table 1 shows VS values according to the following two interpretation procedures of time vs. depth diagrams:
(1) it considers interval velocities and defines a seismic stratum where rapid variations occur;
(2) it searches for a linear trend on time vs. depth diagram then sketches bounds where the trend visibly changes.
©2007 WIT Press WIT Transactions on Engineering Sciences, Vol 57,
Table 1: VS values (m/s) calculated by means of method (1) and method (2) from the five Down-Hole tests.
DH1 DH2 DH3 DH4 DH5 Depth (m) 1 2 1 2 1 2 1 2 1 2 1 240 227 211 278 278 250 281 264 196 212 4 5 258 10 11 185 208 12 146 191 14 15 1121 1167 16 17 1126 1020 1204 1176 18 1040 1064 19 1053 1034 441 282 21 22 1212 23 1209 24 258 236 25 281 233 251 28 29 230 286 227 30
Table 1 shows different seismic strata and different VS values. Even when seismic strata for the two methods correspond, there are no way to rationally lead to unique VS values.
This subjectivity cannot be solved and its final dispersion in VS values cannot be treated or reduced in any way.
In order to address this issue Cherubini and Vessia [5] suggested using statistical techniques on time vs. depth diagram to derive a trend and residuals that recognize vertical variability structure of the deposit. That approach would be useful whenever Down-Hole tests are performed in the nearby and eventually supported by seismic refraction tests in order to get also horizontal variability structure. On the contrary, as can be seen in fig. 1, in Pomigliano d’Arco those five seismic tests are set far each other. For that reason only their vertical variability structures shall be considered. Thus another procedure is presented here with the scope of defining VS values from time vs. depth diagrams in a unique and repeatable fashion. The technique applied was proposed by Vivatrat
©2007 WIT Press WIT Transactions on Engineering Sciences, Vol 57,
[6] and it was born and developed for continuous vertical measurements performed in bore holes as cone penetration test (CPT). Here it is successfully applied to Down-Hole tests.
2.1 Vivatrat procedure applied to VS estimation
The Vivatrat filtering procedure allows to statistically treat measures by selecting those data which result to be odd values and affect the mean trend and the variability of the data set. The Vivatrat procedure can be sketched in the following items: (1) To plot the unfiltered measures (arrival time) versus depth. (2) To divide the complete dataset of measures in layers of extension D: it is suggested to vary from 0.5m to 2.5m. In this case, the space lag between measures is 1m, thus it is assumed D=1m not to reduce the resolution of measures for “outlying peak” detection. (3) Calculation of mean µi and standard deviation si for each sub-layer identified. (4) Calculation of the “representative dispersion” Sr which is the minimum value among the following expressions:
(
i 1 i)
r S S 2 1 S = + + (1)(
i1 i)
r S S 2 1 S = − + (2)(
i 1 i 1)
r S S 2 1 S = + + − (3)where Si-1, Si and Si+1 are the standard deviations calculated for sub-layers i-1, i and i+1 respectively. (5) To filter the measures which lie beyond the following limit values:
r i ±A⋅S
µ (4)
where µi is the mean value within the sub-layer i, Sr is the characteristic standard deviation and A is the coefficient of the limiting band which can assume a value belonging to the interval (0.5; 2.5). In this case, four value of A were attempted: 0.5m, 1m, 1.5m and 2m. Thus for final results just A=1m is accounted for due to the fact that 0.5m eliminates quite all of the data, 1.5m filters as much data as 1m; finally 2m allows quite all of the data set to be accounted for.
Accordingly table 2 summarizes results for the five Down-Hole shear wave velocities filtered by means of the Vivatrat procedure.
Comparing table 1 and table 2 differences into seismic strata and VS values can be found but they are not so relevant. Nevertheless from a methodological point of view, the Vivatrat procedure shows a real advantage because of its objectivity and repeatability. Moreover such method reduces the number of seismic strata making them more strictly correspond with lythological interfaces.
©2007 WIT Press WIT Transactions on Engineering Sciences, Vol 57,
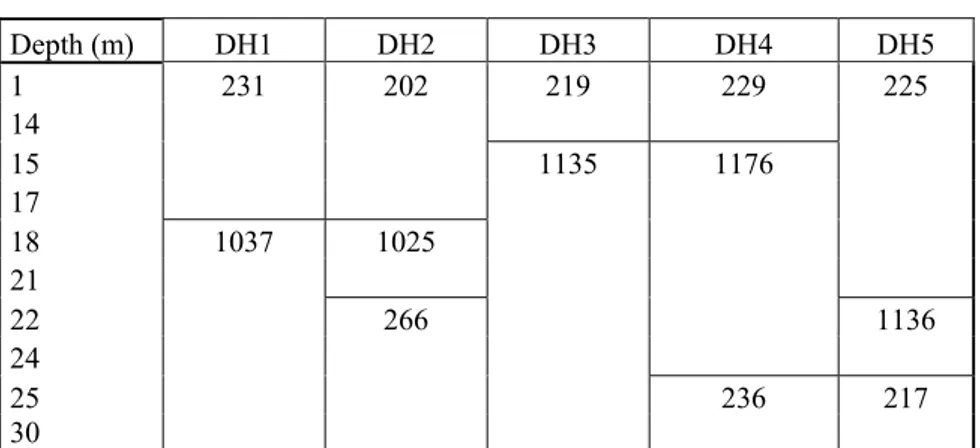
Table 2: Shear wave velocity values (m/s) and seismic strata subdivision from Vivatrat procedure for five Down-Hole tests.
Depth (m) DH1 DH2 DH3 DH4 DH5 1 231 202 219 229 225 14 15 1135 1176 17 18 1037 1025 21 22 266 1136 24 25 236 217 30
3 V
Sestimation by means of standard penetration tests
International building codes for seismic areas as Eurocode 8 [1] and the Italian “Testo Unico” [2] indicate the possibility of performing a dynamic soil characterization by means of the measurements performed over 30m depth of three parameters as shear wave velocity (VS), blow count from standard penetrometer tests (NSPT) and undrained shear strength (su). Besides, for granular soils only VS and NSPT are useful and from now on we will deal only with them. Then parameter values should be converted into shear modulus at low strain rate, G0 in order to carry out dynamic geotechnical analyses. At this stage VS values are needed. That is the main reason why numerous correlation expressions between VS and NSPT are raised provided that standard penetrometer tests are widely performed and VS is the most used parameter for in situ G0 estimation.
Those empirical expressions are derived by means of different NSPT and VS database from all over the world but none provides high correlation coefficients. One well known expression is that by Ohta and Goto [4], whose database refers to alluvial plains in Japan:
EF z N 69 V 0.17 0.2 SPT S = ⋅ ⋅ (5)
where z= depth (m); E= the geological epoch factor: 1.0 (Holocene), 1.3 (Pleistocene); F= soil type factor: 1.0 clay, 1.09 fine sand, 1.07 medium sand, 1.14 coarse sand, 1.15 gravely sand, 1.45 gravel.
They provided their best relation between NSPT and VS (eqn. (5)) with a correlation coefficient R2 equal to 0.86 with a probable error of 19.7%. Moreover it is worth noticing that Ohta and Goto also proposed to take into account different variables as effective stress, depth, soil type, geological epoch or only the NSPT value formulating other empirical expressions reported within [7]. Accordingly they found that the equation where VS depends only on NSPT
©2007 WIT Press WIT Transactions on Engineering Sciences, Vol 57,
variable has a correlation coefficient slightly different from those considering geological epoch, soil type and depth as the eqn. (5) (R2=0.719, 27.4% for probable error). Over the years numerous were the researchers tried to manage the possible correlation between NSPT and VS but each formulation has not a wide applicability and problems on correspondence of VS measured and estimated values are still opened. In this study the eqn. (5) has chosen, amongst the others, and applied to NSPT measures performed at Pomigliano d’Arco in five boreholes where Down-Hole tests were carried out (see table 3). Table 3 reports NSPT values over 16m depth because of the presence of lava and sands alternate levels under 16m for which standard penetration test results are often unreliable. Table 3: NSPT values measured over five soundings where Down-Hole tests
were performed. NSPT Depth (m) S1 S2 S3 S4 S5 1 2 20 2.5 5 4 15 5 25 6 53 7.5 49 8 16 10 9 29 49 10.5 26 11 24 12 17 27 12.9 27 14.5 63 15 1 16
Shear wave velocity estimates from the application of eqn. (5) to the pyroclastic medium sands over the first 16m depth are illustrated in table 4 and compared with VS measures from Down-Hole tests filtered by Vivatrat procedure. As can be seen differences in values are registered even though they don’t show systematic trend. In fact sometimes VS measured values are higher than the estimated one but other times the contrary is true. Moreover often the two types of values are near each other but not always and this occurrence apparently cannot be related to the depth or to the estimation errors.
Thus VS indirect estimation would become a very uncertain activity which could lead to an unreliable geotechnical design if variability and uncertainties concerning to NSPT measures and transformation models are not investigated.
©2007 WIT Press WIT Transactions on Engineering Sciences, Vol 57,
Table 4: VS values estimated by NSPT and Vivatrat procedure applied to VS (m/s) measurements performed by Down-Hole tests.
Depth (m) VS1 DH1 VS2 DH2 VS3 DH3 VS4 DH4 VS5 DH5 1 2 183 219 2.5 152 231 4 201 225 5 229 219 6 270 231 7.5 278 225 8 233 219 215 229 9 264 231 289 202 10.5 267 225 11 266 219 12 255 231 276 202 12.9 280 225 14.5 331 229 15 165 202
4 Uncertainties concerning with SPT measurements
Standard penetration test (SPT) is a common tool for geotechnical characterization of building sites due to its economy and simplicity. Nevertheless most of the sources of uncertainties concerned with the NSPT measures have not sufficiently quantified. A detailed list of 27 sources of uncertainties are illustrated by Zekkos et al. [3] but only three out of them can be taken into account by means of reliability analyses:
1. Soil inherent variability
2. Equipment uncertainties due to hammer efficiency, borehole diameter and sampler
3. Procedure uncertainties
Phoon and Kulhawy [7] summarized measurement errors and random variability commonly found for in situ tests. As regard NSPT values three coefficient of variation (COV (%)) ranges are outlined for the three sources of uncertainties itemized above:
1. Random variability for clay and sand: 12%÷50%; 2. Equipment uncertainty: 5%÷75%;
3. Procedure uncertainty: 5%÷75%.
In the case studied the NSPT values are not enough for carrying out a variability soil characterization. Accordingly in order to assess the reliability of VS estimation by means of NSPT measures and eqn. (5) by Ohta and Goto, the minimum values of the COV ranges reported are taken for the study. Moreover the variance related to the transformation model is calculated by the formulation of probable error (E) indicated by [4]:
©2007 WIT Press WIT Transactions on Engineering Sciences, Vol 57,
(
)
(
)
0.071 675 . 0 1 E ln n V V SD n 1 i 2 o c 2 m = + = − =∑
= (6) where SD2m is the variance that represents the “model error”; Vc is the shear wave velocity calculated by eqn. (5); V0 is the corresponding shear wave velocity in situ measured; n is the number of measures and E is the calculated probable error that is 19.7% for eqn. (5).
In order to measure the reliability of VS estimated values by means of NSPT measures and eqn. (5) variability and uncertainties are combined consistently using the second-moment probabilistic approach, reported by [7].
According to such approach the mean value and the variance characterizing an estimated variable ξd is given by the following expressions:
( )
t,0 T mξd ≈ (7) 2 2 2 e 2 2 w 2 2 d SD T SD e T SD w T SDξ ε ε ∂ ∂ + ∂ ∂ + ∂ ∂ ≈ (8)where T(⋅) is the “transformation model” or the correlation equation eqn. (5) for the case studied; t is the deterministic trend function or the mean value; SD2w, SD2e and SD2ε introduce variances concerned to inherent soil variability, measurement error and transformation uncertainty respectively.
Results from the application of the second-moment probabilistic technique are presented in table 5. The total coefficient of variation measures the reliability of estimate at each depth. Hence, for those values of COV higher than 50% the estimate results to be unreliable whereas those values of COV lower than 50% should be considered as reliable as the NSPT values result to be.
Table 5: Total coefficient of variation related to VS estimated values by means of Ohta and Goto expression in terms of NSPT measures from five boreholes.
VS1 COV VS2 COV VS3 COV VS4 COV VS5 COV 152 83% 289 16% 183 25% 215 59% 201 37% 270 14% 276 28% 229 25% 331 14% 278 16% 264 25% 165 >100% 233 40% 267 28%
255 41% 266 30% 280 28%
5 Conclusions
In the paper two reliability studies are carried out on shear wave velocity determination by means of in situ tests: Down-Hole and Standard Penetration Tests. The first one is related to depth vs. arrival time diagrams from Down-Hole measures: a filtering procedure is applied in order to suggest a standard method by means of seismic strata detection and VS value calculation.
©2007 WIT Press WIT Transactions on Engineering Sciences, Vol 57,
The second issue attains the evaluation of reliability in estimation of shear wave velocity from NSPT measures by means of Ohta and Goto relationship. The analysis considers the contributions of measurement errors in SPT, inherent variability of soil and transformation model error from eqn. (5) to the final VS values. The study shows that often the reliability of VS estimation, for the case studied, can be considered acceptable and can justify the differences in values between measured and estimated VS.
Results from such work can be reviewed as a contribution to a more objective method for dynamic characterization of soils aimed at dealing with both foundation designing and local seismic response analyses.
References
[1] Eurocode 8. Design of structures for earthquake resistance. Part 1: General rules, seismic actions and rules for buildings. UNI ENV 1998 – 1, 2005.
[2] Testo Unico. Norme tecniche per le costruzioni. Ministero delle Infrastrutture e dei Trasporti, 29 settembre 2005.
[3] Zekkos D.P., Bray J.D. & Der Kiureghian A., Reliability of shallow foundation design using the standard penetration test. Proc. ISC-2 on
Geotechnical and Geophysical Site Characterization, Viana da Fonseca &
Mayne eds., Millpress: Rotterdam, pp. 1575-1582, 2004.
[4] Ohta Y., Goto N., Empirical shear wave velocity equations in terms of characteristics soil indexes, Earth. Eng. Struct. Dyn., 6, pp. 167-187, 1978.
[5] Cherubini C. & Vessia G., A Stochastic Approach to Manage Variability from in Situ Test Data, Proc. of the Joint Specialty Conference on
Probabilistic Mechanics and Structural Reliability, ASCE, 26-28 July,
Albuquerque, 2004.
[6] Vivatrat V. Cone Penetration in clays, Ph.D. Thesis MIT Cambridge,
Mass. (USA), 1979.
[7] Phoon K.K. & Kulhawy F.H., Characterization of geotechnical variability,
Can. Geotech. Journal, 36, pp. 612-624, 1999.
©2007 WIT Press WIT Transactions on Engineering Sciences, Vol 57,