3
Contents
Abstract . . . 6
Problem statement, objectives and work strategy. . . 8
1. Pilot scale WGS-MR design . . . 10
Introduction . . . 10
1.1. Pilot scale definition . . . 13
1.2. Case studies identification . . . 15
1.3. Screening case studies . . . 18
1.4. Preliminary estimation of membrane area . . . 26
1.5. Modelling and simulation of WGS-MR . . . 33
1.5.1. Mass balance . . . 35
1.5.2. Energy balance . . . 37
1.5.3. Permeation flux equation . . . 39
1.5.4. Kinetic equation . . . 40
1.5.5. Pressure drop . . . 41
1.5.6. Simulation condition . . . 42
1.6. Simulation results and discussion . . . 43
1.6.1. Result for vacuum scenario . . . 44
1.6.2. Results for sweep scenario . . . 50
1.7 Conclusion . . . 56
2. Integration of WGS-MR in small scale hydrogen generator: process plant simulation . . . 63
Introduction . . . 63
2.1. On site H2 generator: size definition . . . 67
2.2. Definition process up-stream WGS-MR: NG steam reforming unit . . . 67 2.3. Integration of WGS-MR unit in process flow diagram . . . 71
2.4. Downstream WGS-MR process re-design. . . 75
2.4.1. Permeate post processing . . . 77
2.4.2. Retentate post-processing . . . 79
4
2.5.1 Vacuum scenario . . . 89
2.5.2 Sweep scenario . . . 93
2.6 Comparison of scenario performance. . . 96
2.7 Conclusion . . . 101
3 CO2 recovery by membrane gas separation: retentate stream post-processing case study. . . 114
Introduction . . . 114
3.1 Membrane gas separation technology for CO2 capture. . . 117
3.2 Membrane fundamentals . . . 119
3.3 Tools for performance analysis of GS membrane unit . . . 122
3.4 Process design background . . . 124
3.5 Single stage membrane process design . . . 126
3.5.1 Single stage results . . . 129
3.6 Multi stage membrane process design . . . 132
3.6.1 Multi stage results . . . 134
3.7 Conclusion . . . 140
4 Integration of novel water gas shift catalyst in membrane . . . reactor: reaction investigation 146 Introduction . . . 146
4.1. Materials and methods . . . 149
4.1.1 Experimental apparatus . . . 149
4.1.2 Methodology and operating condition . . . 151
4.2 Results and Discussion . . . 154
4.2.1. Permeation measurements . . . 154
4.2.2. Reaction measurements . . . 155
4.3. Conclusion . . . 162
5 Chemical equilibrium analysis of membrane reactor for reaction involving H2 production: n-butane
dehydroisomerization case study . . .
167 . . . Introduction 167 Thermodynamics . . . 5.1 170 . . .
5 . . .
5.1.2 Thermodynamics of a membrane reactor 173 . . .
5.2 Results and discussion 177
. . .
5.2.1 Temperature effect 177
. . .
5.2.2 Pressure effect 178
Comparison of MR and TR at equilibrium condition . . .
5.3 181
. . .
5.4 Conclusion 183
6
In the H2 production field, the membrane reactor (MR) technology is
considered a promising and interesting technology. In this thesis work the integration in a small scale hydrogen generator of an MR, to carry out the water gas shift reaction (WGS), has been studied. In particular, the effect of MR integration from a systems perspective, i.e. specifically assessing the impact of MR on the whole process, has been investigated. A preliminary design of a pilot scale MR to produced 5 Nm3/h of H2 by reformate stream
upgrading has been performed. A CO conversion of 95% and an hydrogen recovery yield of 90% have been fixed as minimum performance target of the WGS-MR. Depending on the system considered to promote the driving force for the permeation, three scenarios have been proposed: base, vacuum and sweep scenario. On the basis of results from a preliminary scenario screening, the required membrane area (ca. 0.179 m2), for vacuum and sweep scenarios,
has been estimated by means of an MR modelling and simulation. The results obtained from the pilot scale have been used for the scale-up of the WGS-MR integrated in the 100 Nm3/h hydrogen production unit. The plant for the
integrated process (reformer and WGS-MR) has been simulated by using the commercial simulation tool Aspen Plus®.
The MR integration, actually, implies a re-design of the process downstream the WGS reactor. Since more than 90% of the produced H2 is directly
recovered in the permeate stream, the PSA unit can be removed, leading to a more compact system. For the retentate stream post processing, the possibility to recover the CO2, by means of membrane gas separation
technology has been proposed. The results for a two stages membrane separation unit confirmed the technological feasibility of the CO2 capture,
achieving the CO2 purity target.
Pursuing the logic of process intensification, the comparison with the reference technology (reformer, high temperature shift, PSA) showed as the WGS-MR integrated system results in a more “intensified” process since a higher H2 productivity, a smaller plant and an enhanced exploitation of raw
materials are obtained. In addition, since the MR delivers a high-pressure CO2-rich stream, it provides an opportunity for small-scale CO2 capture and
thus possible emission reduction.
The possibility to extend the spectrum of MR application in reactions of industrial interest, where hydrogen is produced as by-product, has been also studied. In particular, as case study, the direct conversion of n-butane to isobutene has been analysed, showing as, from a thermodynamic point of view, better performance (equilibrium conversion up to seven times higher than the one of a traditional reactor) can be obtained.
7
Abstract
Nel campo della produzione di H2, quella dei reattori a membrana (MR) è
considerata una tecnologia promettente e interessante. In questo lavoro di tesi si è studiata l'integrazione all’interno di un generatore di idrogeno su piccola scala (100 Nm3/h di H2) di un reattore a membrane, usato per
condurre la reazione di water gas shift (WGS). In particolare è stato studiato l'effetto dell’integrazione del MR dal punto di vista dell’intero processo, valutando cioè l'impatto e le ricadute dell’integrazione su tutto il processo. È stata effettuata prima la progettazione del reattore a membrana su scala pilota, per la produzione di 5 Nm3/h di H2. Una conversione di CO del 95% ed
un recupero di idrogeno del 90% sono stati fissati come valori minimi delle prestazioni del WGS-MR.
A seconda del sistema considerato per promuovere la forza spingente per la permeazione, sono stati proposti tre scenari: base, vacuum and sweep. Sulla base dei risultati ottenuti da uno screening preliminare sugli scenari, per quello vacuum e quello sweep si è proceduto alla valutazione della superficie di membrana richiesta (pari a ca. 0.18 m2) mediante la modellazione e
simulazione del MR. I risultati di simulazione ottenuti su scala pilota sono stati utilizzati per lo scale-up del WGS-MR per la produzione di 100 Nm3/h di
idrogeno.
L'impianto per il processo integrato (reformer e WGS-MR) è stato simulato usando come software di simulatione l’ AspenPlus®. L'integrazione del
reattore a membrana implica in pratica, una ri-progettazione del processo a valle del reattore stesso. Poiché più del 90% dell’ H2 prodotto è recuperato
direttamente nella corrente di permeato, l’unità per la purificazione dell’idrogeno può essere rimossa, ottenendo di conseguenza un sistema più compatto. Per il post-processing della corrente di retentato è stata proposta e analizzata la possibilità di recuperare la CO2, per mezzo di tecnologie a
membrana per separazione gassose. I risultati ottenuti con un sistema costituito da due unità di separazione a membrana hanno confermato la fattibilità tecnologica della cattura della CO2, consentendo di raggiungere il
target sulla purezza della CO2 recuperata.
Perseguendo la logica definita dalla “Process intensification”, il confronto con la tecnologia di riferimento (reforming, shift ad alta temperatura, PSA) ha mostrato come il sistema integrato con il WGS-MR risulti in un processo più "intensificato" poiché si ottengono una maggiore produttività di idrogeno, un impianto più piccolo e una migliore sfruttamento delle materie prime. Inoltre, poiché in uscita dal reattore a membrana si ottiene una corrente di retentato compressa e ricca in CO2, ciò offre la possibilità di catturare anche su piccola
scala la CO2, e perciò una possibile riduzione delle emissioni.
è stato inoltre oggetto di studio la possibilità di estendere lo spettro di applicazione dei reattori a membrana in reazioni di interesse industriale, in cui si produce idrogeno come sottoprodotto. In particolare, come caso di studio, è stata analizzata la conversione diretta di n-butano ad isobutene, mostrando come possano essere ottenute, da un punto di vista termodinamico, migliori prestazioni, con conversione all'equilibrio fino a sette volte superiore a quella di un reattore tradizionale.
8
The idea developed in the following thesis is based on the study of membrane reactor (MR) integration to produce hydrogen in a more efficient way, following the process intensification strategy. The attention has been addressed toward hydrogen production since the hydrogen, as a potential energy carrier, will play a very important role in future energy systems. For this reason many companies and academic institutions are focusing their efforts in trying to improve the H2 production process. This is also the subject
of several research projects, such as the European project DEMCAMER (Design and Manufacturing of Catalytic Membrane Reactors by developing new nano-architectured catalytic and selective membrane materials) under which this thesis has been developed. In the H2 production field, the
membrane reactor (MR) technology is considered a promising and interesting technology. MR systems, to carry out some typical reactions for hydrogen production (e.g., reforming, water gas shift), have been extensively investigated in the open literature, proving MR capability in improving conversion, yield and selectivity. Most of these studies, however, have been mainly focused on the enhanced achievable MR performance, at experimental and theoretical level. The effect of MR integration from a systems perspective, i.e. specifically assessing the impact of MR on the whole process, has been poorly investigated.
The focus of this research work has been therefore addressed to deeper investigate and quantify the benefits of WGS-MR integration into small-scale H2 production, since the MR technology could be a good candidate in
distributed hydrogen production. The main objective of this work was to re-design the traditional hydrogen production process in a more compact and efficient way, by means of membrane technology application.
In the global re-design of process scheme, the opportunity of possible cheaper small-scale CO2 separation, by means of membrane gas separation
9
The integration of a novel WGS catalyst, developed by DEMCAMER partner project, with a commercial Pd-base membrane has been also studied from an experimental point of view.
The possibility to extend the spectrum of MR application in reactions of industrial interest, where hydrogen is produced as by-product, has been also studied; the direct conversion of n-butane to isobutene, by dehydroisomerization reaction, has been analysed as case study.
The applied methodology and structure of the work are as follows:
i. Design of a pilot scale WGS-MR to produce H2 by reformate stream
upgrading: selection of suitable configurations, modelling of MR configurations, definition of operating conditions and MR design (chapter 1).
ii. Scale up of the WGS-MR, as defined in i., integration of the WGS-MR in small scale H2 generator (100 Nm3/h H2) and process plant
simulation. Comparison between selected scenarios and comparison with conventional technology (chapter 2).
iii. Post processing of WGS-MR retentate stream by membrane gas separation technology application for CO2 recovery (chapter 3).
iv. Experimental reaction investigation on a novel WGS catalyst integrated in a membrane reactor (chapter 4).
v. Analysis of the potentiality of MR integration in process involving H2
production (chapter 5). vi. Overall conclusions. .
10
Introduction
The water-gas shift (WGS) reaction (Eq. 1) is a well-known step for upgrading carbon monoxide to hydrogen: the CO content, present in the syngas mixtures, is reduced by steam, producing more hydrogen.
H2O+CO ↔ CO2+ H2 ∆HRX, 298 K = -41 kJ/mol
Eq. 1 The WGS is an exothermic equilibrium-limited reaction characterized by no variation of mole number. From a thermodynamic point of view the equilibrium conversion is favoured at lower temperatures and it is not affected by the pressure.
Reported for the first time in literature by the end of the 19th century, the WGS reaction found initial industrial application in the production of synthesis gas from coal and coke. The gas shift reaction was commonly performed at temperatures around 450-600 °C, using iron oxide catalyst [1] in a single stage. The introduction of a second stage operating at lower temperature, by means of Cu-based low-temperature (LT) shift catalysts, allows the reduction of CO content to less than 0.5%. The integration of the WGS reaction was dependent on the origin of the synthesis gas, principally coal at the time of its first industrial applications. With the increasing industrial demand for hydrogen, new production processes based on hydrocarbons reforming have been investigated. In particular, fuel processing of natural gas is the most common hydrogen production method in commercial use today.
11
In a typical industrial operation, Ni-based catalysts are primarily used for the steam reforming of natural gas at high temperatures (>700 °C) using high steam to carbon ratios (S/C), at least 3-5. Then, the cooled gas from the reformer is fed into a high temperature (HT) CO-shift converter, commonly in the temperature range of 320-360 °C and at a total pressure between 10 and 60 bar, containing a Fe-based oxide catalyst [2]. Depending on the feedstock and the performance of the HT CO-shift reactor, an outlet stream with a CO concentration between 1 and 5% is typically obtained at a temperature around 400-450 °C. The stream is then cooled by thermal quenching with water or by an inter-cooler system between stages. In some operations, water is injected between the stages to adjust the S/C ratio before entering into a low temperature CO-shift reactor, operating in the range of 190-250 °C. A CO concentration less than 0.5% is usually obtained in the outlet stream from the low temperature shift [3].
Moving from the initial WGS industrial application to the current shift process, many aspects related to the catalysts, reaction mechanisms and kinetics has been investigated. In most recent times, the growing H2 demand
(for instance high purity hydrogen stream used in polymeric electrolyte membrane (PEM) fuel cells) has brought in a new dimension the WGS process role [4]. For the production of high-purity H2 stream the advantages
offered by membrane reactor technology applications have been clearly shown and proved in the literature [5, 6, 7].
Fundamentally, a membrane reactor is a system where reaction and separation are performed in the same unit by means of a permselective membrane that allows the selective removal of some products from the reaction volume. In the field of hydrogen production, the application of a membrane reactor to carry out WGS reaction has been extensively investigated by several research groups [5, 8, 9, 10, 11, 12, 13]. These studies showed as the removal of hydrogen from the reaction side allows to shift the reaction toward further CO conversion and to recover, in dependence on the membrane used, a rich/pure H2 stream in the permeate side. In most of the
12
have been tested [11]. Recently, studies using CO2 selective membranes have
also appeared in literature [14, 15]. In these studies the possibility of using a CO2 selective membrane to enhance the CO conversion and to increase the H2
purity on the high pressure side of the membrane reactor has been investigated. In addition to experimental studies, the modelling and simulation of membrane reactors has been also largely studied. The relevant literature concerning membrane reactors models is wide; thus we will mention here some selected examples only. MR models are described in the literature with various level of complexity: one [11, 17, 18, 19] or two-dimensional models [20, 21], in steady-state or transient condition. Regarding the configuration, the tube and shell reactor configuration is the most used. Some models assume isothermal MR operation while others include heat balances, allowing to simulate non-isothermal or adiabatic operation. The majority of the papers on Pd-alloy MR modelling refers to tubular plug-flow MRs for steady-state operations. Barbieri and Di Maio [22] proposed a non-isothermal steady-state model of a plug-flow tubular MR for the methane steam reforming (MSR) reaction in co-current and counter-current mode, studying in particular, the configuration effects. Basile et al. [23] proposed 1D steady-state model for the partial oxidation of methane, water gas shift and MSR in dense Pd MR. Using a 1D isothermal model Harold et al. [24] simulated a packed-bed annular MR for the methanol decomposition, methanol steam reforming, and methanol partial oxidation.
From a more general point of view there are many studies on small scale membrane reactor systems to carry out reactions of industrial interest such as reforming, water gas shift, dehydrogenation of hydrocarbons, proving the capability of MRs in improving conversion, yield and selectivity [25]. This is the scenario where the DEMCAMER project [26] is set in, aiming to develop innovative multifunctional catalytic membrane reactors based on novel catalysts and selective membranes to improve their performance, durability, cost effectiveness and sustainability over four selected chemical processes (Autothermal Reforming (ATR), Fischer-Tropsch Synthesis (FTS), Water Gas
13
Shift (WGS), and Oxidative Coupling of Methane (OCM) for pure hydrogen, liquid hydrocarbons and ethylene production.
The activity described in the following, performed in the framework of DEMCAMER project, has been addressed to design a pilot scale MR to carry out the water gas shift reaction, producing 5 Nm3/h of hydrogen. The results,
obtained from the pilot scale design, have been used as input in the analysis of this novel reactor integrated into a small scale natural gas reforming system for H2 production (presented in chapter 2).
1.1
Pilot scale definition
The size for the pilot scale WGS membrane reactor has been defined following the target specified in the framework of the DEMCAMER project. A hydrogen production of 5 Nm3/h, with a minimum purity of 99.99 %, has been fixed.
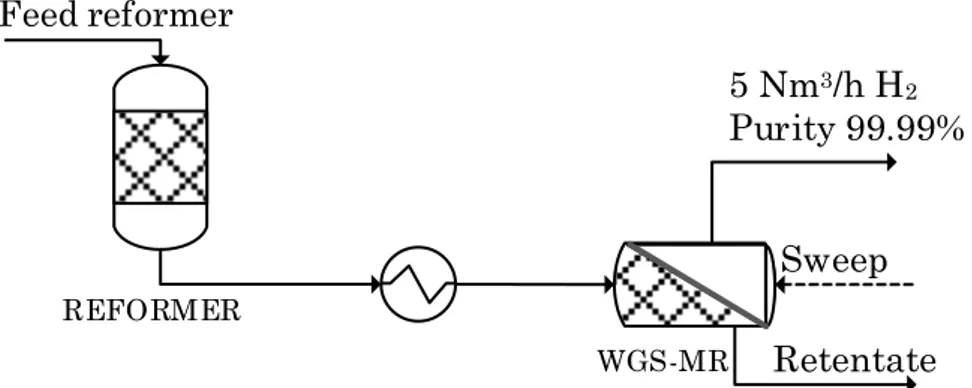
Moreover, the integration of WGS-MR has been associated downstream to a hydrocarbon reformer unit. Figure 1 shows a scheme of the considered system. The feed composition for the membrane reactor has been defined on the basis of the typical composition of a stream coming out from a natural gas steam reformer. The composition is reported in Table 1. On the basis of the water molar fraction presents in the reformer outlet stream, the steam to CO ratio is equal to 3.7. Being the typical steam to carbon ratio for the shift reaction in the range 3-5 [27], no further adjustment to the steam amount has been considered. Moreover, as reported in the literature, a membrane reactor due to the equilibrium shift effect, consequence of the hydrogen extraction, can operate at lower steam to carbon ratio with respect to the traditional reactor.
14
Figure 1 Scheme of the downstream integrated WGS – MR associated to a hydrocarbon reformer unit.
In a conventional H2 production process by steam methane reforming the
syngas stream coming out from the reformer is fed to a shift reactor to convert the remaining CO and then sent to a hydrogen purification unit, usually a pressure swing adsorption unit (PSA).
The aim of the WGS membrane reactor integration in H2 production plant is
to substitute the traditional shift reactor and hydrogen separation system with one single unit able to convert the CO present in the reformate stream and to recover directly the produced hydrogen. As a consequence, a minimum H2 recovery yield value of 90% has been fixed as target value. The H2
recovery yield is defined as the amount of hydrogen recovered in the permeate side with respect to the maximum hydrogen producible, that is the sum of hydrogen and carbon monoxide in the MR feed stream (Eq. 2)
Hydrogen recovery yield = H2 RY =H2 recovered in the permeate side Maximum H
2 producible
Eq. 2 A minimum CO conversion target, higher than 95%, has been also set in the framework of the project.
REFORMER Feed reformer WGS-MR Sweep Retentate 5 Nm3/h H2 Purity 99.99%
15
Table 1 Feed molar fraction composition of WGS-MR Molar fraction composition, -
H2 H2O CO CO2 CH4 N2
0.448 0.347 0.092 0.047 0.038 0.028
1.2 Case studies identification
The starting point for the pilot scale WGS-MR design was the identification of possible scenarios, in term of operating pressures and flow configuration. As previously introduced, a membrane reactor is a system having a permselective membrane that divides the reactor in a reaction side, where the reaction happens, and a permeation side, where the selectively removed products are recovered. The selective removal of products from the reaction volume by means of the permselective membrane occurs under the effect of a driving force that is a function of the partial pressures of the species on the reaction and permeate sides. In particular, it can be created by means of an inert sweep gas in the permeate compartment (nitrogen, water, etc.), or with the application of a pressure difference between the retentate and the permeate compartments or by their combination. Depending on the system considered to promote the driving force for the permeation three scenarios have been selected for the pilot scale WGS-MR:
a base scenario a vacuum scenario a sweep scenario.
The base scenario is the simplest one: in the reaction side the membrane reactor operates at the same pressure of the reformer unit upstream, and, in the permeation side, a pressure slightly above the atmospheric pressure value, ca. 1.2 bara, has been chosen. For the vacuum scenario the possibility
to reduce the pressure on the permeation side, applying a vacuum pump, is proposed. As already mentioned, by decreasing the permeate pressure, the
16
driving force for the permeation increases. An other strategy to improve the permeation by reducing the hydrogen partial pressure on the permeation side by feeding a sweep gas, usually steam, is proposed in the sweep scenario. In this case, a dilute hydrogen stream is recovered in the permeate. For the sweep scenario the flow configuration has t be also defined. The sweep gas can be fed in co-current with the reformate feed or in counter current. The configurations are similar to the ones in the heat exchangers. The benefits of counter current configuration are well known [13, 28]; it is more efficient since allows a better exploitation of the membrane area. Several case studies have been selected within the described scenarios. They are reported in Table 2. For the base scenario, only one case study has been defined, assuming, as described above, to operate at 1.2 bara in the permeate side and at the same
pressure of the reformer in the retentate side. A pressure value of 7 bara, has
been considered, since this value was fixed in the framework of the project on the basis of operating constrains for the pilot scale MR testing.
In the sweep scenario the retentate and permeate pressures are the same of the base scenario; however, the presence of a sweep stream introduces an additional degree of freedom. It is usually saturated fixing the sweep factor defined for a closed MR as the ratio of the mole number of the sweep gas to the mole number of the reference component, both evaluated at the starting time [16]. In this analysis, since we was interested to perform a preliminary screening of the defined case studies on the basis of the maximum performance achievable at equilibrium condition (see next paragraph), the additional degree of freedom for the sweep scenario was saturated by fixing the equilibrium sweep molar fraction. It represents the ratio between the molar flow rate of sweep gas fed in the permeate side and the total permeate stream molar flow rate at equilibrium condition. Fixing the equilibrium sweep fraction corresponds to fix the equilibrium hydrogen partial pressure, as expressed in Eq. 3:
phydrogenEquilibrium = yhydrogenEquilibrium pPermeate side = (1 − y
sweep ) pPermeate side
17
As far as the vacuum scenario concerns, two value of vacuum pressure has been considered (case study 5 and 6).
Table 2 MR operating condition: case studies specifics
Scenario Case study
Feed/retentate Permeate H2 equilibrium partial pressure, bara Equilibrium sweep molar fraction Pressure, bara Base 1 7 1.20 1.20 - Sweep 2 7 1.20 0.96 0.2 3 0.60 0.5 4 0.24 0.8 Vacuum 5 7 0.50 0.50 - 6 0.25 0.25 -
A scheme of the analysed scenarios is shown in Figure 2.
Figure 2 Schemes of the analysed scenarios. Permeate Retentate Permeate Retentate Sweep Permeate Retentate Sweep MR MR MR
Base scenario Sweep scenario
Co-current Counter-current Feed MR Feed MR Feed MR Retentate Vacuum pump Permeate MR Vacuum scenario Feed MR
18
1.3 Screening case studies
A preliminary screening of the case studies has been performed to evaluate the maximum achievable CO conversion and hydrogen recovery. On the basis of operating condition defined for each case study, a thermodynamic equilibrium calculation for a membrane reactor has been done. Thermodynamic analysis of an MR is similar to that of a traditional reactor. A membrane reactor can be considered as composed by two sections: reaction and permeation volume. In an equilibrium membrane reactor system both sections are kept closed at a constant pressure and only some specific gases can be transported between the two volumes. In this case, the hydrogen selective membrane allows the removal of the hydrogen from the reaction volume. A part of the produced hydrogen permeates through the membrane into the permeation side. As long as the hydrogen partial pressure in the reaction volume is higher than the partial pressure in the permeate side, there is permeating flux. When the partial pressures of hydrogen, on both membrane sides, are equal, no hydrogen permeation happens, and then permeative equilibrium is reached [29, 30]. In the permeative equilibrium state, the partial pressure of hydrogen on both membrane sides is also equal to the partial pressure of hydrogen at equilibrium; this condition is expressed by Eq. 4. Therefore, the thermodynamic equilibrium in an MR also depends on the permeative equilibrium in addition to the reactive equilibrium.
p hydrogenEquilibirum = phydrogenPermeate side = p
hydrogen Reaction side
Eq. 4
Table 3 summarizes the mass balance for the species involved in the shift reaction, also including the information for hydrogen permeation through the variable “z”, which is the fraction of hydrogen in the permeation side compared to the total hydrogen produced. Therefore, the number of moles of each species at equilibrium, reactive and permeative, is a function of the reaction conversion degree (xeq) and the hydrogen fraction permeated (z). In
19
balance to determine the maximum conversion, that can be achieved in a exothermic reaction carried out adiabatically [31]. The adiabatic temperature and equilibrium composition of the MR is thus calculated through the material and energy balances also including the constraint, introduced by Eq. 4, for the permeative equilibrium state. Table 4 reports the mathematical set of equations to be solved, with feed temperature and composition, reaction pressure and hydrogen equilibrium partial pressure as input values.
20
Table 3 Molar balance to calculate the equilibrium composition in a membrane reactor
moles CO H2O CO2 H2
Initial state nCO nH2O nCO2 nH2
Reactive State - nCOxeq -nCOxeq +nCOxeq +nCOxeq Permeation State - - - (nH2+nCOxeq) z Permeative and Reactive Equilibrium State nCO (1-xeq) (nH2O-nCOxeq) (nCO2+nCOxeq) (nH2+nCOxeq)(1-z)
Total moles number on reaction side ntotalReaction side = ntot,feed − (nH2+nCOxeq) z
Total moles number on permeation side ntotalPermeation side = nsweep + (nH2+nCOxeq) z
21
Table 4 Set of equations for equilibrium conversion and H2 recovery
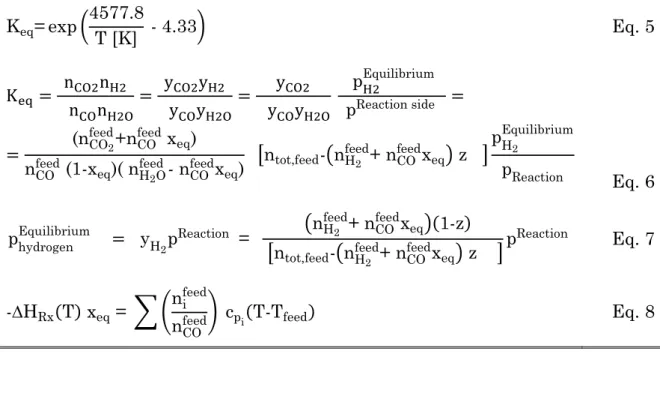
calculation Keq= exp (4577.8 T [K] - 4.33) Eq. 5 Keq = nCO2nH2 nCOnH2O = yCO2yH2 yCOyH2O = yCO2 yCOyH2O pH2Equilibrium pReaction side = = (nCO2 feed+n CO feed x eq) nCOfeed (1-x eq)( nH2O feed - n CO feedx eq) [ntot,feed-(nH2 feed+ n CO feedx eq) z ] pH 2 Equilibrium pReaction Eq. 6 phydrogenEquilibrium = yH 2p Reaction = (nH2 feed+ n CO feedx eq)(1-z) [ntot,feed-(nH2 feed+ n CO feedx eq) z ] pReaction Eq. 7 -∆HRx(T) xeq = ∑ (ni feed
nCOfeed) cpi(T-Tfeed) Eq. 8
Figure 3 CO equilibrium conversion and H2 Recovery Yield as a function of
MR feed temperature.
For the case study 1 (base scenario) the membrane reactor equilibrium composition has been evaluated, at different feed temperatures (see Figure 3). Due to the exothermicity of the reaction, the CO conversion decreases
22
increasing the temperature. At low temperature, feed temperature less than 370°C, the target conversion is exceeded. On the other hand, the hydrogen recovery is lower than the target value in the whole temperature range investigated. The results show therefore as the operating conditions for base scenario are not suitable, because target value of the hydrogen recovery can not be obtained, even at equilibrium condition. Analogous analysis has been done for the other case studies. Conversion and H2 recovery yield at
equilibrium condition for all case studies are reported in Table 5, considering a feed temperature of 330°C. The results show as the maximum CO conversion achievable is higher than the target value for all case studies. The main constrain is related to the hydrogen recovery. It can not be reached for case study 1 (pFeed = 7 bar, p
hydrogen
Equilibrium = 1.2 bar) and case study 4 (pFeed = 7
bar, phydrogenEquilibrium = 0.96 bar). The result for case study 4 requires however a more detailed analysis. As previously described, for the sweep scenario two configurations can be used: co-current and counter-current configurations. Since they are flow configurations, from a thermodynamic point of view, they should not affect the performance at equilibrium conditions. Nevertheless, the approach used to describe the equilibrium of a membrane reactor is valid only for a co-current configuration. In fact, in a counter-current configuration with an infinite membrane area, theoretically all the carbon monoxide can be converted and all the hydrogen recovered.
From the preliminary screening, only the base scenario can be excluded from the further analysis, being the target values surely not reachable.
23
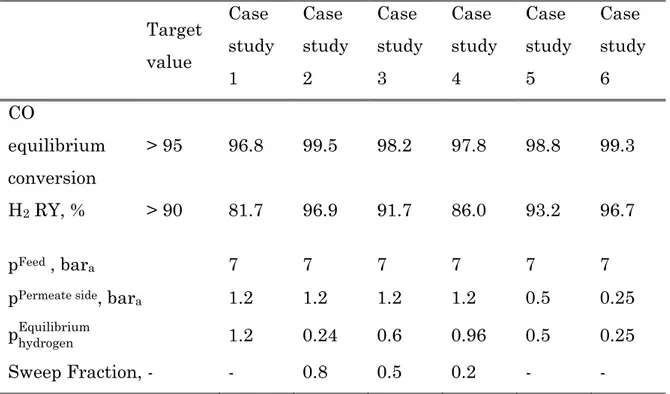
Table 5 Summary results of an adiabatic equilibrium membrane reactor for the different case studies
Target value Case study 1 Case study 2 Case study 3 Case study 4 Case study 5 Case study 6 CO equilibrium conversion > 95 96.8 99.5 98.2 97.8 98.8 99.3 H2 RY, % > 90 81.7 96.9 91.7 86.0 93.2 96.7 pFeed , bara 7 7 7 7 7 7
pPermeate side, bara 1.2 1.2 1.2 1.2 0.5 0.25
phydrogenEquilibrium 1.2 0.24 0.6 0.96 0.5 0.25
Sweep Fraction, - - 0.8 0.5 0.2 - -
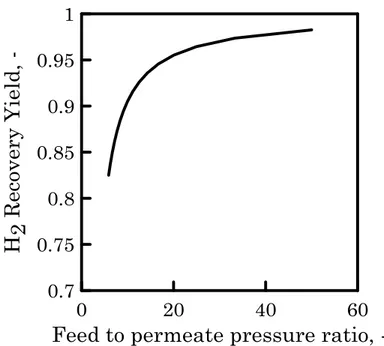
However, to analyse the possible benefit to operate at a higher feed pressure, the minimum feed to permeate pressure ratio required to reach the conversion and recovery target values has been evaluated. In a membrane reactor, operating as an extractor with no sweep stream, the pressure ratio is, in fact, one of the most important and significant parameters affecting the performance of the membrane unit. It provides an indication about the driving force for the permeation and about the maximum extraction achieved by the membrane unit. As shown in Figure 4, the minimum pressure ratio to obtain an H2 recovery yield of 90% is 17. Therefore for the base scenario,
where no vacuum is applied and the minimum operating permeate pressure is 1.2 bara, the required feed pressure is higher than 20 bara. The possibility
to consider a case study with this feed pressure value has been excluded, since this pressure value is quite higher then the one defined as reference value for the pilot scale reactor (feed pressure of 7 bara). A summary of the
24
Figure 4 H2 Recovery Yield as a function of feed to permeate pressure ratio
25
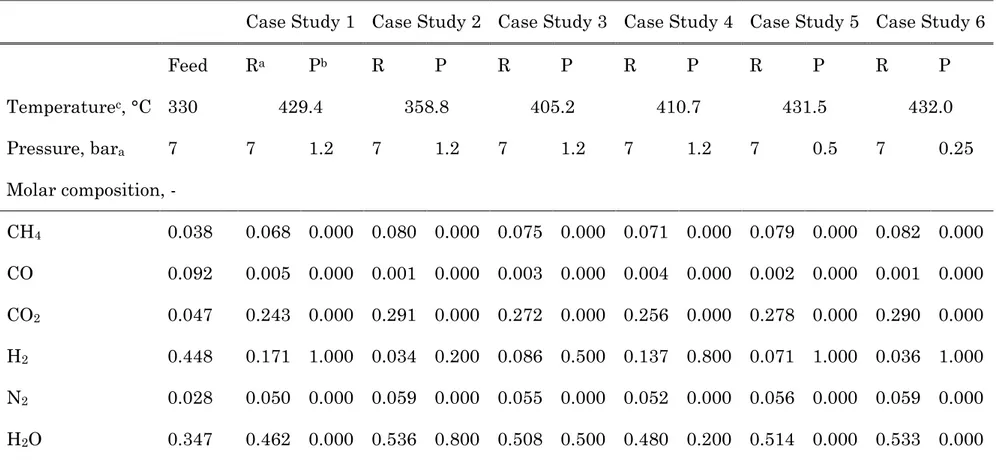
Table 6 Summary of the equilibrium molar compositions for all case studies
Case Study 1 Case Study 2 Case Study 3 Case Study 4 Case Study 5 Case Study 6
Feed Ra Pb R P R P R P R P R P Temperaturec, °C 330 429.4 358.8 405.2 410.7 431.5 432.0 Pressure, bara 7 7 1.2 7 1.2 7 1.2 7 1.2 7 0.5 7 0.25 Molar composition, - CH4 0.038 0.068 0.000 0.080 0.000 0.075 0.000 0.071 0.000 0.079 0.000 0.082 0.000 CO 0.092 0.005 0.000 0.001 0.000 0.003 0.000 0.004 0.000 0.002 0.000 0.001 0.000 CO2 0.047 0.243 0.000 0.291 0.000 0.272 0.000 0.256 0.000 0.278 0.000 0.290 0.000 H2 0.448 0.171 1.000 0.034 0.200 0.086 0.500 0.137 0.800 0.071 1.000 0.036 1.000 N2 0.028 0.050 0.000 0.059 0.000 0.055 0.000 0.052 0.000 0.056 0.000 0.059 0.000 H2O 0.347 0.462 0.000 0.536 0.800 0.508 0.500 0.480 0.200 0.514 0.000 0.533 0.000
26
1.4 Preliminary estimation of membrane area
On the basis of the accomplished screening, a preliminary estimation of the membrane area required to obtain the hydrogen production target of 5 Nm3/h
has been done. Theoretically, the flux of hydrogen diffusing through an infinite hydrogen selective membrane is given by:
JH2= dFH2 dAMembrane=
PermeabilityH 2
Thickness Driving force
Eq. 9 In Pd-based membranes, hydrogen atoms permeate through the membrane by a solution–diffusion mechanism; the permeating flux can be expressed by Sieverts law (Eq. 10) when the rate determining step is the diffusion through the membrane: JH2= PermeabilityH 2 Thickness (√pH2 Retentate side(z) -√p H2 Permeate side(z)) Eq. 10 The hydrogen amount permeated through a given membrane area can be thus determined by integrating Eq. 10 along the membrane surface. The hydrogen partial pressure profile, in retentate and permeate side, are required to integrate the equation. Alternatively, the average hydrogen flow through the membrane can be very accurately estimated (Eq. 11) defining the driving force by means of logarithmic mean driving force equation [32] (LMDF, Eq. 12).
H2average flow rate on permeation side = Permeability H2 thickness A Membrane LMDF Eq. 11 LMDF = DFinlet- DFoutlet ln (DFinlet DFoutlet) Eq. 12 Where DFinlet is the inlet (feed) driving force and DFoutlet is the output
27
DFinlet= (√pHRetentate side2 |
inlet- √pH2
Permeate side| inlet
)
Eq. 13 DFoutlet= (√pHRetentate side2 |
outlet- √pH2
Permeate side| outlet
)
Eq. 14 By means of Eq. 11 the membrane area can be thus expressed as:
AMembrane= H2molar flow rate on permeation side PermeanceH2 LMDF Eq. 15 where PermeanceH2 =Permeability H2 thickness Eq. 16 Hence, for the different case studies, the membrane area has been estimated by means of Eq. 15. In particular, the mass and energy balances on the membrane reactor have been solved for fixed H2 recovery yield values (RYH2,
see Eq. 2). The retentate and permeate composition have been evaluated assuming that the reactor approaches the equilibrium composition (Eq. 5 and Eq. 17). Keq = nCO2nH2 nCOnH2O = = (nCO2 Feed+n CO Feedx eq) nCOFeed (1-x eq)( nH2O Feed - n CO Feedx eq) [(nHFeed2 + n CO Feedx eq) - H2RY (nH2 Feed+ n CO Feedx eq) ] Eq. 17 The following equation represents the energy balance on the membrane reactor:
28 = 𝐹𝐹𝑒𝑒𝑑[𝐶 𝑃 ̅̅̅ 𝐹𝑒𝑒𝑑(𝑇𝐹𝑒𝑒𝑑− 𝑇𝑟𝑖𝑓) + ∑ 𝑦𝑖𝐹𝑒𝑒𝑑∆𝐻𝑖,𝑓0 ] + 𝐹𝑆𝑤𝑒𝑒𝑝[𝐶 𝑃 ̅̅̅ 𝑆𝑤𝑒𝑒𝑝(𝑇𝑆𝑤𝑒𝑒𝑝− 𝑇𝑟𝑖𝑓) + ∑ 𝑦𝑖𝑆𝑤𝑒𝑒𝑝∆𝐻𝑖,𝑓0 ] − 𝐹𝑃𝑒𝑟𝑚𝑒𝑎𝑡𝑒[𝐶 𝑃 ̅̅̅ 𝑃𝑒𝑟𝑚𝑒𝑎𝑡𝑒(𝑇𝑃𝑒𝑟𝑚𝑒𝑎𝑡𝑒− 𝑇𝑟𝑖𝑓) + ∑ 𝑦𝑖𝑃𝑒𝑟𝑚𝑒𝑎𝑡𝑒∆𝐻𝑖,𝑓0 ] − 𝐹𝑅𝑒𝑡𝑒𝑛𝑡𝑎𝑡𝑒[𝐶 𝑃 ̅̅̅ 𝑅𝑒𝑡𝑒𝑛𝑡𝑎𝑡𝑒(𝑇𝑅𝑒𝑡𝑒𝑛𝑡𝑎𝑡𝑒 − 𝑇𝑟𝑖𝑓) + ∑ 𝑦𝑖𝑅𝑒𝑡𝑒𝑛𝑡𝑎𝑡𝑒∆𝐻𝑖,𝑓0 ] = 0 Eq. 18 The energy balance has been solved for feed temperatures on retentate and permeate side (TFeed and TSweep) equal to 330 °C. Moreover, the outlet
temperature of the permeate stream (TPermeate) has been assumed equal to the
outlet temperature of the retentate stream (TRetentate), for all case studies (Eq.
19).
𝑇Permeate= 𝑇Retentate
Eq. 19 A hydrogen permeance value of 0.18 Nm3/ m2 h Pa0.5 has been considered,
being this value defined as a target for the membranes developed in the framework of the DEMCAMER project.
The driving force has been calculated using the logarithmic mean driving force equation, described above. For the sweep scenario, in analogy to the heat exchanger, the driving force for a co-current and counter-current configuration has been expressed respectively as:
∆p|Co-current=
(√pH2Feed− √pH2Sweep) − (√pH2Retentate− √pH2Permeate)
ln √pH2 Feed− √p H2 Sweep √pH2Retentate− √p H2 Permeate Eq. 20 ∆p|Counter-current =
(√pH2Feed− √pH2Permeate) − (√pH2Retentate− √pH2Sweep)
ln √pH2 Feed− √p H2 Permeate √pH2Retentate− √p H2 Sweep Eq. 21
29
The membrane area required for different hydrogen recovery yield values, for all the case studies, is reported in Table 7. It was assumed to feed 10.3 Nm3/h
of a reformate stream gas, with a composition as defined in Table 1, and a feed temperature of 330 °C. The value of feed flow rate has been defined considering the feed required to obtain the H2 production target, 5 Nm3/h,
with an MR H2 recovery yield of 90%.
Feed flow rate = H2 production target H2 recovery yield target (xH2feed+x
CO feed) =
5 Nm3⁄h 0.90 (0.448 + 0.092)
Eq. 22 A comparison of the membrane area required for the different case studies is presented in Figure 5 - Figure 8. The base scenario needs the highest membrane surface (Figure 5); for an H2 recovery yield of 80% a membrane
area three times larger than the one for vacuum scenario, operating at 0.5 bar, is required. Looking at the performance with vacuum scenario, as expected, operating at lower pressure smaller membrane area are required to rich the hydrogen recovery target: 0.2 m2 and 0.125 m2 at 0.5 and 0.25 bar,
respectively.
Figure 5 Required membrane area as a function of H2 recovery yield for base
30
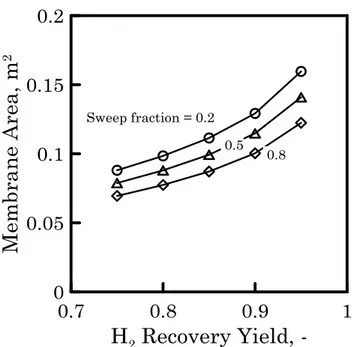
For the sweep scenario, Figure 6 shows a reduction of membrane surface when the sweep fraction increases. In addition, for high H2 RY, the difference
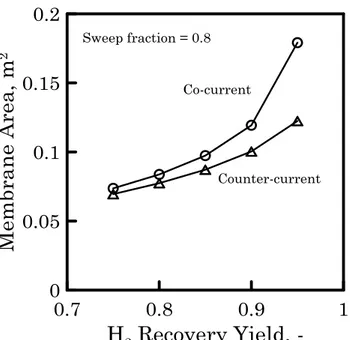
between the membrane area values of each case study increases. The same behaviour is shown in Figure 7 where, for a sweep fraction of 0.8, the co-current and counter-co-current configuration are compared. At low recovery value, vacuum and sweep scenario require quite similar membrane surface. However, comparing both scenario at higher hydrogen recovery (see Figure 8) the difference in term of required membrane area increases, showing as H2
RY > 95 % can be reached only operating with sweep scenario.
Figure 6 Required membrane area as a function of H2 recovery yield at
different sweep fraction (case studies 2, 3 and 4). Sweep scenario, counter-current configuration.
31
Figure 7 Required membrane area as a function of H2 recovery yield with
co-current (dots) and counter-co-current (triangles) configuration. Sweep scenario, sweep fraction 0.8 (case study 2).
Figure 8 Required membrane area as a function of H2 recovery yield for
sweep scenario (solid triangles, sweep fraction 0.8) and vacuum scenario (open dots).
32
Table 7 Membrane area [m2] required at fixed H2 recovery yield values
Base scenario Sweep scenario Vacuum scenario
H2 RY, % Case Study 1 Case Study 2 Case Study 3 Case Study 4 Case Study 5 Case Study 6
99 Not Reachable 0.356 0.430 0.512 Not Reachable Not Reachable 95 0.122 0.141 0.150 0.197 90 (Target) 0.100 0.115 0.129 0.198 0.125 85 0.087 0.099 0.111 0.139 0.100 80 0.380 0.077 0.088 0.098 0.113 0.085 75 0.218 0.069 0.079 0.088 0.096 0.075 50 0.085 0.041 0.046 0.051 0.051 0.042
33 On the basis of this preliminary screening it has been concluded that:
The base scenario is not suitable because the H2 recovery yield target
cannot be reached. (A reaction pressure higher than 20 bar should be applied and it is not feasible for the pilot scale reactor testing).
The vacuum and sweep scenarios both can meet the target requirements.
A minimum membrane area in the range of 0.1-0.2 m2, depending on
the considered scenario, should be required to produce and recover 5 Nm3/h of hydrogen, achieving the CO conversion and H2 recovery
targets.
To accomplish a complete design of the pilot scale WGS-MR and define the final operating condition a deeper analysis on membrane reactor performance is required. Thus, the modelling and simulation of the membrane reactor has been performed for both vacuum and sweep scenario, as following reported.
1.5
Modelling and simulation of WGS-MR
The general structure of a mathematical model of MR is based on momentum, mass, and energy balances, the same as that of traditional reactors but for an MR these equations are written for the reaction and permeate volumes. The local velocity field can be considered known/assigned in most cases. The mass balance on the reaction side contains in addition to the other know terms, the one related to the ith permeating species through the membrane. In the mass balance for the permeate side, the same permeation term has to be considered with the opposite sign with respect to the reaction side. The permeating flux law depends on the permeation mechanism (solution-diffusion in dense or metallic membranes, viscous, or Knudsen flux in porous membranes, etc.). For Pd-based membranes, the only permeating species is the hydrogen (infinite membrane selectivity) and the permeating flux can be expressed, as above reported, with Sieverts law (see Eq. 10)
34 The majority of the Pd-alloy membrane reactor refers to tubular plug-flow MRs. Generally, a tubular MR is a tube-in-tube device in which the inner tube is a permselective membrane promoting the selective mass transfer of reactants/products between the reaction and permeation sides. On both sides, species compositions, temperature, and pressures change along the reactor length and radial direction; in addition, the permeation rate through the membrane changes along the reactor length. Therefore, in general, these systems must be described by partial differential equations (PDEs). However, a one-dimensional (1D) mathematical model provides satisfactory description of systems in which radial gradients can be neglected.
The WGS pilot scale membrane reactor has been modelled as a tubular packed bed membrane reactor implementing a one dimensional model for gas-phase reactions [16, 33]. We assumed to operate the reactor adiabatically. A tubes in tube configuration has been considered: the MR consists of an outer tube, the shell, and of N inner tubes, the Pd-alloy membranes; the catalyst is packed in the shell side (see Figure 9). The presented mathematical model is based on the following hypotheses, common to most of the models present in the open literature:
Axial dispersion and radial profiles negligible.
Assigned velocity field: plug flow on both membrane sides (only mass and energy balances will be considered).
Pseudo-homogeneous description of heterogeneous catalytic reactions. Pd-alloy membranes with ideal behaviour: infinite H2 selectivity.
H2 permeation diffusion-controlled: H2-permeating flux expressed by
Sieverts law.
Isobaric condition on the permeate side. Ideal gas mixtures behaviour.
35 Figure 9 Packed bed tubular membrane reactor scheme.
1.5.1 Mass balance
The mass balances on both membrane sides for a tubular MR is written for a differential reference volume, dV, of length dz (Figure 10). The mass balance equations for hydrogen (Eq. 24) and the other species (Eq. 23), on the reaction volume, are the following:
Figure 10 Control volume scheme of a tubular Pd membrane reactor.
− dFi Reaction side dz + 𝑣𝑖rWGS Sshell=0 for i ≠H2 Eq. 23 −dFH2 Reaction side dz + 𝑣H2rWGS Sshell − AMembrane LReactor JH2 Permeating=0 Eq. 24 where 𝑣𝑖 is the stoichiometric coefficient for species i. The boundary condition is expressed as follows:
Feed Permeate
Retentate Membrane tube
Catalytic packed bed
Feed Sweep Permeate z Permeation side Reaction side z+dz Control volume dV Retentate H2
36 FiReaction side|z=0=FiFeed
Eq. 25 In the mass balance the first term is the convective flux variation of the ith specie along the reactor length, the second term is the reaction and the third term is the gases permeation through the membrane. In the mass balance equation for the permeation side the terms are the same of Eq. 23 except for the reaction term, no more included. The term of the permeating flux through the membrane has a positive sign because in this case the H2 enters in the
permeation volume. Mass balances and boundary condition (B.C.) on the permeation side are given by following equations:
−dFi Permeate side dz =0 for i ≠H2 Eq. 26 − dFH2 Permeate side dz + AMembrane LReactor JH2 Permeating = 0 Eq. 27 FiPermeate side|z=0=0 Eq. 28 When the presence of a sweep stream is considered in the co-current configuration only the boundary condition changes (Eq. 29, Eq. 30).
FiPermeate side|z=0=0
Eq. 29 FSweepPermeate side|z=0= FSweepFeed
Eq. 30 For the counter-current tubular MR the model equations are the same of the co-current mode; the only difference is the sign of the term related to convective flux on the permeate side (Eq. 31). The B.C.s for this set of equations are defined at the two ends of the membrane module (Eq. 32 and Eq. 33). + dFH2 Permeate side dz + AMembrane LReactor JH2 Permeating=0 Eq. 31
37 FiPermeate side|z=L=0
Eq. 32 FSweepPermeate side|z=L= FSweepFeed
Eq. 33
1.5.2 Energy balance
The mass balance equations have to be solved simultaneously with the energy balances in order to describe the behaviour of the adiabatic MR. In fact, the energy transport and the temperature profiles developing along the reactor axis have a significant importance on the thermodynamics, the kinetics and the transport properties. The energy balance takes into account the heat production by chemical reaction, the heat exchanged with the permeation side and the convective flux of energy. Moreover, an additional term related to energy associated with the permeating flux is considered. The following equations represent the energy balance (Eq. 34 and Eq. 36) and boundary conditions (Eq. 35 and Eq. 37) for reaction and permeation sides, respectively.
rWGS(-∆HRX)Sshell+
AMembrane LReactor U
Membrane (TReaction side− TPermeate side)
−A Membrane LReactor JH2 Permeating ∆H H2 Permeating = ∑ FiReaction side Nspecies i=1 cpi 𝑑𝑇 Reaction side 𝑑𝑧 Eq. 34 TReaction side|z=0=TFeed
Eq. 35 +A
Membrane
LReactor U
Membrane (TReaction side − TPermeate side)
+A
Membrane
LReactor JH2Permeating ∆HH2Permeating
= ∑ FiPermeate sidecpi Nspecies i=1 dT Permeate side dz Eq. 36 TPermeate side|z=0=TFeed
38 When the presence of a sweep stream is considered, as described above for the mass balance, the boundary conditions on the permeation side have to be modified (Eq. 38) as
TPermeate side|z=0=𝑇SweepFeed
Eq. 38 When the counter-current mode is considered, the energy balance equation for the reaction side will be the same as the co-current mode, but for the permeate side the sign of convective heat flux changes (Eq. 39). Moreover, the B.C. for the permeate side is defined at the other extremity of the MR (Eq. 40).
AMembrane
LReactor U
Membrane (TReaction side − TPermeate side) +
AMembrane
LReactor JH2
Permeating ∆H H2
Permeating
= − ∑NspeciesFiPermeate sidecpi
i=1
dTPermeate side
dz
Eq. 39 TPermeate side|z=L= TSweepFeed
Eq. 40 The overall membrane heat transfer coefficient has been evaluated considering a resistance series system [34]. The coefficient is expressed as:
1 UMembrane= 1 hShell+ ODTube 2kMembraneln ( ODTube IDTube+2δSupport) + ODTube 2kSupport ln ( IDTube+2δSupport IDTube ) + ODTube IDTube 1 hTube Eq. 41
The thermal conductivity of the porous support kSupport is calculated as kSupport= (1- εSupport) kCeramic+εSupportkMixPermeate side
Eq. 42 where kceramicand kMixPermare the thermal conductivities of the ceramic membrane support and the gaseous mixture in the permeate side, respectively; εSupport is the porosity of the membrane support. The heat transfer coefficient between the fluid in the bed and the membrane, hShell, is calculated as [35]
39 hShell= 0.17 kMix Retentate side dP ( 𝑃𝑟 0.7) 1/3 ReP0.79, ReP= 𝐺 𝑑𝑃 μMixReaction Eq. 43 In the permeation side, where no catalyst pellets are present, the following expression is used for the heat transfer coefficient [36].
hTube= 1.86 kMix Permeate side 𝐷𝐸𝑞 + ( 𝐷𝐸𝑞 𝐿Membrane Re Pr) 1/3 , laminar flow Eq. 44
1.5.3 Permeation flux equation
The H2 permeation flux through the membrane was determined by the
Sieverts law using the parameters of a supported Pd-membrane developed in the framework of DEMCAMER project (Eq. 45).
JHPermeating2 = PermeanceH2 Driving Force = = Permeability0 𝑒 (-Ea/RT) Thickness (√𝑝H2 Reaction side− √𝑝 H2 Permeation side) = = 9.06 mmol m2 s Pa0.5 𝑒 (−8000 kJRTkmol) (√𝑝HReaction side2 − √𝑝 H2 Permeation side) Eq. 45 The effect of CO inhibition has been neglected since the CO partial pressure is low and the operating temperature is higher than 300 °C. The inhibition phenomenon, in fact, affects the permeation only at low temperature (< 270-280 °C) and at higher CO partial pressure [37, 38]. The effect of concentration polarization has been considered by mean of a concentration polarization coefficient (CPC) as reported in the literature [39, 40, 41, 42]. This coefficient evaluates the concentration polarization effect in term of permeance reduction. The term (1- CPC) is the ratio between the permeance in presence of concentration polarization limitation and the intrinsic permeance of the membrane, whose value can be obtained by pure H2 permeation test. The
permeance reduction term (1-CPC) has been estimated from literature data [42] available for a hydrogen permeator, operating at similar pressures and flow regime (Reynold number). In particular, from the literature data an
40 expression for CPC as a function of the H2 molar fraction on the retentate
side has been derived (Eq. 46): CPC = 𝑓(𝑥H2
Reaction side)
Eq. 46 The general trend of concentration polarization coefficient, as reported in literature, reveals as decreasing the hydrogen molar fraction increases the CPC value. In the simulation performed taking into account also the concentration polarization effect, the permeation flux equation has been expressed as: JHPermeating2 = (1 − CPC) ∗ 9.06 mmol m2 s Pa0.5 e( −8000 kJ/kmol RT )(√𝑝H 2 Reaction side− √𝑝 H2 Permeation side) Eq. 47 The estimated permeance reduction value (1-CPC) varied within a range of 0.2-0.4. It has to be noticed that, evaluating the CPC coefficient from permeator system data, the concentration polarization effect in membrane reactor is actually overestimated. The results from rigorous modelling, performed in the framework of DEMCAMER project, on concentration polarization effect in packed bed membrane showed lower permeance reduction values. For the pilot scale design a larger concentration polarization effect has been assumed since this approach assures that a conservative design is kept.
1.5.4 Kinetic equation
A kinetic equation from the literature [43] is considered. This equation has been determined for an iron–chromium based commercial catalyst and the kinetic study was directed to assessing the performance of the catalyst also in membrane reactor. In particular, the effects of CO, CO2, H2O and H2
concentration on WGS reaction rate has been determined over the catalyst using selected gas compositions that might be encountered in both traditional
41 and membrane reactors. The experiments were performed in a differential reactor at a constant temperature of 450 °C.
The considered reaction rate follows a power-law:
-rCO = 4.56 exp ( -88RT ) pCO0.9 p H2O 0.31 p CO2 -0.156 p H2 -0.05 (1- pCO2pH2 pCOpH2OKeq ) Eq. 48 where R is the universal gas constant (kJ mol-1 K-1), T is the reaction
temperature (K) and Keq is the equilibrium constant for the WGS reaction
[44]:
Keq= exp (4577.8T - 4.33)
Eq. 49 Reaction rate unit is mol/ (gcat s) and pressures are expressed in kPa. The
diffusion limitation in the catalytic pellets is also considered by means of “effectiveness factor”, defined in term of observable Thiele modulus. The effectiveness factor for a catalyst pellet diameter of 1 cm has been evaluated on the basis of the intrinsic reaction rate and experimental condition defined in the literature [43] as free from the mass transfer limitations.
The actual reaction rate (Eq. 50), expressed as mol/(m3Reactor s), is evaluated considering an effectiveness factor equal to 0.2, a catalyst density of 1500 kg/m3and a bed void fraction of 0.5.
rWGS = η (– rCO )(catalyst density) (1 - bed void fraction)
Eq. 50
1.5.5 Pressure drop
The pressure drop on the feed side was calculated using Ergun’s law (Eq. 51), while a constant pressure is assumed on the permeate side.
𝑑𝑝Reaction side 𝑑𝑧 = − 𝐺Reaction side 𝑑P 1 − 𝜀 𝜀3 ( 150(1 − 𝜀)μMixReaction 𝑑P + 1.75 𝐺 Reaction side) Eq. 51 pReaction side| z=0 = p Feed Eq. 52
42 The obtained system of coupled ordinary differential equations was solved by means of a simulation tool.
1.5.6 Simulation condition
The feed composition considered in the simulations is the one defined in Table 1. As described above, the composition of a syngas stream produced by natural gas steam reforming has been taken into account. Both vacuum and sweep scenario have been simulated, choosing the operating parameters and configuration on the basis of the results of the preliminary case studies screening. Three permeate pressure values within 0.25 and 0.5 bar have been considered for the vacuum scenario and three sweep factor values have been selected for the sweep scenario. The sweep factor is defined as the ratio of the flow rate of the sweep gas to the flow rate of the feed [16].
Sweep factor = I= FSweep FFeed
Eq. 53 The sweep factor values have been set on the basis of results from the analysis at fixed H2 recovery yield (RYH2). In particular, with a counter
current configuration, it has been shown that the conversion and H2 recovery
target values can be obtained operating even at low sweep fraction, equal to 0.2. The sweep flow rate to be fed to the MR has been therefore calculated by means of the following equation, assuming a sweep fraction of 0.2:
FSweep= FH2Permeate Sweep factor
(1- Sweep factor)= FFeed(xH2Feed+xCOFeed) RYH2
Sweep factor (1- Sweep factor)
Eq. 54 For an H2 RY of 0.9 the corresponding sweep flow rate is 0.055 kmol/h. This
corresponds to a sweep factor equal to 0.12, since:
Sweep factor = I = FSweep FFeed =
0.055 kmol/h
0.46 kmol/h = 0.12
Three sweep factor values have been fixed assuming as upper value 0.24 and as lower value 0.06. The MR geometric characteristic and the operating
43 conditions are reported in Table 8 and Table 9, respectively. The membrane area range has been selected on the basis of the estimated membrane surface for the different case studies, as describe in paragraph 1.4.
Table 8 Simulated MR geometric characteristics Membrane outer diameter, m 0.01
Membrane area, m2 0.11 – 0.22
Table 9 Simulated operating conditions
Vacuum scenario Sweep scenario
Feed pressure, bar 7
Permeate pressure, bar 0.25,0.35,0.5 1.2
Feed temperature, °C 330, 360, 380, 400 Feed molar flow rate,
mol/min 7.6
Sweep factor - 0.06, 0.12, 0.24
Configuration - Counter-current
1.6 Simulation results and discussion
To investigate the effect on MR performance and to define the final operating condition of the pilot scale reactor, the behaviour of the adiabatic packed bed membrane reactor as a function of the operating variables has been simulated for both scenarios. The most important variables to be evaluated for describing the MR performance are the CO conversion and the hydrogen recovery yield. The CO conversion was calculated as
44 CO conversion = FCO Feed- F CO Retentate FCOFeed Eq. 55 The hydrogen permeated through the membrane and recovered in the permeate side was evaluated in term of H2 recovery yield, as already defined
in Eq. 2.
H2 RY =
FH2Permeate FH2Feed+ FCOFeed
Eq. 56
1.6.1 Results for vacuum scenario
For the vacuum scenario the effect of the permeate pressure on the MR performance has been evaluated. CO conversion and H2 recovery yield have
been calculated at 0.25, 0.35 and 0.5 bar, for different membrane area. As expected, increasing the permeate pressure, conversion and recovery decrease because the hydrogen permeation driving force decreases. Figure 11 shows as the hydrogen recovery yield is more affected by the permeate pressure, with respect to the CO conversion. Operating at 0.25 bar an H2 recovery of 88% is
obtained, with a membrane area of 0.11 m2. At 0.5 bar, for the same area, the
hydrogen recovered decreases to 78%. The MR performance has been analysed also for several membrane surface. Increasing the membrane area, higher conversion and H2 recovery are obtained. In addition, at higher
membrane area the difference between the CO conversion values reachable at different vacuum pressure decreases. Operating at 0.35 bar with a membrane area of 0.135 m2, the conversion and recovery target values can be reached.
When the permeate pressure is further decreased, to 0.25 bar, the improvement in term of conversion and hydrogen recovery are less than 3%. In addition, considering also at the vacuum pump power required, lower permeate pressure seems to be less convenient. Therefore, on the basis of the simulation results obtained, a permeate pressure equal to 0.35 bar has been chosen as a reference value for the operating condition.
45 Figure 11 CO conversion and H2 Recovery yield as a function of permeate
pressure for different membrane area. Feed temperature 330 °C.
The effect of feed temperature has been also investigated. Results, in Figure 12, show the conversion and H2 recovery yield as a function of feed
temperature for an MR with 0.152 m2 of membrane area, operating at 0.35
bar as permeate pressure. Increasing the feed temperature the conversion slightly decreases. The negative effect on the equilibrium, being the reaction exothermic, is overbalanced by the increased H2 permeation that promotes
the CO conversion. Increasing the temperature the membrane permeance increases thus a larger hydrogen flux is obtained.
46 Figure 12 CO conversion and H2 Recovery yield as a function of feed
temperature. Permeate pressure 0.35 bar, membrane area 0.152 m2.
Table 10 CO conversion and retentate outlet temperature for different feed temperature. Permeate pressure 0.35 bar, membrane area 0.152 m2
Feed temperature, °C Retentate outlet temperature, °C H2 recovery yield, -
330 427.1 0.938
360 453.6 0.947
380 472.8 0.948
400 492.4 0.948
The results show as for feed temperature higher than 360 °C no further significant improvements in H2 recovery are obtained. Increasing the feed
temperature the retentate outlet temperature also increases (Table 10), moving towards temperature values more severe for both membrane and catalyst. In particular, low-medium temperature WGS catalyst was the target set for the novel catalyst to be developed within the framework of DEMCAMER project. Consequentially, aiming to integrate in the actual pilot
47 reactor the novel catalyst, 360 °C has been considered as the reference value for the operating feed temperature.
Finally, simulations for different membrane tubes number were performed in order to find the minimum number needed to reach the conversion and H2
recovery target values, for the selected operating condition (feed temperature 360 °C, permeate pressure 0.35 bar). The MR geometric characteristics have been selected by taking into account the membrane tube specifications (membrane tube unit length and membrane tube diameter) defined by the membrane producer partner. Table 11 reports the MR geometric characteristics used in the simulations, where, the concentration polarization effect has been considered by means of a permeance reduction coefficient, as described above (see 1.5.3 Permeation flux equation).
Table 11 Simulated MR geometric characteristics
Reactor length, m 0.44
Membrane outer diameter, m 0.01
Membrane tubes number 10 – 13
Membrane area, m2 0.138 – 0.180
Figure 13 shows the results, in terms of CO conversion and H2 recovery: the
minimum tube number required to reach the target value is 11 tubes. Consequentially, for the final design 12 tubes have to be considered, assuring to be over the target.
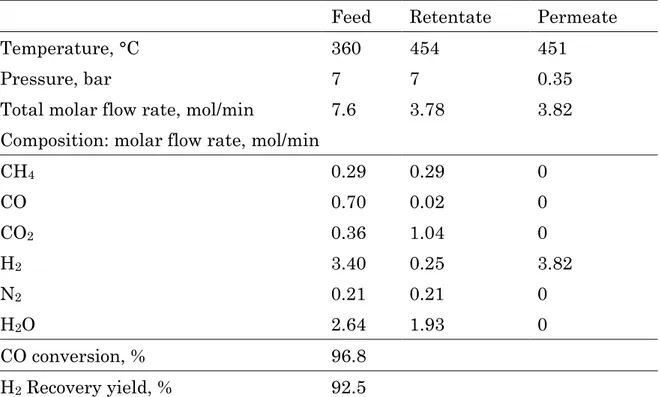
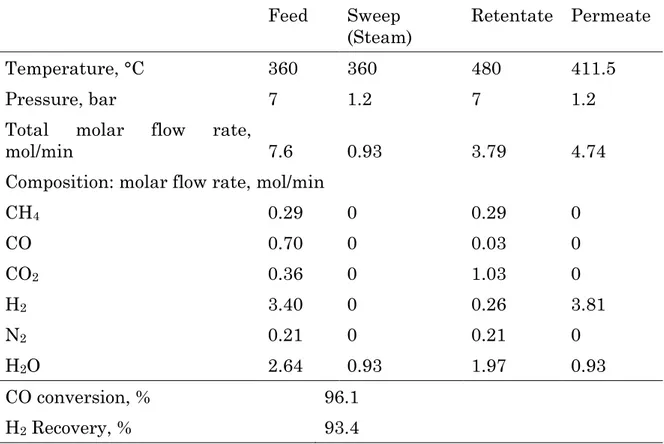
Table 12 reports the gas streams molar composition, CO conversion and H2
recovery of a membrane reactor equipped with 12 membrane tubes, operating at 0.35 bar and 360 °C, as permeate pressure and feed temperature respectively.