I
INDEX
Introduction pag. 1 References pag. 3CHAPTER I
Electrochromism Introduction pag. 51.1 Electrochromic parameters pag. 7
1.2 Electrochemistry and mechanisms of electrochromic systems pag. 14
1.2.1 Semiconducting electrodes pag. 16
1.2.2 Mass transport pag. 17
1.2.3 Voltammetry pag. 20
1.3 Classification of electrochromic type pag. 25
1.4 Electrochromic devices pag. 27
1.4.1 All-Solid cells with reflective operation pag. 28 1.4.2 All-Solid cells with transmissive operation pag. 30
1.5 Bipyridilium systems pag. 31
1.6 The charge transfer bipyrilidium species pag. 34
II
CHAPTER II
Solid thermoplastic laminable electrochromic film
Introduction pag. 43
2.1 Experimental section pag. 44
2.1.1 Chemicals pag. 45
2.1.2 Samples preparation pag. 45
2.1.3 experimental setup pag. 47
2.2 Results and discussion pag. 47
References pag. 77
CHAPTER III
KineticIntroduction pag. 80
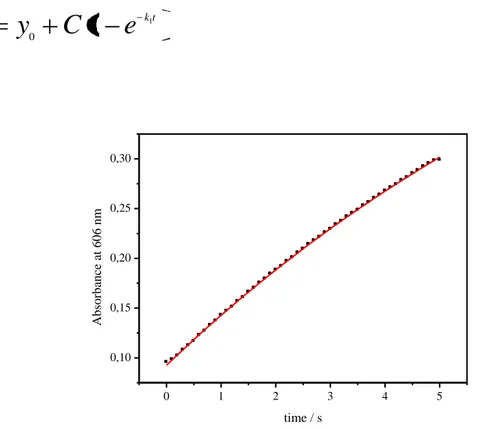
3.1 Fit of the experimental data pag. 81
3.2 Kinetics pag. 89
III
CHAPTER IV
Electrical charatterization of electrochromic films extended
Introduction pag. 98
4.1 Electrical characterization pag. 99
4.2 Electric schematic model pag. 106
References pag. 111
1
INTRODUCTION
The development of large area electrochromic windows is being actively pursued by a number of companies(1-4) and research organisations(5,6). An extensive review of major contributors and potential markets for electrochromic windows has been presented in a report by SRI(7). Interest on EC materials has grown during the last decades, especially because of their application in building automation as smart windows(8,9). The energy savings using them in smart buildings has been established in around 20%(10), but it could reach 50% in cold climates(9). The promising results in some buildings impel not only their fabrication, but also the research for new materials and drivers, as well as efforts of their electro-optical characterization for new applications like smart glasses or displays (11,12) Electrochromic anti-glare car rear-view mirrors have already been commercialized. The electrochromic materials can be used still in controllable light-reflective or light-transmissive devices for optical information and storage, sunglasses, protective eyewear for the military, controllable aircraft canopies, glare-reduction systems for offices
(13,14,15)
. More recently they have been used as electroactive layers to modify electrode surfaces(16,17) and as electrode materials for batteries. Generally, there are two kinds of the EC devices: (1) coloration due to the intercalation of small ions into the thin oxide films such as WO3, NiO and V2O5
(18)
, and (2) coloration due to reduction or oxidation of redox chromophores including some organic dye molecules. Since the time for inserting or deinserting small ions into the EC materials is relatively long, type 1 devices are not suitable for application in displays. For type 2 devices, though, a monolayer of redox chromophore can be colored/decolored with relatively rapid switching time is still not sufficient for practical applications(19). Our device is different from type 1 and 2, it is based on self-standing materials. A new kind of solid plastic EC film has been prepared, were the EC molecules and plasticizers are introduced into preformed
2 solid thermoplastic polymers. These substances are exposed to a sample thermal blending process. After the mixture is cooled at room temperature, a homogeneous solid film, with EC properties and great adhesion ability to a glassy support, is obtained. This preparation has allowed a particularly easy preparation of ECD suitable for large-scale applications, by simple lamination of the film between conductive glasses. The main purpose of this thesis has been to study this new electrochromic films. In the first chapter will discuss the chemical and physical-chemical properties of the electrochromic molecules in particular bipyridilium systems and will analyze the mechanisms that affect the internal systems electrochromic.
In the second chapter the characterization of the electro optical properties of new ECD is presented. In particularly it will be described the research that has been devoted to analyze the effect of the concentration of the different components and the effect of the thickness on the films EC under object of study. Then chap. 3 will concern about the kinetic study, performed in order to understand the mechanisms underlying the coloration process of the device. The kinetic processes occurring in the EC film is analyzed deriving the equations which describe the coloration processes in the bulk of the film and in the neighbouring of the electrodes.
The coloration and the bleaching of large area electrochromic devices is a complex process, involving electrochemical processes at two electrodes(20) and voltage drops along the transparent conducting electrodes which change the device potential at each point along the device(21-23). This results in different coloration voltages at each point of the device, whether the device is switched using a constant voltage or a constant current waveform. In chapter 4 the characterization of a large area device, from the electrical point of view, is presented. It is described the schematic electric model compatible with the experimental results, that we have built up with the purpose of finding out the changes in the parameters of the film or the conductive glasses that can minimize the differences of the local potential and allow the film to keep a uniform coloration throughout its extension at any time.
3
REFERENCES
[1] J. Gallego, Eurosun 96, Pilkington World Wide Web Site:
http://www.pilkington.com/custfoco/building/index.htm.
[2] G. Tulloch, Skryabin, G. Evans, J. Bell, Proc. SPIE 3136, 1997, 426-432
[3] J. Nagai, G. D. mcMeeking, Y. Saitoh, Solar Energy Mater. Solar Cells 56, 1999, 309-319
[4] N. Sbar, M. Badding, R. Budziak, K. Cortez, L. Laby, L. Michalski, T. Ngo, S. Schulz, K. Urbanik, Solar Energy Mater. Solar Cells 56, 1999, 321-341
[5] B. Munro, S. Kramer, P. Zapp, H. Krug, H. K. Schmidt, Institut fur nneue Materialien (FRG), Proocedings of SPIE, Vol. 3136, p. 470-479, 1997
[6] A. Azens, L. Kullman, Solar Energy Mater. Solar Cells 56, 1999, 487
[7] Rice Cabiac Smart Glass: seeking a Clear View of the Future, SRI report D98-2145, 1998, 26p.
[8] C.G. Granqvist, A. Azens, P. Heszler, L.B. Kish, L.Osterlund, Sol energy Mater. Sol.
Cells. 91, 2007, 355-365
[9] M.L. Persson, Ph.D.Thesis, Uppsala University, 2006 [10] A.Azens, C.G. Granqvist, Electrochim. Acta 46, 2001
[11] E:S: Lee, D.L. DiBartolomeo, S.E. Selkowitz, Energy Buildings 38, 2006 30-44 [12] C.G. Granqvist, SPIE Newsroom, 10.1117/2.1200602.0140,2006
[13] P.M.S. Monk, R.J. Mortimer, D.R. Rosseinsky, Electrochromism: Fundamentals and
Applications, VCH, Weinheim, 1995
[14] M. Green, Chem. Ind. 17, 1996, 641
4 [16] G.Inzelt, in ‘Electroanalytical Chemistry’, vol.18 (ed. A. J. Bard), Marcel Dekker, New
York 1994
[17] G. S. Ostrom and D. A. Buttry, J. Chem. 99, 1995, 15 236
[18] (a) K.C.Cheng, F.R. Chen, J.J. Kai, Sol. Energy Mater. Sol. Cells 2006,90,1156. (b) A. Ghicov, H. Tsuchiya, R. Hahn, J.M. Macak, A.G. Munoz, P. Schmuki, Electrochem. Commun. 2006, 8, 528. (c) A. Azens, G. Vaivars, M. Veszelei, L. Kullman, C.G. Granqvist, J. Appl. Phys. 2001, 89, 7886. (d) C.C. Liao, F.R. Chen, J.J. Kai, Sol. Energy Mater. Sol. Cells 2006, 90, 1147
[19] R. Cinnsealach, G. Boschloo, S. N. Rao, D. Fitzmaurice Sol. Energy Mater. Sol. Cells. 1999, 57, 125
[20] B. W. Faughnan, R. S. Crandall, i: J. I. Pankove (Ed.), topics in Applied Physics devices, Vol. 40, Springer-Verlag, New York, 1980
[21] I.L. Skryabin , J.M.Bell, G.B. Smith “optimisation of conductivity of transparent conductor layers in electrochromic device”, Paper presented at BrisPhys’94, 11th
Congress of
the Australian Institute of Physics, Brisbane, July 1994.
[22] D.R. Macfarlane, J. Sun, M. Forsyth, J.M. Bell, L.A. Evans, I.L. Skryabin, Polymer electrolytes for electrochromic windows applications, Solid State Ionics 86-88, 1996, 959-964 [23] I.L. Skryabin, J.M. Bell, G. Volgeman, “Twards a model of large area electrochromic
device operation”, in: Proceedings of the 3rd
Symposium on Electrochromic Materials, International Electrochromic Society, 96-24, 1996, p. 396
5
CHAPTER I
Electrochromism
Introduction
An electroactive species often exhibits new optical absorption bands in accompaniment with an electron-transfer or redox reaction in which it either gains or loses an electron. Such colouration was first termed “electrochromism” in 1961 by Platt[1] whose discussions were amongst the first published. Byker has discussed the historical development of electrochromism[2].
Many simple species exhibit electrochromism. To take a laboratory example, the ferrocyanide ion in aqueous solution is pale yellow in colour, but on electrochemical oxidation:
a pool brilliant yellow forms around the electrode, and thence diffuses into the bulk. The change in colour is directly attributable to the oxidation of iron(II) to iron(III) in the complex. A somewhat different case is ferrous ion in aqueous solution , in the presence of thiocyanate with
6 which Fe
2+
is only weakly complexed. Initially the solution is colourless, but a brilliant blood-red colour appears after oxidation on the formation of electro-generated iron (III). In this case, the colour may not be directly generated, but is possibly due to interaction between electro-generated Fe3+ and the electro-inactive CNS-ion in solution: it is the iron(III) thiocyanate charge-transfer complex that ultimately provides the colour. In this context, a “charge-charge-transfer” species is one in which a photo-effected transfer of charge within the species, sometimes between species, evokes colour, by “optical charge-transfer”.
The simplest electrochromic light modulators have two electrodes directely in the path of the light beam. If both electrodes bear an electrochromic layer, then the colour formation within the two must operate in a complementary sense, which can be illustrated here with the example of WO
3 and vanadium pentoxide: WO3 becomes strongly coloured (blue) when oxidised. By
contrast, V
2O5 is a rich brown/yellow colour when oxidised, yet faintly coloured (blue) when
reduced. In an electrochromic device (ECD) constructed with these materials, one oxide layer is present in its reduced form while the other is oxidised; thus the operation of the device is
The tungsten-oxide is termed the primary electrochrome since it is the more strongly coloured species and, in this example, V
2O5 acts as the secondary [3]
7 1.1 Electrochromic parameters
Visible light can be viewed as electromagnetic waves of wavelength 420 nm (violet) to 700 nm (red) or equivalently
[4]
as particulate photons of energy 4.7 x 10
-19
J (violet) to 2.8 x 10
-19
J (red). The colors cited refer to light directly entering the eye. However, color is a subjective visual impression involving retinal responses of the eye to particular wavelengths of the impinging light (table 1.1). Light comprising all visible wavelengths appears white. Reflected colors result from absorption by the reflecting material of some of these wavelengths, that is, from subtraction from the full wavelength range comprising incident white light. In with light, the perceived color of a material is the complementary color of the light it absorbs (figure 1.1)
[5,6]
. A single wavelength of absorption is encountered only with single-atom or single-ion photon absorption, the photon energy being transformed into internal electronic energy by the excitation of an electron between precise energy levels associated with the two orbitals accommodating the electron before and after the photon absorption, or “transition” as it is termed. In molecules the energy levels involved are somewhat broadened by contributory vibrational (and to a lesser extent, rotational) energies. Thus, on light absorption, transitions occur between two “spreads” of energy levels, (of, however, narrow spread) allowing the absorption of photons with a restricted range of energies, that is, of light a restricted range of wavelengths, giving an absorption band. The maximum absorption, roughly in the centre of such a band, corresponds to the “average” transition.
The target molecule here is called a chromophore, and when the color resulting from absorption is evoked electrochemically, an electrochromophore or more briefly, an electrochrome. The absorption spectrum of a substance represents the relative intensity (relative number of photons) absorbed at each wavelength.
9 The Beer-Lambert law
[7]
for optical absorption relates the absorbance, expressed as log of the ratio of the intensities, to the concentration c of chromophore and optical path length l through the sample:
The proportionality factor ε is the molar extinction coefficient or molar absorptivity of the absorbing species. From the preceding account, it should be clear that ε will vary with wavelength λ since A does, and it is the parameter quantifying the strength of the optical
10 absorption at each wavelength. ε(λ) (the value at wavelength λ) and ε
max (the value at the
maximum, often written without subscript) will depend on solvent, or solid matrix, to a greater or lesser extent. When the absorption results from optical CT, Kosower’s parameter Z[8], which is the energy (inverse wavelength) for the maximum absorption of a particular chromophore in a given solvent, varies with solvent in a manner followed proportionately by other similar chromophores, Z is a useful indicator of solvation in the chromophore-solvent system involved, which will clearly determine the transition energy, that is, where the absorption maximum occurs. The absorption can thus arise from photo-excitation of an electron from a lower (or ground-state) energy level to a higher one either in the same molecule, which is an intramolecular excitation, or within a neighboring moiety, which involves an intermolecular interaction termed optical
charge-transfer. The redistribution on photon absorption of electron density in the absorbing
species is more or less exactly depends on the transition moment M. M is measured from the area of the absorption band; the molar absorptivity at the maximum is commonly taken as being proportional to M.
The most intense optical absorptions are often a consequence of optical CT, since like intramolecular electronic transitions these are processes “allowed” by wave mechanical selection rules for spectral transitions. In any electrochromic system, a quantitative measure of the intensity of the color change is required. That commonly used is the contrast ratio CR:
11 where R
x is the intensity of light diffusely reflected through the colored state of the display, and
R
0 is the intensity of light diffusely reflected from the bleached (uncolored) state from a (diffuse)
white black plate
[9]
.
In transmission mode, the optical absorption of an electrochromic film is related to the injected per unit area Q (assuming no side reactions) by an expression akin to the Berr-Lambert law, since Q is proportional to the number of color centers:
where η is the “coloration efficiency” of the film. A CR of less than 2 or 3 is not easily perceived by eye, and as high a value as possible is desirable. Commonly CR is expressed as ratio, and is best measured at the wavelength of maximum absorption by the colored state.
Where there is a great difference in color between the two redox states, but both are highly colored, then the contrast is not perceived to be great. In this case, the CR is highly wavelength dependent.
The coloration efficiency η is related to an optical absorbance change ΔA via equation (1.5), and to the linear absorption coefficient α, film thickness d and charge injected Q per unit area, by the relationship[10]:
12 In the use of these equations, it is assumed that all optical effects are absorptive, that only a single absorbing species is effective at the wavelength chosen for monitoring, and that the Lambert-Beer law is obeyed. η may be regarded as that electrode area which may be colored to unit absorbance by unit change. η is designated as positive for cathodically induced coloration (by electron gain, or reduction) and negative for anodic color formation (by electron loss, i.e. oxidation).
If η
p is the coloration efficiency of the primary electrochromophore, and ηs that of the secondary,
then the coloration efficiency η
o of the complete ECD device is obtained as η0=( ηp- ηs). For the
most intense electrochromism, the parenthesized entity should be maximized, that is, a large change in A is required for injection of a small charge. This may be achieved in two ways, either by using a large η
p together with an ηs of the opposite sign (i.e. complementary electrochromism),
or by using a combination of large η
p and small ηs both of the same sign. In other words, both
electrodes colorize simultaneously or unwanted color in one electrode is feeble.
In general, organic electrochromes exhibit a greater η than do inorganic species because the molar absorbivities of the former are usually higher.
The write-erase efficiency is the percentage of the originally formed coloration that may be subsequently electro-bleached; it can be conveniently be expressed as a ratio of absorbance changes. For a successful display, the efficiency should closely approach 100%. Species remaining in solution in both colored and uncolored states, such as methyl viologen, diffuse from the electrode surface after electro-coloration. Since bleaching of such an ECD requires all the colored materials to diffuse back to the electrode for electrooxidation, which relatively slow process, the write-erase efficiency on a practical time-scale is poor for all-solution systems.
13 The time required for an ECD to color from its bleached state to (or vice versa) is termed its response time τ. For most devices, τ values are of the order of few seconds. For ECDs in general,
τ is slower than for either LCDs or CRTs, usually because of the necessity for diffusion, either of
charged species through the electrode film or, for all-solution systems, of the electrochrome to the electrode. In applications such as electrochromic windows or mirrors, response times of seconds can be tolerated, but if devices such as optical switches or television screen are envisaged, then very fast response times will be necessary.
Unfortunately, there is no consistency in the criteria employed for determining τ: it may be the time necessary for some fraction (arbitrary or defined) of the color to form, such as indicated by a particular increment of optical density, or the time for all or part of the charge to be injected. Another important electrochromic parameter of ECD is its stability. When an ECD is continually cycled between its colored and bleached states, device failure will eventually occur resulting from physical changes in solid phases or from chemical side reactions. The cycle life is a measure of its stability, being the number of cycles possible before such failure. The cycle life is a complicated function of the coloration required in the cycle: the cycle life generally decreases if wide changes in composition are required, that is if the quantity of charge injected or removed is large.
14 1.2 Electrochemistry and mechanism of electrochromic systems
The electron-transfer process during coloration is denoted by anodic or cathodic: cathodically coloring materials form color when reduced at an electrode made negative, a
cathode, and anodically coloring electrochromes are colored at an anode, or positive electrode.
The electrode potential for the electrochromic redox couple is related to the ratio of their respective concentrations by a form of Nerst equation:
where concentrations are denoted by square brackets, R is the gas constant, F the Faraday constant, T the thermodynamic temperature and n is the number of electrons involved in the electron transfer reaction. E
0
is the standard electrode potential, and is defined as the electrode potential measured at standard pressure and temperature, with both Ox and Red present at unit concentration (or formally and more accurately, at unit activity[11]).
In an electrochromic cell current flows when appropriate ranges of potentials are applied. Such current will comprise two components, faradaic and non-faradaic. The former current is directly linked with the sum of the electron-transfer reactions effected, and the charge (current-time integrated) indicates directly the extent of the cell reaction, since faradaic current involves that charge which yields product.
Electrochromic operation involves the quantity of electrochrome that changes redox state on passage of current, as governed by Faraday’s laws, which are as follows.
15 1. The number of moles of species formed at an electrode during electrode reaction is proportional to the charge passed;
2. A given charge liberates (or deposits) masses of different species in the ratio of their “equivalent weights” (relative molar masses divided by the number of electrons involved in the electrode reaction).
Non-faradaic current is caused by processes such as charging of the electric double layer at the electrode-solution interface (a local separation of unreactive-solute ions into layers of anion and cation partly governed by application of potential, which results in excess accumulation of ions of one particular charge sign at interfaces). In precise mechanistic descriptions of electrode processes, double layer effects need to be taken into account; this may be complicated.
The rate of electron-transfer at an electrode is a function of the gradient of electric potential applied to the electrode, and follows the Butler-Volmer equation
[11,12] which, for a reduction reaction Ox + ne - ═ Red is
where, for brevity, Θ = F/RT; c
O is the concentration of the oxidised form of the electroactive
species (starting material) and c
R that of the reduced form; α is a fraction termed the transfer
coefficient (subscripted f and b for forward and back reaction respectively), itself a measure of the symmetry of the energy barrier to the electron transfer
[1]
; η is the overpotential, (E – E
16 where E is the potential applied to the electrode and E
OC is the zero-current electrode potential. kf
and k
b are the rate constants of electron transfer for the forward and back processes.
1.2.1 Semiconducting electrodes
In the construction of electrochromic display devices, the substrate most commonly used as the optically transparent electrode (OTE) is indium tin oxide (ITO) as a thin film on glass. The thickness of the ITO layer is typically 0.3 μm. Indium(III) oxide, when doped whit ca. 8% tin(IV) oxide, is a semiconductor[13] of conductivity ca. 8 x 10⁻⁴ Scm-1, so the thickness and exact conductivity of the ITO layer will affect the ECD response time. The rate of supply (flux j) of electrons through the conductor and corresponding current i are obtained from the general applicable equations:
where n is the number density of charge carriers, A the cross-sectional area of the conductor, ν the electronic velocity and e the electronic charge. In thin-film indium tin oxide (ITO), the number of charge carriers is relatively small, restricting the rate of charge uptake or loss of the ITO/electrochrome interface. However, some authors believe that the response time of an ECD device with very thin films of ITO depends rather on the rate of electron transport, that is, ν, through the ITO
[14,15]
17 1.2.2 Mass transport
Before the electron-transfer reaction can occur, of necessity material must move from the solution bulk and approach close to an electrode. This movement is “mass transport”, and proceeds via three separate mechanisms: migration, convection and diffusion. Mass transport is formally defined as the flux j
i of electroactive species i to an electrode, as defined in the
Nerst-Planck equation:
where μ
i is the ionic mobility of the species i; Φ is the strength of the electric field, iν is the
velocity of solution, and D
i and ci are respectively the diffusion coefficient and concentration of
species i. Convection will not concern us further since it is irrelevant for solid electrolytes and otherwise uncontrolled in other ECDs.
Migration is the movement of ions through solution or solid in response to an electric field, an anode attracting any negatively charged anions, the cathode attracting the cations. For liquid electrolytes containing an excess of unreactive ionic salt, migration may be neglected since the transport number of the electroactive material becomes negligibly small. Migration is an important form of mass transport for ionic movement within solid polymer electrolytes or solid-solution electrochromic layers since transport numbers of the electroactive species become
18 appreciable
[15]
. The phenomenon of electrode “polarization” by excess unreactive electrolyte (the buildup of concentration of oppositely-charged electrolyte ions at an electrode) brings about diminution then suppression of migration; diffusion is the only remaining means of approach to the electrode available to a possibly electroactive species, as follows.
Of particular interest to any kinetic study is the diffusion coefficient D of the diffusing species, being representative of its spontaneous motion. Diffusive behavior obeys Fick’s laws[11,12], the first being for the flux j
i,
where is the concentration gradient, the change in concentration of species i per unit
distance. In electrochemical processes, arises (i.e. is non-zero) because some of the electroactive species is consumed around the electrode; diffusion is evoked by subsequent concentration gradient.
Fick’s second law describes the time dependence of diffusion:
19 The required integration of the second order differential equations often leads to difficulty in the accurate modeling of diffusive systems. However, a useful approximate solution to Fick’s second law gives
where D
i is the diffusion coefficient of species i, and t is the time required for species i to move a
distance l. Another indicator of the rate of ionic movement is the ionic mobility μ (velocity ν divided by driving field), which is related to the diffusion coefficient D by the Nernst-Einstein equation
where symbols have their usual electrochemical meanings and k
B is the Boltzmann constant.
When the impressed potential of an electrode is stepped from a value giving zero current to one at which the current can reach a maximum, then all the electroactive material at the electrode-solution interface will undergo electrochemical change “instantly”. Electroactive material from the solution bulk then diffuses toward the electrode, coming (diffusing) from successively further distances from the electrode. The flux at the electrode therefore decreases with time. The Cottrell equation
[16]
20 The Cottrell equation is a convenient means of determining diffusion coefficients of solution-phase species
[11]
.
1.2.3 Voltammetry
In electrochemistry of equilibrium (zero-current) the prospect of transfer of electron remains latent and the amounts of electrochrome present do not change, and thus study of the actual electrochromic coloration reaction is precluded. To allow these studies, dynamic electrochemistry is used, in which current is passed in a controlled way, by applying a potential E to a particular electrode that is different from the steady value, which we know re-label E
OC. The
subscript OC means “open circuit” (implying conjunction only to a voltmeter); E
cell is
equivalently an open-circuit or zero-current value.
Voltammetry is the most common of these dynamic techniques and is useful for discerning rates and mechanism, in addition to the thermodynamic data related to E
cell and E
o
usually obtained at zero current or open circuit. Processes occurring at one electrode are monitored by observing the current change when the potential applied to that electrode (actually between the electrode and the counter-electrode) is varied steadily through a range which evokes an electron-transfer process. The current is recorded as a function of the potential impressed on the electrode. The
21 potential is varied steadily, the rate dE/dt being kept constant know a either the scan rate or the
sweep rate, ν.
The electrode at which the electrochemical changes of interest occur is called the working
electrode, WE. In order that the potential at the WE be known, the potential difference E between
the WE and a third reference electrode, RE, is taken. The saturated calomel electrode (SCE) is usually employed as reference. The scan rate is of course referred to the RE.
In equilibrium (zero-current) electrochemical experiments, voltages between the WE and RE are measured via a voltmeter, and the potential recorded as a function of the externally varied concentration of the electroactive species present, according to the Nernst equation (1.7). by contrast, during voltammetry, compositions at electrodes are perturbed by the passage of charge at electrolyte/working electrode interface when electrode reactions occur; while minimum perturbation occurs in electro-analytical experiments, quite substantial changes generally occur in electrochromic processes. If current were to pass through the RE, then the electrode composition would alter and the electrode potential of the RE would change to give inaccurate potential measurement; in addition, the simple passage of current itself shifts the potential of the electrode. For these reasons, no charge can be allowed to flow through the RE. A third electrode, the
counter electrode, CE, is therefore used to complete the current-flow circuit, to obviate the
apparent paradox of requiring current passage at the WE while using a zero-current RE. As the third electrode is needed only because current must flow at the WE, the nature and composition of the counter electrode are largely irrelevant to the operation of a voltammetric cell. The potential of the CE is not monitored although electrode reactions must clearly take place at the CE if current is to flow; if oxidation occurs at the WE then reduction occurs at the CE, and vice versa, hence current. Figure 1.2 illustrate the connections.
22 The control of voltage across the working-electrode/counter-electrode pair is achieved using a
potentiostat. This device adjusts the voltage in order to maintain the potential difference across
the working and reference electrodes (sensed using a high impedance feedback loop). The potential is varied in a pre-programmed manner via a function generator. The potentiostat forces current trough the working electrode to achieve the potential desired.
In voltammetric experiment, an electro-inactive electrolyte is required in excess of the reactant species, in order to carry current trough the cell. Its role at the WE is to affect a kind of charge saturation which forces electroactive species to approach this electrode by diffusion rather than any field-effected conduction process (migration). In voltammetric experiments, electroactive species depleted by electrode prior to the electron-transfer reaction. Product if soluble diffuses
23 back to the bulk after the electron-transfer reaction is complete.
Fig. 1.3 Typical cyclic voltammogram (CV) obtained for a simple, reversible redox couple in
24 The flux of material at the electrode dictates the shape of the current-voltage curve (voltammogram) obtained.
We shall be concerned only with the equation for the peak current i
p as derived by Randles and
Sevcik[16]:
where A is the area of the electrode and c
i is the bulk concentration of the electroactive species. Di
is its diffusion coefficient. This equation is applicable to “reversible” all-solution systems (those undergoing rapid electron-transfer at the electrode). Commonly i
pc refers to the peak for a
cathodic process, while i
pa refers to an anodic process.
The peak in the voltammetrically monitored current i
p here is thus proportional to the
concentration of the electroactive species, and to the square root of the scan rate. In cyclic voltammetry, the potential is ramped twice: the potential of the WE starts at an initial value E
in
and is ramped to a limit, E
λ known as the switch potential, and is then swept back to Ein. A plot of
current against this potential E is then recorded as a cyclic voltammogram or CV. A typical CV for a one electron process is shown in Fig. 1.4. The peak potentials for the anodic and cathodic electron-transfer processes are labeled E
pa and Epc respectively. The peak separation is 58/n mV
for reversible (i.e. rapid) n-electron reactions
[11]
. The same general shape but with peak separation greater than 58/n mV indicates “quasi-reversibility” resulting from somewhat slow electron-transfer at the electrode, or from intrusive resistance of electrolyte in a cell comprising less than ideal compositions for voltammetry. Conventionally the sign of ν is cited as a positive
25 number and the range of scan rates commonly employed in cyclic voltammetry is 1< ν<500 mVs
-1
.
1.3 Classification of electrochrome type
The type of electrochrome used in ECD governs the kinetic behavior evinced. A classification is presented here, borrowed largely from an earlier treatment by Chang et al.
[17]
For “Always is solution” electrochromes, the electrochemical electron-transfer reaction occurs at the solid-liquid interface. The electroactive species in solution encounters the solid electrode, undergoes an electron-transfer reaction, be it reduction at a cathode or anodic oxidation, and then in its new form moves away from the electrode, returning to the solution bulk. The electrochrome changes color on undergoing the electron-transfer reaction. A simple example of this kind of electrochrome is methyl viologen dication in water. MV2+ in the initial solution is colorless (or faint yellow in the presence of some anions), a bright blue radical cation MV+* when the electrode is made cathodic (negative). The rate-limiting process during the (reductive) electron-transfer reaction is the rate at which MV
2+
dication reaches (diffuse toward) the electrode from the solution bulk, the rate of electron acquisition when MV
2+
reaches the electrode interface being much faster.
In electrochromic devices on methyl viologen, if a fixed potential, substantially more negative than the (zero-current) electrode potential for MV2+ reduction, is applied to the working electrode, then the observed current follows the Cottrell[18] time dependence, 21−∝ti. This
26 dependence follows from the laws diffusion. Hence the absorbance 21+∝tA if the current flow is wholly faradaic, that is, if each electron-transferred generates a color centre. The t exponent follows because the amount of MV
+●
generated depends on the integral of I with time.
In “Solution-to-solid” systems the electrochromes are initially soluble and colorless but, following electron-transfer, they form a colored solid film on the surface of the electrode. An example of this kind of electrochrome is heptyl viologen (HV). HV
2+
dication dibromide is pale yellow is pale yellow in aqueous solution but form a layer of deeply coloured radical cation salt on reduction. The reduction is, in fact, a two-step process (possibly concerted[19]) involving first an electron-transfer reaction
and subsequent precipitation
The deposit is initially amorphous but becomes more crystalline soon after formation
[20]
. The morphology, solubility and color of such radical-cation salts depend on the accompanying counter anion
[20]
.
The Cottrell current-time relationship of 21−∝ti together with 21+∝tA is followed fairly closely during short times as soluble HV
2+
diffuses toward the electrode
[21]
. At longer times, however, the kinetic response becomes more complicated: HV
+●
X
-
is a solid dielectric of relatively poor conductivity, and further coloration involving generation of additional colored product must
27 proceed via slow electron transport trough the solid deposit at the solution/electrode interface. Again, during electro-oxidative color erasure of the radical cation salt achieved by the reversal of reactions (1.17) + (1.18), complications, in this system become apparent, which necessitate the presence in the electrochemical deposition solution of electron mediators such ferrocyanide ion which acts catalitically to facilitate electron transfer[22,23].
The most commonly used electrochromes for “All-Solid” systems are Rare-earth phthalocyanines, Prussian blue, and metal oxides, for example, of tungsten, molybdenum, nickel or vanadium. For metal oxides and Prussian blue, the electrogenerated color appears as a consequence of an optical charge-transfer transition between metal centers in the solid-state lattice.
The rate-limiting process usually encountered with this type of electrochromes is the ionic charge transport the solid electrochrome. The diffusing species, enters the electrochrome via the electrolyte-film interface and then moves through the film although it does not reach the metal-conductor substrate at the other side of the electrochrome.
Two separate diffusion processes will occur within the solid: both the ion diffusion from the electrolyte/solid interface, and electron from the electrode-electrochrome interface. Only the
slowest, rate limiting, of these diffusion processes will be measurable in systems in fast
electron-transfer in the redox processes.
1.4 Electrochromic devices
Many ECDs comprise a sandwich structure of thin layers, the number and nature of which depend on the intended use. The construction of ECDs will be the same whether a large area cell or one small element (pixel) of a multi-electrode array is required
[24]
28 Electrochromism is used in one of two modes: in adjustment of either reflected or transmitted intensity, Fig. 1.4.
1.4.1 All-solid cells with reflective operation
For all-solid systems, reflective cells may be assembled according to the schematic diagram in Fig. 1.5. The front panel is an optically transparent electrode (OTE), that is, a solid support, for example glass bearing a thin transparent but conductive film on its solution-facing side. Tin-doped indium oxide (ITO) is commonly employed
[25]
. Typically about 0.3 μm thick. The glass of chosen thickness may be reinforced to give structural strength. The OTE acts as the conductor of the electrons necessary for the required electron-transfer to take place in the electrochromic material. If the latter is the primary electrochrome, a secondary electrochrome may be deposited on the counter electrode. The layers are deposited by electro deposition,
29 evaporation or some other method directly on to the OTE surface to minimize contact resistances. The use of OTEs for electrochromic applications has been reviewed by Lyman
[26]
and Granquist
[27]
. ECDs operating in a reflective mode (Fig. 1.5) employ a reflective material in the path of the light-beam, both the primary and secondary electrochromes being positioned before it. Example of reflector include polished platinum
[28]
and rhodium alloy
[29]
. The potential is applied between the front OTE and rear electrode/reflector. Displays may have a metallic (e.g. gold) working electrode on which the electrochrome acts, with transparent ITO as counter electrode and window.
Diffusion is usually the predominant mode of mass transport of counter ions in the electrochromic layer while migration is the transport mechanism in the electrolyte.
30 ECDs in which a separate reflector is placed before the secondary layer have been described at length by Baucke
[28, 30-32]
. Although this arrangement this has practical advantages, the counter electrode need not to be electrochromic since it is never in the path of the light beam, the reflector must be ion permeable if charge is to pass across the cell, requiring a porosity which diminishes its reflectivity.
1.4.2 All-solid cells with transmissive operation
Transmissive cells are assembled according to the schematic diagram in Fig. 1.6. Such ECDs are very similar to reflective devices except
31 that the rear electrode obviously cannot be opaque: all layers must fully transparent in the visible spectral range. The apparent intensity change in a transmissive device is only half that of an otherwise identical ECD acting in a reflective mode. This follows since light passes through the primary electrochrome twice in a reflective device, before and after reflection, but only once in a transmissive cell in which the optical path length is thus, in effect, halved.
1.5 Bipyridilium systems
One of the major group of electrochromes are the bipyridilium species formed by the diquaternising of 4,4’-bipyridil to form 1,1’-disubstituted-4,4’-bipyridilium salts (Fig. 1.7). The positive charge shown localized on N is in general delocalized over the rings. The compounds are formally named as 1,1’-di-substituent-4,4’-bipyridilium if the two substituent at nitrogen are the same, and as 1-substituent-1’-substituent’-4,4’-bipyridilium should they differ. The anion X
-
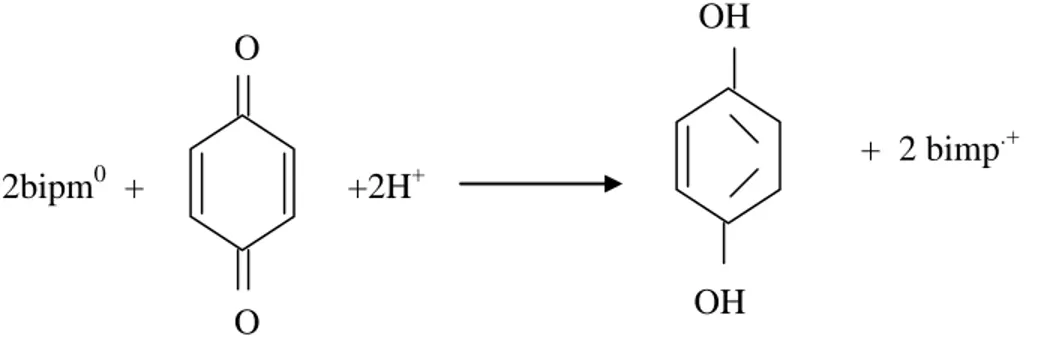
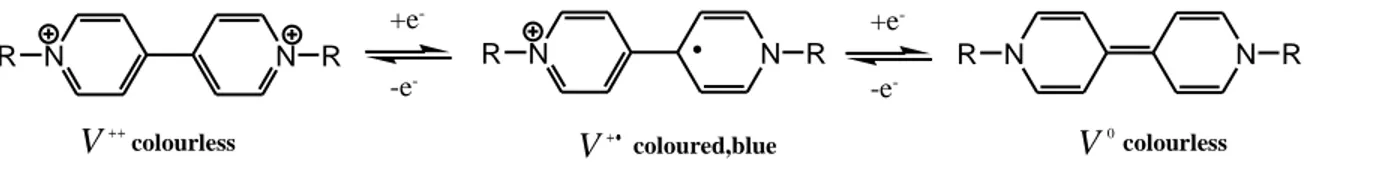
in Fig. 1.7 need not be monovalent and can be part of a polymer. A convenient abbreviation for any bipyridyl unit regardless of its redox state is “bipm” with its charge indicated. The most common name for these salts is viologen which is the color formed when 1,1’-dimethyl-4,4’-bipyridilium undergoes a one-electron reduction to form a radical cation
[33,34]
. There are three common bipyridilium redox states: a dication (bipm
2+
), a radical cation (bipm
•+
) and a di-reduced neutral compound (bipm
0
). The dication is the most stable of the three and is the species purchased or first prepared in the laboratory. It is colorless when pure unless optical charge-transfer with the counter anion occurs. Such absorbencies are feeble for anions like
32 chloride but are stronger for CT-interactive anions like iodide
[35]
.
Reductive electron-transfer to the dication forms a radical cation (equation 1.19). Bipyridilium radical cations are amongst the most stable organic radicals, and may be prepared as air-stable solids
[36,37]
. The stability of the radical cation is attributable to the delocalization of the radical electron throughout the π-framework of the bipyridyl nucleus, the 1 e 1’ substituent commonly bearing some of the charge.
Electrochromism occurs in bipyridilium species because, in contrast to the bipyridilium dications, radical cations are intensely colored owing to optical charge-transfer between the (formally) +1 and zero valent nitrogens, in a simplified view of the phenomenon (in fact, because of the
33 delocalization referred to, the source of the color is probably better viewed as an internal photo-effected electronic excitation). The colors of radical cations depend on the substituent on the nitrogen. Simple alkyl groups, for example, promote a blue/violet color whereas aryl groups generally impart a green hue to the radical cation. Manipulation of the substituent at N to attain the appropriate molecular orbital energy levels can, in principle, tailor the color as desired. Comparatively little is known about the third redox form of the bipyridilium series, the di-reduced or so called “di-hydro”[38] compounds formed by one-electron reduction of respective radical cation (reaction 1.20)
The same species is formed by a two-electron reduction of the dication. The intensity of the color exhibited by bipm
0
species is low since no optical charge-transfer or internal transition corresponding to visible wavelengths is accessible.
Bipyridilium salts are some of the few organic species that undergo the comproportionation reaction in solution, in which two redox states of the same compound react to form an intermediate redox state, equation 1.21:
34 the first product of the comproportionation reaction is in fact spin-paired radical-cation dimer
[39]
. The transition state of reaction 1.21 is thus assumed to have the two redox states lying face to face in a “sandwich”–type configuration.
1.6 The charge transfer equilibrium of bipyridilium species
The bipyridilium dication is a relatively weak electrolyte and almost always evinces some forms of ion association. The association takes the form of ion pairing if the interaction is predominantly ionic, or as charge-transfer complexation if a significant extent of orbital overlap can occur.
The term charge-transfer is used in some of the literature to imply that a discrete electronic charge has transferred from donor to acceptor, i.e. that the wave function for the excited system describes the quantity of charge which transfers as being that of an integral electron. The fraction of electronic charge actually transferred in a ground-state configuration can be small for viologen-donor complexes.
Typically, a charge-transfer complex is detected in UV-visible spectrophotometry. When two compounds in solution are brought together and a new optical absorption band is formed that was not present in the spectrum of either component, then it is likely that a CT complex has been formed:
35 The viologens are all excellent electron acceptors (that is, have a high electron affinity E): for example, White
[40]
cites an electron affinity of 120 kj mol
-1
for methyl viologen.
During complex formation, the orbitals of the approaching molecules overlap, and the resultant distortion causes a movement of charge from the donor to the unoccupied orbitals of the acceptor molecule, this attractive charge-transfer interaction occurs in tandem with the other low-energy interactions always present; a stable complex forms if the attractive interactions outweigh the repulsive energetic forces
[40]
.
CT bands tend to be rather intense owing to the electronic transition being wholly allowed quantum mechanically
[41]
. The CT band is also quite wide because both acceptor and donor species can have a range of energies and bond separations following a Boltzmann-type distribution. For this reason, the spectroscopic CT band is essentially gaussian[41] when drawn with an energy-related abscissa.
The energy for the electron-transfer reaction is supplied by a photon:
The CT complex is colored because of the uptake of this photon; and the color seen in the laboratory is the complementary color to that absorbed.
In addition to collision between acceptor and donor followed by photon absorption, equation 1.23, there is also an extensive literature on the formation of CT complexes via redox reactions, as represented here by electron-transfer within an ion pair
36 Photon absorption by the product of equation 1.24 yields the familiar color of a CT complex. Since the viologen dication is almost always involved in some form of CT equilibrium, electro-reduction will involve electron transfer to a bipm
2+
moiety that is complexed. In fact, complexes of methyl viologen can be relatively electro-inert at solid electrodes and the rate determining step during electro-reduction is the prior dissociation of the complex before electron-transfer: it is thus a CE reaction. This CE reaction (that is, a chemical reaction followed by an electrochemical reaction) is demonstrated in figure 1.8, where the rates of electron-transfer k
et and of complex
dissociation are plotted together: the correlation is seen to be more than coincidental, which would surely have been the case in the absence of a CE-type process.
The inorganic ion to have received most attention as a CT donor to methyl viologen is hexacyanoferrate(II)
[42-46]
. The CT of aqueous methyl viologen with ferrocyanide depends
[47]
on pressure, ε increasing by 35% and λ
max shifting by ~ 1700 cm -1
when the pressure was increased from 0.001 kBar 10 kBar. The spectral peak width did not alter, although the peak is slightly non-gaussian (too wide) on the low-energy side on the band.
Nitrogen-containing species are represented by amines such as aniline
[42, 48, 49] , p-toluidine [42] , p-phenylenediamine [50] , N,N-dimethyl-aniline [42] , benzidine [42]
. In passing, it should be noted pyridine or 4,4’-bipyridine also acts as a donor (particularly in organic solution) owing to the lone pairs at nitrogen: when conditions are opposite, the quaternization of 4,4’-bipyridine will proceed with a faintly colored solution since the unreacted bipyridine forms a weak complex with
37 the newly formed viologen product. No quantitative measurements of association between pyridine or 4,4’-bipyridine and viologens are extant.
The best oxygen-containing donors are the phenols such as p-cresol
[42]
, p-methoxyphenol
[42]
, and pyrogallol[42]. There is some evidence that a few aliphatic alcohols[51] (such as propan-1-ol and propan-2-ol) can also effect CT with viologens.
Another type of CT is seen when the donor is an aromatic species. Here, it is the π-orbitals of the arene which donates charge to viologens. In this case, it is the (charge) centroid of the arene which is directed toward the nitrogens of the bipyridilium salt acceptor, rather from a specific
38
donor atom
[52-57]
.
The energy of the charge-transfer band in the solid state usually relates to the energy necessary for photo-excitation across the band gap between the valence and conduction bands, although it could still refer to the energy required for electron hopping between acceptor and donor.
The viologen radical cation is comparatively electron rich and can, in the solid state, act as a modest donor. When acting as donor to a viologen dication, the formal oxidation state per viologen moiety is non-integral and the solid is thus deemed to be “mixed valent”
[58]
39 mixed-valence species are well-conducting semiconductors or even have metallic electrical properties. It should be recognized that anions are also present in a non-interactive capacity. (The magnitude of anion interactions, hitherto the sole interactions of interest, are probably much smaller here than the other forces in the solid state, so anions can be ignored except insofar as they may influence the resultant crystal structure).
Samples of solid solid-state viologen are held together in a highly stereospecific conformation by charge-transfer-type associatives forces.
40
REFERENCES
[1] J. R. Platt, J. Chem. Phys., 34, 1961, 862. [2] H. Byker, Proc. Electrochem. Soc., 94, 1994, 3.
[3] S.F. Cogan, T.D. Plante, R.S. McFadden and R.D. Rauh, Proc.
S.P.I.E., 823, 1987 106.
[4] A.J.M. Rae, “Quantum Mechanics”, 2
nd
Edition, Hilger, Bristol, 1986.
[5] R.W.G. Hunt, “The reproduction of Colour”, Fountain Press, Tolworth, 1987. [6] P.W. Atkins and J.A. beran, “General chemistry”, 2
nd
edn., W.H. Freeman, New York, 1992, pp. 231 and 815.
[7] P.W. Atkins “Physical Chemistry”, 5th edn., Oxford University Press, Oxford, 1994. p. 545. [8] E.M. Kosower, “An Introduction to Physical Organic Chemistry”, Wiley, New York, 1968. [9] B.W. Faughnan and R.S. Crandall, in J.I. Pankove (ed.), “Display Devices”, Springer-Verlag,
Berlin. 1980. Chap. 5.
[10] S.F. Cogan and R.D. Rauh, Solid State Ionics, 28-30, 1988, 1707.
[11] A.J. Bard and L.R. Faulkner, “Electrochemical Methods”, Wiley, New York, 1980.
[12] The Southampton Electrochemistry Group, “Instrumental Methods in Electrochemistry”, Ellis Horwood, Chichester, 1985.
[13] C. Bohnke and O. Bohnke, J. Appl. Electrochem., 18, 1988, 715. [14] H. Kaneko and K. Miyake, Appl. Phys. Lett., 49, 1986 112.
[15] P.G. Bruce, in “Polymer Electrolyte Reviews”, (eds.) J.R. MacCullum and C.A. Vincent, Elsevier, Amsterdam, 1987, p. 237.
41 [16] A. Sevcik, Coll. Czech. Chem. Commun., 13, 1948, 349.
[17] L.F. Chang, B.L. Gilbert and T.I. Sun, J. Electrochem. Soc., 122, 1975, 955. [18] F.G. Cottrell, Z. Physik. Chem., 42, 1902, 385.
[19] R.G. Barradas, S. Fletcher and L. Duff, J. Electroanal. Chem., 100, 1979, 759. [20] J. Jasinski, J. Electrochem. Soc., 124, 1977, 637.
[21] J. Bruinik and P. van Zanten, J. Electrochem. Soc., 124, 1977, 1232. [22] A. Yasuda, H. Mori and A. Ohkoshi, J. App. Electrochem., 14, 1984, 323. [23] J.G. Kenworthy, ICI Ltd. British Patent: 1,314,049 (1973).
[24] T.P. Brody and P.R. Malmsberg, J. Hybrid Microelec., II, 1979, 29.
[25] R.W. Murray, W.R. Heineman and C.W. O’Dom, Anal. Chem., 39, 1967, 1666. [26] N. R. Lynam, Proc. Electrochem. Soc., 90-2, 1990, 201.
[27] C.G. Granqvist, Appl. Phys. A., A57, 1993, 19.
[28] F.G.K. Baucke, Rivista della Staz. Sper. Vetro, 6, 1986, 119.
[29] W. Wagner F. Rauch, C. Ottermann and K. Bange, Nuc. Instr. Meth. Phys. Res., B50, 1990, 27.
[30] F.G.K. Baucke, K. Bange and T. Bange, Displays, October 1988, 179. [31] F.G.K. Baucke, Proc. Electrochem. Soc., 90-2, 1990, 298.
[32] F.G.K. Baucke, S.P.I.E. Institute Series, IS4, 1990, 518. [33] L. Michaelis and E.S. Hill, J. Gen. Physiol., 16, 1933, 859. [34] L. Michaelis, Chem. Rev., 16 , 1935, 243.
[35] D.R. Rosseinsky and P.M.S. Monk, J.C.S. Faraday Trans., 89, 1993, 219. [36] D.R. Rosseinsky and P.M.S. Monk, J.C.S. Faraday Trans., 90, 1994, 1127. [37] B. Emmert and O. Varenkamp, Chem. Berichte, 56, 1923, 490.
42 [39] P.M.S. Monk, R.D. Fairweather, M.D. Ingram and J.A. Duffy, J. Chem. Soc., Perkin. Trans.
II, 1992, 2039.
[40] B.G. White, Trans. Faraday Soc., 65, 1969, 2000.
[41] J.A. Duffy, Bonding, Energy Levels and Bands in Inorganic Solids, Longmans, Harlow, 1990.
[42] A.S.N. Murthy and A.P. Bhardwaj, Spectrochim. Acta, 38A, 1982, 207.
[43] A.M. Kjaer, I. Kristjansson and J. Ulstrup, J. Electroanal. Chem., 204, 1986, 45. [44] L.A.A. de Oliveira and A. Haim, J. Am. Chem. Soc., 104, 1982, 3363.
[45] J.C. Curtis, P. Sullivan and T.J. Meyer, Inorg. Chem., 19, 1980, 3833. [46] H.E. Toma, Can. J. Chem., 57, 1979, 2079.
[47] W.S. Hammach, H.G. Drickamer and D.N. Hendricksen, Chem. Phys. Lett., 151, 1988, 469. [48] A.T. Poulos, C.K. Kelley and R. Simone, J. Phys. Chem., 85, 1981, 823.
[49] G. Jones and V. Malba, Chem. Phys. Lett., 119, 1985, 105.
[50] H. Byrd, E.P. Suponeva, A.B. Bocarsly and M.E. Thompson, Nature, 380, 1996, 610. [51] A. Meyerhaus, W. Pfau, R. Memming And P. Margaretha, Helv. Chim. Acta., 65, 1982, 2603.
[52] K.B. Yoon, T.J. Huh and J.K. Kochi, J. Phys. Chem., 99, 1995, 7142. [53] S.M. Hubig, J. Phys. Chem., 96, 1992, 2909.
[54] K.B. Yoon and J.K. Kochi, J. A. Chem. Soc., 111, 1989, 1128. [55] M.E. Wacks and V.H. Dibeler, J. Chem. Phys., 31, 1959, 1557. [56] S.M. Hubig and J.K. Kocji, J. Phys. Chem., 99, 1995, 17578. [57] G. Brigleb and J. Czekalla, Z. Elektrochem., 63, 1959, 3
.
[58] D.B. Brown (ed), Mixed-Valence Compounds in Chemistry, Physics and Biology, Reidel Publishing Company, Dordrecht, Holland, 1980.
43
CHAPTER II
Solid thermoplastic laminable electrochromic film
Introduction
Electrochromic (EC) technology and EC device are drawing attention for their high potentiality in relation to solar control and display applications. The working principle of EC systems is very simple and is linked to the use of EC molecules which exhibits new optical absorption bands when an electron is gained or lost in a redox process(1,2). In the most simple EC devices, EC active molecules are dissolved in the some medium interposed, as a single film, between the conductive inner surfaces of two transparent supports ( generally glass slabs). The first examples of these EC films are those obtained dissolving anodic and cathodic EC molecules in a fluid electrolyte solvent. In this case the performance of the system is controlled by molecular diffusion of the EC molecules. During the coloration step, when a potential difference between the electrode layers is applied, the EC molecules need to diffuse toward the conductive electrodes, where they are reduced (cathodic process) and oxidized (anodic process). Color across the film is generated by the change of the optical absorption of the cathodic or anodic (or both of these) species(3-5). When the electric potential is removed, cathodic and anodic molecules diffuse across the medium and the electron-transfer process, between the oxidized and reduced species, takes place. EC molecules will then return to their zero-potential equilibrium state, and the color disappears. The electrochromic fluid film has the advantage of being reasonably fast (operational time less than 1 second) but cannot be used in large solar control window or large display for
44 several reasons. First of all, it must be mentioned that materials forming the fluid film are subjected to natural convection or to a process known as aggregation(6) or segregation (7), due to the variation of the solvent organization around the EC molecules when they undergo redox processes. Near the anode the solution density increases with respect to the bulk, owing to the oxidation of cathodic material. Polar organic solvents used in EC devices in fact yield a better solvatation of cathions and oxidized species. The motion of solvatation sphere surrounding the anodic material towards the newly formed oxidized species allows the solution to become more dense. At the cathode the effect is reversed. In this way severe color inhomogeneity in large area devices can occur. Other drawbacks phenomena encountered in large EC device where fluid film are sandwiched between glass slabs are due to the onset hydrostatic pressure of the fluid layer which can break or separate from the glass supports. To eliminate the disadvantages of the fluid film EC devices, polymer thickeners have been introduced into the EC fluid solution. Examples of these systems are those described by Tsutsumi et al.(8-10) which contain organic EC redox materials, solvents, and some percentage of a cross-linked polymer, formed by in situ polymerization of some fluid monomers added to the formulation. Other kinds of EC devices involve conducting polymers in which redox molecules are immobilized by providing reactant pendants(11-13). Our research work is different from EC gelled mobile systems and immobilized systems was devoted to the development of an easy technology based on self-standing materials where redox centre mobility is reduced but not suppressed. Recently we have published a study concerning a new thermoplastic self supported EC film(14,15). There the preparation of this film, containing wt.40% PVF (poly vinyl formal), 5wt.% ethyl viologen diperchlorate (EV), 1wt.% hydroquinone (HQ) and 55 wt.% propylene carbonate (PC), is described. The absorption data of the device at different pulse voltages are presented as a function of time. The active molecules we have used as cathodic components belong to the class of bipyridinium salts (viologens), which
45 are a well-known class of EC compounds displaying different colors in dependence of their oxidation state and the nature of the substituents at the nitrogen atoms (16-21). In this chapter our scope is to study the effect of the concentration of different components and the effect of the thickness on the films EC under object of study.
2.1 Experimental section
2.1.1 Chemicals
All chemical reagents were commercially available and were used as purchased without further purification. Poly(vinyl formal) (PVF), propylene carbonate (PC), hydroquinone (HQ), ethyl viologen diperchlorate (EV) were purchased from Aldrich Chemical.
2.1.2 Samples preparation
Different electrochromic samples with different compositions and different thickness were prepared in order to study their electrooptical parameters and properties. Here we describe the general preparation procedure of an electrochromic solid film; in the following paragraphs the details of the amount of each component will be supplied. Ethyl viologen diperchlorate, hydroquinone and propylene carbonate are mixed in a proper amount, the obtained electrochromic solution is stirred at 100°C for approximately 10 minutes for good homogenization. All solid electrochromic films are produced mixing at 150°C PVF and the electrochromic solution, until an homogeneous perfectly transparent film are obtained ( thermal
46 blending process). After cooling the mixture at room temperature, an homogenous solid film, with EC properties and great adhesion ability to a glass support is obtained. The all solid ECD is then very easily manifactured, by simply heating the electrochromic film to the temperature of softening of the plasticized thermoplastic polymer (100-150 °C), this molted mixture is laminated between two ITO coated conductive glasses. No spacer needed to be added to control the thickness of the cell, because, the control of parameters of the lamination process, as the temperature and the pressure applied to the conductive glasses, allowed us to get an electrochromic cell of the desired homogeneous thickness. This preparation gives the possibility to obtain in a very easy way ECD suitable for large-scale applications, by simple lamination of the film between conductive glasses.
The advantage are:
1) No evaporation of solvent
Some electrochromic films are obtained dissolving each component of the mixture in a solvent, and then evaporating the solvent to obtain the film. It is not optimal because the production of large area device would ask the disposal of great quantities of harmful solvent.
2) No curing after device obtain
In some gelled system with the diacrylate monomers it’s necessary UV curing of the device after the assemblage to get a self-supported film
3) Mono-layer system 4) Self-consistent 5) Self-supported
47 2.1.3 Experimental setup
The electro-optical properties of ECD were measured with a YASCO V550 UV-VIS spectrometer. The light intensity with no sample in place was assumed to be the full-scale intensity. Measurements was performed at 25°C, under the application of square voltage pulses. An AMEL 2049 model potentiostat/galvanostat and an AMEL 568 programmable function generator were used to apply a square potential during electrochromic measurements.
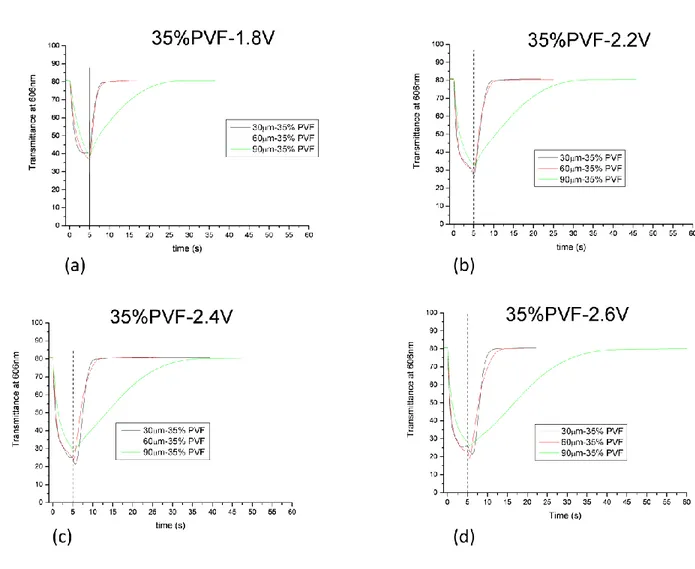
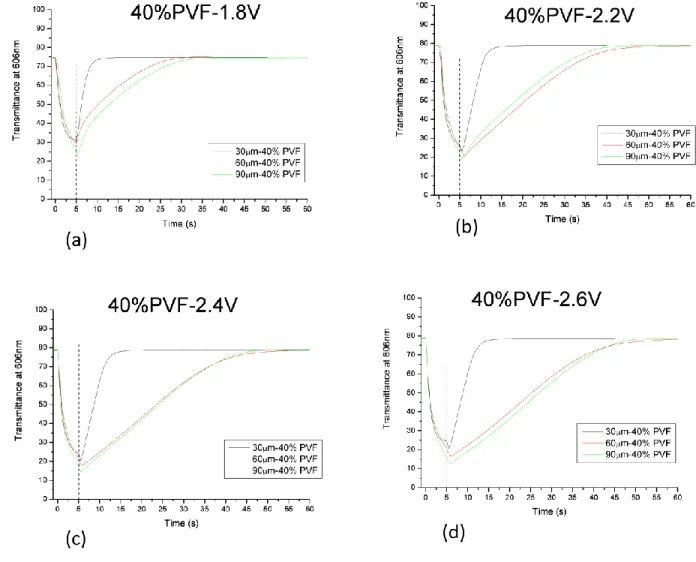
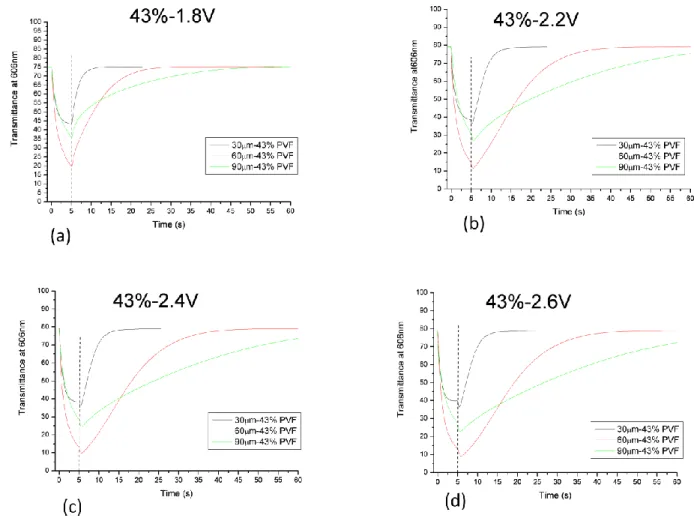
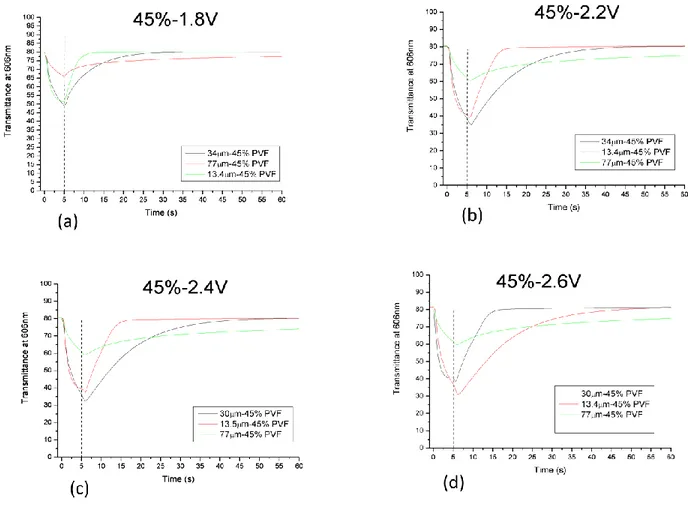
2.2 Results and discussion
In order to study the effect of the concentration of the different components and the effect of the thickness on the films EC under object of study, we have prepared six different mixtures containing different amounts of polymer and solvent.
sample name 35% 37% 40% 43% 45% 50%
PVF (poly(vinil formal) 35% 37% 40% 43% 45% 50% Ev (ethyl viologen diperchlorate) 4% 4% 4% 4% 4% 4%
HQ (hydroquinone) 2% 2% 2% 2% 2% 2%
PC (propylen carbonate) 59% 57% 54% 51% 49% 44% TABLE N.1