Article
Electrolyzer Performance Analysis of an Integrated
Hydrogen Power System for Greenhouse Heating.
A Case Study
Simone Pascuzzi *, Alexandros Sotirios Anifantis, Ileana Blanco and Giacomo Scarascia Mugnozza
Department of Agricultural and Environmental Science (DiSAAT), University of Bari Aldo Moro, Via Amendola, 165/A, 70126 Bari, Italy; [email protected] (A.S.A.);
[email protected] (I.B.); [email protected] (G.S.M.) * Correspondence: [email protected]; Tel./Fax: +39-080-544-2214 Academic Editor: Marc A. Rosen
Received: 23 April 2016; Accepted: 28 June 2016; Published: 5 July 2016
Abstract:A greenhouse containing an integrated system of photovoltaic panels, a water electrolyzer, fuel cells and a geothermal heat pump was set up to investigate suitable solutions for a power system based on solar energy and hydrogen, feeding a self-sufficient, geothermal-heated greenhouse. The electricity produced by the photovoltaic source supplies the electrolyzer; the manufactured hydrogen gas is held in a pressure tank. In these systems, the electrolyzer is a crucial component; the technical challenge is to make it work regularly despite the irregularity of the solar source. The focus of this paper is to study the performance and the real energy efficiency of the electrolyzer, analyzing its operational data collected under different operating conditions affected by the changeable solar radiant energy characterizing the site where the experimental plant was located. The analysis of the measured values allowed evaluation of its suitability for the agricultural requirements such as greenhouse heating. On the strength of the obtained result, a new layout of the battery bank has been designed and exemplified to improve the performance of the electrolyzer. The evaluations resulting from this case study may have a genuine value, therefore assisting in further studies to better understand these devices and their associated technologies.
Keywords:greenhouse heating; hydrogen production; renewable energies
1. Introduction
Greenhouses are one of the most innovate expressions of modern agriculture, widespread in many nations, and it is expected for them to expand numerically with vigor in the future, especially in those areas with unfavorable climatic conditions [1]. Greenhouse production still requires large energy inputs; the microclimate conditioning can reach an energy load up to 400 W¨ m´2for heating, lighting and cooling requirements [2–4]. Nevertheless, the great majority of greenhouses depend on fossil fuels and the use of this particular source for greenhouse heating has a major impact on the cost and on the environmental sustainability of vegetable production [5]. In this respect, the geothermal heating systems are economically advantageous, having a lower environmental impact in the agricultural sector, especially for greenhouse heating demands [6–10]. In addition, the solar energy usage in terrestrial conditions is a topic of growing interest in recent years and may be employed for greenhouse heating. The limiting factor of solar energy is obviously linked to non-stability of solar rays falling on the earth’s surface; therefore this renewable energy source is restrained by its intrinsic factor of variability and its unpredictable availability [11]. Although this weak point can be eliminated by storing the solar energy in chemical form, i.e., in accumulative batteries, it is worth mentioning at this point that those batteries per se have both limited lifetime and storage capacity. Alternatively, in
recent years, solar energy accumulative systems in the form of chemical hydrogen energy from water electrolysis have been created to optimize the efficient use of the electric current coming from the solar source and its transformation into pure hydrogen gas. In this case, the hydrogen gas behaves as an energy vector that can store the energy, exceeding the current demand, and with which energy can subsequently be generated by means of fuel cells [12].
Different processes can generate hydrogen but actually hydrogen is produced worldwide by fossil sources employing coal gasification or natural gas reforming processes [13]. The hydrogen can also be obtained by thermic transformation of biomass, such as biomass pyrolysis, and by biological methods such as dark fermentation processes [14–16]. This last method allows hydrogen generation by means of micro-organisms that convert organic matter into acids and alcohols with simultaneous liberation of molecular hydrogen [17]. Water electrolysis is the only method without carbon dioxide emissions into the atmosphere and generates “zero emissions” if associated with electricity produced from renewable sources [18]. The incorporation of an efficient and suitable vector as a secondary power supply also means reducing consumption of imported liquid fossil fuels, and therefore a reduction in environmental pollution [19].
Even if the efficiency of modern photo-converters and water electrolyzers is respectively 20% and 80%, and the overall efficiency of the solar radiant energy transformation process in the chemical energy of hydrogen is 16% [13], hydrogen production systems powered by stand-alone photovoltaic generators are characterized by considerable superiority [20,21]. Indeed, they can be set in areas not yet supplied with an electric grid, avoiding expensive investments for a single electric grid implementation; they will meet local fuel demands, eliminate the transport costs of hydrogen and will contribute even further by improving the standard of living in those rural areas. Furthermore, they can operate reliably under dynamic solar irradiance and dynamic loads even though an economic analysis showed that such systems are far from being cost competitive [22]. Although a lot of research has been carried out thus far on the solar (photovoltaic and wind)-electrolyzer-fuel cell hybrid power systems with back-up hydrogen storage systems in support of the feasibility and reliability of solar hydrogen power systems, they are still currently under development [23,24].
Some studies have investigated the integration of solar hydrogen power systems with greenhouses and have shown that these systems can provide a viable option for powering stand-alone greenhouses [25].
The storage of solar energy in the form of hydrogen (H2) can be the basis for a totally renewable system, aimed at greenhouse heating in a self-sustained way, with photovoltaic, hydrogen produced by electrolysis, and hydrogen-storage and fuel cells connected to a ground source heat pump.
The authors of this paper are carrying out research aimed at investigating the suitable solutions of a power system, based on solar energy (photovoltaic) and hydrogen, supporting a self-sustained greenhouse heated with a geothermal heat pump. A power system formed by photovoltaic panels, alkaline electrolyzer and fuel cell stacks was designed and assembled in order to feed the ground sources heat pump supplying the heating system of an experimental greenhouse. Starting from the heating requirements of an experimental greenhouse operating during the winter season, the research concerns the evaluation of the technical aspects of the ground source heat pump, the hydrogen production and its storage, the photovoltaic system, analysing the connection and the relationships among these members.
In these systems, the electrolyzer is a crucial component with which water is split into hydrogen and oxygen, and the technical challenge is to make it work regularly despite the irregular power coming from solar energy sources [26,27]. Several researchers analysed, through numerical simulation, the operation of alkaline water electrolyzers under both stationary and intermittent conditions [28–31] and solar photovoltaic conditions [32]. These studies were focused on electrolyzers fed with fluctuating power supply and the electrolyser reaction was analysed by monitoring the time variation of the stack voltage, temperature and pressure, current efficiency and the concentrations of hydrogen in oxygen and oxygen in hydrogen. Even the electrolyzer power consumption was studied through mathematical
modelling; the operating voltage was considered as a function of current density and parameters that affect the electrolyzer behaviour, such as temperature, pressure, bubbling and concentration [33]. Conversely, other researchers studied the influence of the structure of the AC/DC converter on the thermal performance of an alkaline water electrolyzer [34].
This paper mainly focuses on the evaluation of the performance and the real energy efficiency of the alkaline electrolyzer employed in the power system for supplying the experimental greenhouse. Operational data were collected under the natural conditions affected by the changeable solar radiant energy at the site of the plant during a winter season, characterized by a maximum value of solar radiation density of 900 W¨ m´2. The tests were carried out on an integrated power system set up with the commercially available arrangement of the electrical connections among the components. The analysis of the measured values allowed evaluation of the real operative achievement of the electrolyzer and its suitability for the agricultural requirements such as greenhouse heating. On the strength of the obtained result, a new layout of the battery bank was planned and exemplified to ameliorate the performance of the electrolyzer. The evaluations ensued by this case study may have a genuine value, therefore assisting in further studies to better understand these devices and their associated technologies.
2. Materials and Methods
The experimental set-up consists of a “solar photovoltaic hydrogen” system powering a low enthalpy geothermal heat pump used for heating a greenhouse through a hot water floor system. The study was carried out at the experimental farm of the University of Bari located in Valenzano (Bari, Southern Italy), latitude 41˝N, where a greenhouse-integrated system composed of photovoltaic panels, an alkaline barometric water electrolyzer, Polymer Electrolyte Membrane (PEM) fuel cell stacks, a plastic greenhouse and a geothermal heat pump were placed. The electricity coming from the solar photovoltaic source (PV) feeds the electrolyzer; the hydrogen gas produced by water electrolysis is then stored in a pressure tank and, when photovoltaic is inactive (both during the night and during the days with overcast sky), it feeds a fuel cell system producing electricity for greenhouse energy demands.
2.1. The Experimental Greenhouse
The power system passive load was the thermal energy requirement of a 48 m2double plastic skin greenhouse. The main structure of the greenhouse, with arched shape roof, was of tubular galvanized steel; glass-reinforced plastic (GRP) corrugated sheets constituted the base and the gable walls, i.e., the East- and West-facing greenhouse surfaces. The covering structure was made of a double film of ethylene vinyl acetate (multi EVA 33 AD AF), having a thickness of 200 µm, with a 4-cm air gap kept under constant pressure by an air fan.
Taking into account the main power losses, the following heat balance allowed estimating the necessary heating power PhG(W) during the winter night time [35]:
PhG“PcG`PvG`PiG (1)
where PcGis the conduction and convection power loss through the greenhouse covering system (W); PvGis the air leakage/power loss from the indoor to outdoor environment (W); PiGis the power loss by radiation from the covering (W).
The greenhouse heat distribution system was made of a black plastic pipe; the heat pump (Model RAA-EF, Riello Company: Legnago, Italy) used R410a as refrigerant fluid circulating inside its circuit and produced an output of 7.0 kW thermal absorbing 1.5 kW of electricity, with energy efficiency (COP) equal to 4.7, according to the technical data provided by its manufacturer.
2.2. The Integrated Power System
The integrated power system was designed with the purpose of using the photovoltaic production both directly, when the photovoltaic energy production and the greenhouse energy demands are simultaneous, and when there is no greenhouse energy demand. This in turn meant that the photovoltaic production can be used for hydrogen production and storage, and the designed passive loads are seasonally dependent.
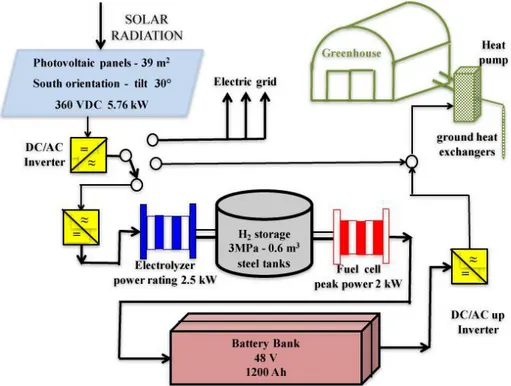
The array of photovoltaic panels consists of 24 modules each having 240 W peak power and maximum operating voltage of 29.64 V. The PV modules have a total area around 39 m2, South-oriented with an elevation angle of 30˝in order to maximize annual energy production (Figure1). Furthermore, the PV modules are grouped into two series of 12 modules each, which are then connected in parallel, in order to achieve a nominal voltage of the array of 360 V. The renewable energy produced by the PV modules is converted to AC power by an inverter in order to feed the water electrolyzer. AC power can also feed the grid.
Sustainability 2016, 8, 629 4 of 14
The array of photovoltaic panels consists of 24 modules each having 240 W peak power and maximum operating voltage of 29.64 V. The PV modules have a total area around 39 m2,
South-oriented with an elevation angle of 30° in order to maximize annual energy production (Figure 1). Furthermore, the PV modules are grouped into two series of 12 modules each, which are then connected in parallel, in order to achieve a nominal voltage of the array of 360 V. The renewable energy produced by the PV modules is converted to AC power by an inverter in order to feed the water electrolyzer. AC power can also feed the grid.
Figure 1. Layout of the integrated power system linked to the geothermal heat pump for greenhouse heating.
The alkaline barometric water electrolyzer, analysed in this study, is of patented design VOLTIANA®, linked to an international patent technology by Casale Chemical [36]. The electrolyzer
is made of 33 bipolar circular cells connected in series that constitute the cell stack; each cell, comprising an anode and a cathode separated by a membrane, has an active area of 10−4 m2. The cells
are fitted with frames containing channels for the distribution of the electrolyte and further channels for the collection of the electrolysis products [36]. According to the data of the manufacturer, the rated hydrogen production is 0.5 Nm3·h−1 at the following operational parameters: maximum pressure: 3
MPa; temperature: 80 °C; stack voltage: 62.04 V; current intensity: 40 A. The electrolyte is a stationary 25%–30% wt KOH solution. The electrolyzer is supplied by means of an electric power supply (3.5 kW-230 VAC) basically consisting of an air-cooled transformer-rectifying capability, which converts the AC current into DC current. The electrolyzer is able to operate from 20% to 100% of its power rating, which is 2.5 kW.
Hydrogen and oxygen generated in the cell stack exit by entraining to separating vessels for hydrogen and oxygen, whereas the gas phase separates out from the liquid phase, which is restored back to the cell stack. The two gases are filtered and cross final droplet separators before being delivered from the unit. Hydrogen is routed through a backpressure controller; oxygen is vented to the atmosphere. The produced pressurised hydrogen (30 bar) is stored in two steel tanks of 0.6 m3.
Furthermore, the hybrid system is comprised of remaining auxiliary components that altogether require a constant electric power Paux = 0.6 kW for their operation.
The proton exchange membrane (PEM) fuel cell system has a peak power of 2 kW. It requires industrial grade hydrogen (99.95%) and oxygen (air) and has as by-products, pure water/vapor and heat. The output voltage is 48 VDC and the consumption is 30 slpm (standard liters per minute) at 2
Figure 1. Layout of the integrated power system linked to the geothermal heat pump for greenhouse heating.
The alkaline barometric water electrolyzer, analysed in this study, is of patented design VOLTIANA®, linked to an international patent technology by Casale Chemical [36]. The electrolyzer is made of 33 bipolar circular cells connected in series that constitute the cell stack; each cell, comprising an anode and a cathode separated by a membrane, has an active area of 10´4 m2. The cells are fitted with frames containing channels for the distribution of the electrolyte and further channels for the collection of the electrolysis products [36]. According to the data of the manufacturer, the rated hydrogen production is 0.5 Nm3¨h´1at the following operational parameters: maximum pressure: 3 MPa; temperature: 80˝C; stack voltage: 62.04 V; current intensity: 40 A. The electrolyte is a stationary 25%–30% wt KOH solution. The electrolyzer is supplied by means of an electric power supply (3.5 kW-230 VAC) basically consisting of an air-cooled transformer-rectifying capability, which converts the AC current into DC current. The electrolyzer is able to operate from 20% to 100% of its power rating, which is 2.5 kW.
Hydrogen and oxygen generated in the cell stack exit by entraining to separating vessels for hydrogen and oxygen, whereas the gas phase separates out from the liquid phase, which is restored back to the cell stack. The two gases are filtered and cross final droplet separators before being delivered from the unit. Hydrogen is routed through a backpressure controller; oxygen is vented to the atmosphere. The produced pressurised hydrogen (30 bar) is stored in two steel tanks of 0.6 m3. Furthermore, the hybrid system is comprised of remaining auxiliary components that altogether require a constant electric power Paux= 0.6 kW for their operation.
The proton exchange membrane (PEM) fuel cell system has a peak power of 2 kW. It requires industrial grade hydrogen (99.95%) and oxygen (air) and has as by-products, pure water/vapor and heat. The output voltage is 48 VDC and the consumption is 30 slpm (standard liters per minute) at 2 kW (operation temperatures 0–46˝C). The energy produced by the fuel cells is affected by the kinetics of the chemical reaction, which involves the hydrogen and oxygen, and by the irreversibilities, such as activation losses, internal currents, ohmic losses in the electrodes and in the membrane, and mass transport or concentration losses [12]. The current coming from the fuel cells is then employed to charge a battery bank consisting of eight 12V cells connected in both series and in parallel, providing a global energy of 1200 Ah. Another inverter is connected to the battery terminals in order to be used as a stand-alone sinusoidal AC voltage provider. A programmable logic controller manages all the processes and safety of the system.
2.3. Theoretical Foundations of the Electrolyzer Working Conditions
The following electrochemical reaction concerning the water splitting into hydrogen and oxygen takes place when a suitable DC electric current is applied to the electrodes [34]:
H2O ` electrical energy ñ O2`H2 (2)
Equation (2) is endothermic and the overall variation of enthalpy∆H and entropy T∆S can be calculated considering both the differences between the products (H2and O2) and the reactants (H2O). The variation in enthalpy and entropy is linked to the variation of Gibbs energy∆G through the following [36]:
∆H “ ∆G ` T¨ ∆S (3)
The variation of Gibbs energy∆G represents the required minimum reversible work to decompose water while the overall change of enthalpy∆H is the amount of energy needed in water electrolysis. The difference between∆H and ∆G is supplied as heat (T¨ ∆S).
At standard temperature and pressure (respectively, 298 K and 105N¨ m´2), the variation of enthalpy∆H˝and Gibbs energy∆G˝can be evaluated with reference to pure hydrogen (H
2), oxygen (O2), and water (H2O), supposing hydrogen and oxygen work as ideal gases and water works as an incompressible fluid:∆H˝= 286 kJ¨ mol´1;∆G˝= 237 kJ¨ mol´1[2].∆H˝and∆G˝are also indicated, respectively, as higher heating value (HHV) and lower heating value (LHV) of hydrogen [33].
Furthermore, the Faraday law allows relating the required electrical energy for decomposing water to the chemical conversion rate in molar quantities, and then the reversible potential U0revto perform the electrolysis of water is given by:
Urev0 “∆G 0 n¨ F “
237000
2¨ 96485 “1.23 V (4)
where n is the number of charges transferred per hydrogen molecule (n = 2) and F is Faraday’s constant (96,485 C¨ mol´1). Conversely the thermoneutral potential Utn0 is connected to the overall change in enthalpy∆H through the equation [37]:
Utn0 “∆H 0 n¨ F “
286000
An increase in temperature produces a slight decrease in the reversible potential Urev(Urevp80˝C,100kPaq “1.184 V), while the thermoneutral potential Utn can be considered constant
or expressed as a parabolic function of temperature with relative deviation lesser than 2% for a temperature up to 80˝C (U
tnp80˝C,100kPaq“1.473 V); the pressure increase produces a slight increase in
UrevpUrevp25˝C,3MPaq“1.1295 V), whereas Utnremains constant [38].
The actual working electric potential of an electrolysis cell Ucis always higher than the reversible potential owing to the process irreversibility and, as a result, water electrolysis is accompanied by the release of heat despite being an endothermic process [39]. The waste heat maintains stable with the electrolysis temperature and it is produced at a rate directly proportional to the difference between the actual cell potential Ucand the thermoneutral voltage Utn:
Pwh“Iel¨ pUc´Utnq (6)
where Pwhis the power dissipated as heat in a water electrolysis cell operating with an electric current Ieland a difference of potential Ucbetween anode and cathode [34].
On the other hand, the required power Prby the electrolyzer for its working is [40]:
Pr“Uc¨Nc¨Iel“U¨ Iel (7)
where U is the voltage supplied to the electrolyzer. According to Faraday’s law, the production rate of hydrogen in an electrolyzer is proportional to the transfer rate of electrons at the electrodes, which in turn is equivalent to the electrical current in the external circuit. Therefore, the overall hydrogen production rate QH2 (Nm
3¨h´1) in the electrolyzer formed with N
c cells connected in series and a Faradic efficiency ηF, can be calculated considering an ideal gas molar volume of 22.414 ˆ 10´3m3¨mol´1at standard temperature of 273 K and pressure of 105N¨ m´2[18,40]:
QH2 “80.69¨ ηF¨
Nc¨Iel
n¨ F “80.69¨ ηF¨ Nc¨Pr
U¨ n¨ F (8)
The Faradic efficiency is a way to assess the electrolysis system and it is defined as the ratio between the effective and theoretical maximum amount of hydrogen produced in the electrolyzer. It is often called current efficiency because it is linked to parasitic current losses along the gas ducts. Lower Faradic efficiencies are caused by an increase in temperature that produces less resistance and more parasitic current losses.
A commonly used way of expressing the electrolysis system is the energy efficiency or thermal efficiency ηTassessed as [38]:
ηT“ ∆H 0
∆H (9)
This is defined as the ratio between the change in enthalpy corresponding to the thermoneutral potential Utn0 and the one corresponding to the actual potential Uc. In other words, ηTis evaluated by the ratio between the specific energy consumption, with respect to HHV, and the actual specific energy consumption (MJ¨ Nm´3). Therefore, for ηT “1 the electrolyzer would consume 10.58 MJ for each Nm´3of produced hydrogen.
2.4. Experimental Analysis
The performance of the electrolyzer within the experimental plant was evaluated during a trial period of 6 months from October 2013 to March 2014 using only the electrical power supplied by the PV modules. Thus, the electrolyzer worked only during the daytime, and its performance was irrational because of the unstable solar radiation. In detail, the electrolyzer started its hydrogen production cycle only when the available electric power Pavwas higher than the 20% of its power rating. A suitable
control system provided the calculation of the usable electric power Pavcoming from the PV modules through the following equation:
Pav“PPV´Pgp´Paux (10)
where PPVwas the power produced by the PV modules; Pgpis the required power for the working of the geothermal heat pump used for heating a greenhouse and Pauxis the appropriate power for the other auxiliary parts of the plant.
The electrolyzer started the electrolysis process when the available electric power Pavachieved the aforesaid threshold value but the hydrogen production took place properly only when the pressure inside the electrolyzer was higher than 2.8 MPa; moreover, the safety system stopped the electrolysis process if the pressure was higher than 3 MPa [41]. Alternatively, another safety system ended the process if the hydrogen had a higher oxygen content than the law limit in force. Finally, before each start and stop of the electrolyzer, a purging process of the plant was carried out using inert gas (nitrogen) in order to eliminate the air and, under special anomalous conditions, the process gases were automatically removed by an injection of nitrogen. These restraints further affected the actual working time of hydrogen production that was usually less than the daytime in which the disposable electric power Pavwas able to supply the electrolyzer suitably.
In this realistic scenario, the values of the hydrogen production rate QH2 and the corresponding
required electric power Prwere collected by means of an inline mass flow meter installed on the output pipeline of the hydrogen purification unit, and a voltmeter-ammeter assembled on the electric feeder of the electrolyzer. The controller Horner PLC XL6 OCS processed the electrical signals coming from these devices with a sampling frequency of 1 min; the controller, equipped with a graphical touch sensing LCD display, was programmed to adjust and monitor the process parameters in order to maintain a safe and efficient operation. The process conditions of temperature, pressure and liquid levels, as well as the power supply conditions represented input data for the controller, which generated output signals directed to the proper control devices.
Within the aim of this paper, the main component of the measure chain was the thermal mass flow meter Bronkhorst model Select MFM F-111BI, which allowed measuring the mass flow or standard volumetric flow, irrespective of pressure and temperature. A stainless steel capillary tube with resistant thermometer elements formed its sensor. A part of the gas flowed through this bypass sensor and was warmed up by two different heating elements, which produced two different measured temperatures drifting apart. The difference between these two temperatures was directly proportional to mass flow through the sensor. The thermal mass flow meter implemented the standard RS232 and its main technical characteristics were: accuracy: standard ˘ 0.5% Rd(Reading) plus ˘ 0.1% FS (Full Scale); turndown: 1:50; repeatability: <0.2% Rd; temperature sensitivity: zero: <0.05% FS/˝C, span: <0.05% Rd/˝C; pressure sensitivity: 0.01% Rd/100 kPa typical hydrogen.
3. Results and Discussion
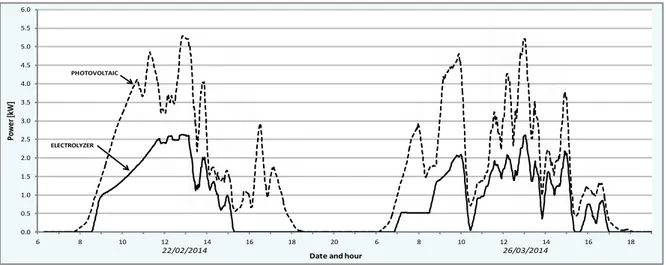
The 6-month trial period in Valenzano was characterized by either cloudy or clear sky that remarkably affected the performance of the photovoltaic panels and, consequently, of the electrolyzer. Figure2reports as an example, the photovoltaic electrical production and the power required by the electrolyzer during two days (22 February 2014–26 March 2014) characterized by a partially cloudy sky. Only two days have been chosen, randomly, to graphically better highlight the fluctuating trend and the maximum values of the photovoltaic power production and the fluctuating trend of the electrolyzer required power during the months examined; however, the described days can be considered representative of the test period.
Conversely, the trend of the cumulative solar radiation relevant to the test period is shown in Figure3, which also shows the collected air temperature (minimum, maximum and average) values. The standard deviations of the temperature mean values varied in the range 1.3–4.8˝C, due to the daily temperature variations. Data shown in Figure3are consistent with data collected on the site in the same semesters of previous years.
Sustainability 2016, 8, 629 8 of 15
output pipeline of the hydrogen purification unit, and a voltmeter-ammeter assembled on the electric feeder of the electrolyzer. The controller Horner PLC XL6 OCS processed the electrical signals coming from these devices with a sampling frequency of 1 min; the controller, equipped with a graphical touch sensing LCD display, was programmed to adjust and monitor the process parameters in order to maintain a safe and efficient operation. The process conditions of temperature, pressure and liquid levels, as well as the power supply conditions represented input data for the controller, which generated output signals directed to the proper control devices.
Within the aim of this paper, the main component of the measure chain was the thermal mass flow meter Bronkhorst model Select MFM F-111BI, which allowed measuring the mass flow or standard volumetric flow, irrespective of pressure and temperature. A stainless steel capillary tube with resistant thermometer elements formed its sensor. A part of the gas flowed through this bypass sensor and was warmed up by two different heating elements, which produced two different measured temperatures drifting apart. The difference between these two temperatures was directly proportional to mass flow through the sensor. The thermal mass flow meter implemented the standard RS232 and its main technical characteristics were: accuracy: standard ± 0.5% Rd (Reading)
plus ± 0.1% FS (Full Scale); turndown: 1:50; repeatability: <0.2% Rd; temperature sensitivity: zero:
<0.05% FS/°C, span: <0.05% Rd/°C; pressure sensitivity: 0.01% Rd/100 kPa typical hydrogen. 3. Results and Discussion
The 6-month trial period in Valenzano was characterized by either cloudy or clear sky that remarkably affected the performance of the photovoltaic panels and, consequently, of the electrolyzer. Figure 2 reports as an example, the photovoltaic electrical production and the power required by the electrolyzer during two days (22 February 2014–26 March 2014) characterized by a partially cloudy sky. Only two days have been chosen, randomly, to graphically better highlight the fluctuating trend and the maximum values of the photovoltaic power production and the fluctuating trend of the electrolyzer required power during the months examined; however, the described days can be considered representative of the test period.
Figure 2. Photovoltaic power production and electrolyzer-required power.
Conversely, the trend of the cumulative solar radiation relevant to the test period is shown in Figure 3, which also shows the collected air temperature (minimum, maximum and average) values. The standard deviations of the temperature mean values varied in the range 1.3–4.8 °C, due to the daily temperature variations. Data shown in Figure 3 are consistent with data collected on the site in the same semesters of previous years.
0.0 0.5 1.0 1.5 2.0 2.5 3.0 3.5 4.0 4.5 5.0 5.5 6.0 6 8 10 12 14 16 18 20 6 8 10 12 14 16 18 Po w er [k W ]
Date and hour
22/02/2014 26/03/2014
ELECTROLYZER PHOTOVOLTAIC
Figure 2.Photovoltaic power production and electrolyzer-required power.
Sustainability 2016, 8, 629 8 of 14
Figure 3. External solar radiation and air temperature mean values—with related standard deviation—collected during the trial period.
During the trial period, the electrolyzer produced hydrogen ready to be stored for 180 hours with a very unstable hydrogen production rate, varying from 0.05 Nm3·h−1 to 0.5 Nm3·h−1. The
distribution of this effective working time among the different hydrogen rates is reported in the histogram of Figure 4 where the overall range 0.05–0.5 Nm3·h−1 is split into ranges of size 0.05 Nm3·h−1
and for each of them, the percentage ratio between the corresponding employed actual time and the overall working time of the electrolyzer is shown. Data in Figure 4 are characterized by a standard deviation of 3.44 and a coefficient of variation of 31%.
Figure 4. Effective working time percentages of the electrolyzer as a function of the different produced H2 rates.
The graph (Figure 4) shows that the electrolyzer always operated under fluctuating input current because it produced hydrogen at the highest allowed flow rate (range 0.4–0.5 Nm3·h−1) only
for the 33.1% of the overall time and in any case, the ratio in all the considered ranges is only between 7.0% (0.10–0.15 Nm3·h−1) and 16.9% (0.45–0.50 Nm3·h−1). The electrolyzer always worked in a transient
Figure 3. External solar radiation and air temperature mean values—with related standard deviation—collected during the trial period.
During the trial period, the electrolyzer produced hydrogen ready to be stored for 180 hours with a very unstable hydrogen production rate, varying from 0.05 Nm3¨h´1to 0.5 Nm3¨h´1. The distribution of this effective working time among the different hydrogen rates is reported in the histogram of Figure4where the overall range 0.05–0.5 Nm3¨h´1is split into ranges of size 0.05 Nm3¨h´1and for each of them, the percentage ratio between the corresponding employed actual time and the overall working time of the electrolyzer is shown. Data in Figure4are characterized by a standard deviation of 3.44 and a coefficient of variation of 31%.
The graph (Figure4) shows that the electrolyzer always operated under fluctuating input current because it produced hydrogen at the highest allowed flow rate (range 0.4–0.5 Nm3¨h´1) only for the 33.1% of the overall time and in any case, the ratio in all the considered ranges is only between 7.0% (0.10–0.15 Nm3¨h´1) and 16.9% (0.45–0.50 Nm3¨h´1). The electrolyzer always worked in a transient state with endless fluctuations of the hydrogen production but during the days characterized by a
Sustainability 2016, 8, 629 9 of 15
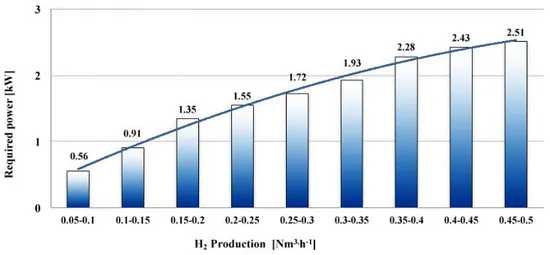
partially overcast or cloudy sky, the effectiveness of the electrolyzer was intermittent with periods in which the hydrogen production was greatly reduced or in fact, cut off. These temperamental conditions took place repeatedly during the daylight hours and caused low working periods of the electrolyzer. Before each cycle/restart, the plant needed to be cleansed with nitrogen and then had to wait until the pressure inside the electrolyzer reached the threshold value of 2.8 MPa. On the contrary, during the days characterized by a clear sky, the electrolyzer worked continuously even if the hydrogen production was affected by the solar radiation. Moreover, the measured required power increased with the increase in the hydrogen rate flow (Figure5), even if these two quantities were not directly proportional due to the changeability of the Faradic efficiency ηF, which in turn was affected by the operational conditions of the electrolyzer. Nevertheless, the measured required power showed a high linearity versus the H2rate flow. Indeed, a coefficient of determination R2= 0.99178 is obtained fitting these data through the following least squares second-degree polynomial:
Pr “ ´0.0145¨ Q2H2`0.3886¨ QH2`0.2082 (11)
Figure 3. External solar radiation and air temperature mean values—with related standard deviation—collected during the trial period.
During the trial period, the electrolyzer produced hydrogen ready to be stored for 180 hours with a very unstable hydrogen production rate, varying from 0.05 Nm3·h−1 to 0.5 Nm3·h−1. The
distribution of this effective working time among the different hydrogen rates is reported in the histogram of Figure 4 where the overall range 0.05–0.5 Nm3·h−1 is split into ranges of size 0.05 Nm3·h−1
and for each of them, the percentage ratio between the corresponding employed actual time and the overall working time of the electrolyzer is shown. Data in Figure 4 are characterized by a standard deviation of 3.44 and a coefficient of variation of 31%.
Figure 4. Effective working time percentages of the electrolyzer as a function of the different produced H2 rates.
The graph (Figure 4) shows that the electrolyzer always operated under fluctuating input current because it produced hydrogen at the highest allowed flow rate (range 0.4–0.5 Nm3·h−1) only
for the 33.1% of the overall time and in any case, the ratio in all the considered ranges is only between 7.0% (0.10–0.15 Nm3·h−1) and 16.9% (0.45–0.50 Nm3·h−1). The electrolyzer always worked in a transient
Figure 4.Effective working time percentages of the electrolyzer as a function of the different produced H2rates.
Sustainability 2016, 8, 629 9 of 14
state with endless fluctuations of the hydrogen production but during the days characterized by a partially overcast or cloudy sky, the effectiveness of the electrolyzer was intermittent with periods in which the hydrogen production was greatly reduced or in fact, cut off. These temperamental conditions took place repeatedly during the daylight hours and caused low working periods of the electrolyzer. Before each cycle/restart, the plant needed to be cleansed with nitrogen and then had to wait until the pressure inside the electrolyzer reached the threshold value of 2.8 MPa. On the contrary, during the days characterized by a clear sky, the electrolyzer worked continuously even if the hydrogen production was affected by the solar radiation. Moreover, the measured required power increased with the increase in the hydrogen rate flow (Figure 5), even if these two quantities were not directly proportional due to the changeability of the Faradic efficiency 𝜂𝐹, which in turn was affected
by the operational conditions of the electrolyzer. Nevertheless, the measured required power showed a high linearity versus the H2 rate flow. Indeed, a coefficient of determination R2 = 0.99178 is obtained
fitting these data through the following least squares second-degree polynomial:
𝑃𝑟= −0.0145 · 𝑄𝐻22+ 0.3886 · 𝑄𝐻2+ 0.2082 (11)
Figure 5. Measured required power by the electrolyzer as a function of its produced H2 rate.
The Faradic efficiency 𝜂𝐹, evaluated by means of Equation (8), is reported in Figure 6. Probably
this result is due to the working manner of the electrolyzer, which had to continuously adjust itself to the changeable operational conditions without ever reaching steady–state requirements. Furthermore, the mathematical model outlined by Equation (8) allows only an approximate approach that does not consider the physical state of the electrolyzer (pressure, temperature, bubbling, electrolyte concentration, etc.) therefore, we cannot evaluate appropriately the correlation between hydrogen rate flow and the required stack power in transient regimens.
Figure 6. Faradic efficiency of the electrolyzer as a function of its produced H2 rate.
Figure 5.Measured required power by the electrolyzer as a function of its produced H2rate.
The Faradic efficiency ηF, evaluated by means of Equation (8), is reported in Figure6. Probably this result is due to the working manner of the electrolyzer, which had to continuously adjust itself to the
Sustainability 2016, 8, 629 10 of 15
changeable operational conditions without ever reaching steady–state requirements. Furthermore, the mathematical model outlined by Equation (8) allows only an approximate approach that does not consider the physical state of the electrolyzer (pressure, temperature, bubbling, electrolyte concentration, etc.) therefore, we cannot evaluate appropriately the correlation between hydrogen rate flow and the required stack power in transient regimens.
state with endless fluctuations of the hydrogen production but during the days characterized by a partially overcast or cloudy sky, the effectiveness of the electrolyzer was intermittent with periods in which the hydrogen production was greatly reduced or in fact, cut off. These temperamental conditions took place repeatedly during the daylight hours and caused low working periods of the electrolyzer. Before each cycle/restart, the plant needed to be cleansed with nitrogen and then had to wait until the pressure inside the electrolyzer reached the threshold value of 2.8 MPa. On the contrary, during the days characterized by a clear sky, the electrolyzer worked continuously even if the hydrogen production was affected by the solar radiation. Moreover, the measured required power increased with the increase in the hydrogen rate flow (Figure 5), even if these two quantities were not directly proportional due to the changeability of the Faradic efficiency 𝜂𝐹, which in turn was affected
by the operational conditions of the electrolyzer. Nevertheless, the measured required power showed a high linearity versus the H2 rate flow. Indeed, a coefficient of determination R2 = 0.99178 is obtained
fitting these data through the following least squares second-degree polynomial:
𝑃𝑟= −0.0145 · 𝑄𝐻22+ 0.3886 · 𝑄𝐻2+ 0.2082 (11)
Figure 5. Measured required power by the electrolyzer as a function of its produced H2 rate.
The Faradic efficiency 𝜂𝐹, evaluated by means of Equation (8), is reported in Figure 6. Probably
this result is due to the working manner of the electrolyzer, which had to continuously adjust itself to the changeable operational conditions without ever reaching steady–state requirements. Furthermore, the mathematical model outlined by Equation (8) allows only an approximate approach that does not consider the physical state of the electrolyzer (pressure, temperature, bubbling, electrolyte concentration, etc.) therefore, we cannot evaluate appropriately the correlation between hydrogen rate flow and the required stack power in transient regimens.
Figure 6. Faradic efficiency of the electrolyzer as a function of its produced H2 rate.
Figure 6.Faradic efficiency of the electrolyzer as a function of its produced H2rate.
The Faradic efficiency was higher than 90% for hydrogen production greater than 0.4 Nm3¨h´1 (Figure6) and under these operational conditions, the power required by the electrolyzer was close to its power rating of 2.5 kW (Figure5). The energy efficiency, or thermal efficiency ηT, of the electrolyzer under test was evaluated by means of Equation (9) and is reported in the histogram of Figure7. The model linked to this equation is rough because the change in enthalpy∆H˝is evaluated at a standard temperature and pressure and assuming that hydrogen is an ideal gas and water is an incompressible fluid; furthermore, its accuracy is affected by the experimental measurements. Nevertheless, this empirical approach allows us to estimate the electrolyzer performance, and to note that the energy efficiency of the electrolyzer increased in terms of 45% (from 0.46 to 0.67) in the range 0.05–0.5 Nm3¨h´1of the hydrogen flow rate (Figure7). The greater values of energy efficiency were linked to the highest hydrogen production rates even if these two quantities were not directly proportional because its efficiency had continuous peaks and troughs as the hydrogen flow rate increased. These registered values support the aforementioned working behaviour of the electrolyzer.
Sustainability 2016, 8, 629 10 of 14
The Faradic efficiency was higher than 90% for hydrogen production greater than 0.4 Nm3·h−1
(Figure 6) and under these operational conditions, the power required by the electrolyzer was close to its power rating of 2.5 kW (Figure 5). The energy efficiency, or thermal efficiency 𝜂𝑇, of the
electrolyzer under test was evaluated by means of Equation (9) and is reported in the histogram of Figure 7. The model linked to this equation is rough because the change in enthalpy ΔH° is evaluated at a standard temperature and pressure and assuming that hydrogen is an ideal gas and water is an incompressible fluid; furthermore, its accuracy is affected by the experimental measurements. Nevertheless, this empirical approach allows us to estimate the electrolyzer performance, and to note that the energy efficiency of the electrolyzer increased in terms of 45% (from 0.46 to 0.67) in the range 0.05–0.5 Nm3·h−1 of the hydrogen flow rate (Figure 7). The greater values of energy efficiency were
linked to the highest hydrogen production rates even if these two quantities were not directly proportional because its efficiency had continuous peaks and troughs as the hydrogen flow rate increased. These registered values support the aforementioned working behaviour of the electrolyzer.
Figure 7. Electrolyzer energy efficiency vs. H2 production.
Similar results are common in literature when testing hybrid systems comprising photovoltaic panels and electrolyzer combinations [42]. The average energy efficiency of an alkaline electrolyzer of 5 kW set-up in Zollbruck, Switzerland, inside a domestic system, was 62%, evaluated over three summer days. Furthermore, after a morning with clear sky conditions, the first clouds in the afternoon caused strong current variations in the electrolyzer [31]. Good results in terms of energy efficiency of the electrolyzer with nearly all kinds of solar radiation profiles were obtained in a hybrid system set-up in California, USA, used for aquarium aeration; the system was formed by 9.2 kW PV and a medium pressure bipolar alkaline PEM electrolyzer and was tested during 11 months. The electrolyzer energy efficiency was higher than 75% for more than 70% of daily averages and results of a single day operations point out an average Faraday efficiency of 96% apart from starting and ending hours, when the electrolyzer cycled on and off due to insufficient input current [43]. Furthermore, according to testing results of a hybrid system built to provide electrical and thermal power to offices and residential units, it was pointed out that on/off cycling of the electrolyser may cause degradation of the cell electrode catalyst and, in view of the very rapid variations of power coming from the photovoltaic panels, it was considered careful to employ advanced batteries to provide short-term energy storage and minimise cycling of the electrolyser [44]. Also Zini and Tartarini [42], who briefly analysed several case-studies, reported that, since the electrolyzer can be switched on and off frequently if input current is highly variable, some back-up systems should be considered to stabilize electrolyzer input power in order to increase overall system performance.
The acquired results highlight that the electrolyzer under study did not work efficiently because of the irregular power from the solar energy. Consequently, this did not allow a suitable storage of pressured hydrogen inside the steel tanks. It needs then to avoid shutdowns of the H2 production,
Similar results are common in literature when testing hybrid systems comprising photovoltaic panels and electrolyzer combinations [42]. The average energy efficiency of an alkaline electrolyzer of 5 kW set-up in Zollbruck, Switzerland, inside a domestic system, was 62%, evaluated over three summer days. Furthermore, after a morning with clear sky conditions, the first clouds in the afternoon caused strong current variations in the electrolyzer [31]. Good results in terms of energy efficiency of the electrolyzer with nearly all kinds of solar radiation profiles were obtained in a hybrid system set-up in California, USA, used for aquarium aeration; the system was formed by 9.2 kW PV and a medium pressure bipolar alkaline PEM electrolyzer and was tested during 11 months. The electrolyzer energy efficiency was higher than 75% for more than 70% of daily averages and results of a single day operations point out an average Faraday efficiency of 96% apart from starting and ending hours, when the electrolyzer cycled on and off due to insufficient input current [43]. Furthermore, according to testing results of a hybrid system built to provide electrical and thermal power to offices and residential units, it was pointed out that on/off cycling of the electrolyser may cause degradation of the cell electrode catalyst and, in view of the very rapid variations of power coming from the photovoltaic panels, it was considered careful to employ advanced batteries to provide short-term energy storage and minimise cycling of the electrolyser [44]. Also Zini and Tartarini [42], who briefly analysed several case-studies, reported that, since the electrolyzer can be switched on and off frequently if input current is highly variable, some back-up systems should be considered to stabilize electrolyzer input power in order to increase overall system performance.
The acquired results highlight that the electrolyzer under study did not work efficiently because of the irregular power from the solar energy. Consequently, this did not allow a suitable storage of pressured hydrogen inside the steel tanks. It needs then to avoid shutdowns of the H2production, which require significant idle times before restarting. In this regard, Little et al. [44] reported that when the electrolyzer is switched off, hydrogen in the cathode causes the potential of the cell stack to reverse, generating corrosion of the cell membranes and reducing the lifetime of the electrolyzer, even if a minimum current is also imposed to maintain the hydrogen gas purity. These operational constraints of the electrolyzer require some form of short-term energy storage to smooth the short-term fluctuations in electrical input. A different arrangement of the integrated power system could stem or reduce those drawbacks even if further testing will be necessary to evaluate the feasibility of this new technical solution. The battery bank able to supply 1200 Ah could be alternatively charged by the fuel cell or by the PV modules (Figure8). With conviction, the energy from PV daytime affected by the solar radiation, should be accumulated by the battery bank; thus, there will be a continuous feed of current to the electrolyzer. Using the connections shown in the arrangement of Figure8a, the current coming from the AC/DC rectifier, affected by changeable performance of the photovoltaic panels, feeds the battery bank, which in turn is able to continuously power the electrolyzer. Therefore, this device would operate correctly and produce a suitable flow rate of unbroken hydrogen stored inside the tanks. Meanwhile, the same bank linked to the fuel cell and to the DC/AC up inverter would furnish the geothermal heat pump. Employing the links reported in the arrangement of Figure8b, the nonconstant current produced by the fuel cells is stored inside the battery bank, which now is connected to the DC/AC inverter and is able to continuously power the geothermal heat pump. This new layout of the bank battery will be adopted in future tests and the performance of an integrated power system will be evaluated once again during an autumnal-wintry trial period using only the electrical power supplied by the PV modules.
The proposed improvement solution stems from the positive results of a study carried out through simulations on the on/off-switching of the electrolyzer and fuel cell in an integrated power system that employed a battery as a short-term energy buffer [12].
Sustainability 2016, 8, 629 12 of 15
which require significant idle times before restarting. In this regard, Little et al. [44] reported that when the electrolyzer is switched off, hydrogen in the cathode causes the potential of the cell stack to reverse, generating corrosion of the cell membranes and reducing the lifetime of the electrolyzer, even if a minimum current is also imposed to maintain the hydrogen gas purity. These operational constraints of the electrolyzer require some form of term energy storage to smooth the short-term fluctuations in electrical input. A different arrangement of the integrated power system could stem or reduce those drawbacks even if further testing will be necessary to evaluate the feasibility of this new technical solution. The battery bank able to supply 1200 Ah could be alternatively charged by the fuel cell or by the PV modules (Figure 8). With conviction, the energy from PV daytime affected by the solar radiation, should be accumulated by the battery bank; thus, there will be a continuous feed of current to the electrolyzer. Using the connections shown in the arrangement of Figure 8a, the current coming from the AC/DC rectifier, affected by changeable performance of the photovoltaic panels, feeds the battery bank, which in turn is able to continuously power the electrolyzer. Therefore, this device would operate correctly and produce a suitable flow rate of unbroken hydrogen stored inside the tanks. Meanwhile, the same bank linked to the fuel cell and to the DC/AC up inverter would furnish the geothermal heat pump. Employing the links reported in the arrangement of Figure 8b, the nonconstant current produced by the fuel cells is stored inside the battery bank, which now is connected to the DC/AC inverter and is able to continuously power the geothermal heat pump. This new layout of the bank battery will be adopted in future tests and the performance of an integrated power system will be evaluated once again during an autumnal-wintry trial period using only the electrical power supplied by the PV modules.
The proposed improvement solution stems from the positive results of a study carried out through simulations on the on/off-switching of the electrolyzer and fuel cell in an integrated power system that employed a battery as a short-term energy buffer [12].
Figure 8. Modified arrangement of the integrated power system. Battery bank connected to: (a) the electrolyzer; (b) the fuel cell.
4. Conclusions
The results obtained in these first trials allow some remarks about the performance and efficiency of the alkaline barometric water electrolyzer within a greenhouse-integrated stand-alone heating system including photovoltaic panels, hydrogen storage, fuel cell stacks and geothermal heat pump, even if further experimental tests are required to better assess the electrolyser’s achievement: The electrical power supplied by the PV modules was greatly affected by the very unstable solar
radiation current during the test period;
The electrolyzer worked without stopping during the days characterized by clear sky even if the hydrogen production was affected by the daytime variability of the solar radiation;
Figure 8.Modified arrangement of the integrated power system. Battery bank connected to: (a) the electrolyzer; (b) the fuel cell.
4. Conclusions
The results obtained in these first trials allow some remarks about the performance and efficiency of the alkaline barometric water electrolyzer within a greenhouse-integrated stand-alone heating system including photovoltaic panels, hydrogen storage, fuel cell stacks and geothermal heat pump, even if further experimental tests are required to better assess the electrolyser’s achievement:
‚ The electrical power supplied by the PV modules was greatly affected by the very unstable solar radiation current during the test period;
‚ The electrolyzer worked without stopping during the days characterized by clear sky even if the hydrogen production was affected by the daytime variability of the solar radiation;
‚ The electrolyzer worked continuously in a transient state producing fluctuations of the hydrogen production, never reaching the steady–state conditions.
The performance of the electrolyzer could be improved by changing the arrangement of the batteries bank so the electrolyzer could be alternatively charged by the fuel cell or by the PV modules. The resolution does not require expensive technical modifications but needs further testing to evaluate its feasibility and integrity. Moreover, the whole integrated power system is still in its developmental stage, and it will have to go through a rigorous evaluation procedure that will take into consideration its economic efficiency when feeding the geothermal heat pump for greenhouse heating.
Acknowledgments:The present work has been carried out under the project “Integrated production of energy from renewable sources within the Apulia Region (Italy) agricultural-industrial system—Networks of public research laboratories” (project code RTL 01) co-funded by the Apulia Region under the “Agreement of Framework Program concerning the Scientific Research—PO Apulia FESR 2007–2013, Axis I, Line 1.2—PO Apulia FSE 2007–2013 Axis IV”.
Author Contributions: Giacomo Scarascia Mugnozza and Simone Pascuzzi conceived and designed the experiments; Ileana Blanco and Alexandros Sotirios Anifantis performed the experiments; Ileana Blanco and Simone Pascuzzi analyzed the data; Simone Pascuzzi wrote the paper.
Conflicts of Interest:The authors declare no conflict of interest. Nomenclature
F Faraday’s number (96485 C¨ mol´1) Iel the electrolyzer’s current (A)
n number of electrons transferred per hydrogen molecule (n = 2) Nc number of cells in an electrolyzer’s stack
PcG conduction and convection power loss through the greenhouse covering system (W) PvG air leakage/power loss from indoor to outdoor environment (W)
PiG power loss by radiation from the covering (W)
Paux required power by the auxiliary components of the plant (W) Pd available power from PV modules (W)
Pgp required power by the geothermal heat pump (W) Pwh waste heat power produced during water electrolysis (W) Pr required power by the electrolyzer (W)
PPV available power from PV modules (W)
qH2 overall hydrogen production rate in the electrolyzer (mol¨ s
´1) QH2 hydrogen gas flow rate (Nm
3¨h´1) R2 coefficient of determination T operating cell temperature (K)
U voltage supplied to the electrolyzer (V) Uc actual voltage of the cell (V)
Urev reversible cell potential (V)
Urev0 standard state reversible cell potential (V) Utn thermo-neutral potential (V)
Utn0 standard * thermo-neutral potential (V) ∆G change in Gibbs free energy (J¨ mol´1)
∆G˝ standard change in Gibbs free energy (J¨ mol´1) ∆H change in enthalpy of formation (J¨ mol´1) ∆H˝ standard* enthalpy of formation (J¨ mol´1) ∆S change in entropy of formation (J¨ mol´1¨K´1)
ηF Faradic efficiency
ηT energy or thermal efficiency
* Temperature 298 K; pressure 105N¨ m´2.
References
1. Baldoin, C.; Balsari, P.; Cerruto, E.; Pascuzzi, S.; Raffaelli, M. Improvement in pesticide application on greenhouse crops: Results of a survey about greenhouse structures in Italy. Acta Hortic. 2008, 801, 609–614. [CrossRef]
2. Campiotti, C.; Viola, C.; Alonzo, G.; Bibbiani, C.; Giagnacovo, G.; Scoccianti, M.; Tumminelli, G. Sustainable greenhouse horticulturae in Europe. J. Sustain. Energy 2012, 3, 159–163.
3. Vox, G.; Schettini, E.; Lisi Cervone, A.; Anifantis, A. Solar thermal collectors for greenhouse heating. Acta Hortic. 2008, 801, 787–794. [CrossRef]
4. Vox, G.; Blanco, I.; Mugnozza, G.S.; Schettini, E.; Bibbiani, C.; Viola, C.; Campiotti, C.A. Solar absorption cooling system for greenhouse climate control: Technical evaluation. Acta Hortic. 2014, 1037, 533–538. [CrossRef]
5. Vox, G.; Teitel, M.; Pardossi, A.; Minuto, A.; Tinivella, F.; Schettini, E. Sustainable greenhouse systems. In Sustainable Agriculture: Technology, Planning and Management; Salazar, A., Rios, I., Eds.; Nova Science Publishers, Inc.: New York, NY, USA, 2010; pp. 1–80.
6. Adaro, J.A.; Galimberti, P.D.; Lema, A.I.; Fasulo, A.; Barral, J.R. Geothermal contribution to greenhouse heating. Appl. Energy 1999, 64, 241–249. [CrossRef]
7. Benli, H. A performance comparison between a horizontal source and a vertical source heat pump systems for a greenhouse heating in the mild climate Elazig, Turkey. Appl. Therm. Eng. 2013, 50, 197–206. [CrossRef] 8. Chai, L.; Ma, C.; Ni, J.Q. Performance evaluation of ground source heat pump system for greenhouse heating
in norther China. Biosyst. Eng. 2012, 111, 107–117. [CrossRef]
9. Kondili, E.; Kaldellis, J.K. Optimal design of geothermal-solar greenhouses for the minimisation of fossil fuel consumption. Appl. Therm. Eng. 2006, 26, 905–915. [CrossRef]
10. Ozgener, O. Use of solar assisted geothermal heat pump and small wind turbine systems for heating agricultural and residential buildings. Energy 2010, 35, 262–268. [CrossRef]
11. Rzayeva, M.P.; Salamov, O.M.; Kerimov, M.K. Modeling to get hydrogen and oxygen by solar water electrolysis. Int. J. Hydrog. Energy 2001, 26, 195–201. [CrossRef]
12. Ulleberg, Ø. The importance of control strategies in PV-hydrogen systems. Sol. Energy 2004, 76, 323–329. [CrossRef]
13. Mueller-Langer, F.; Tzimas, E.; Kaltschmitt, M.; Peteves, S. Techno-economic assessment of hydrogen production processes for the hydrogen economy for the short and medium term. Int. J. Hydrog. Energy 2007, 32, 3797–3810. [CrossRef]
14. Gómez, X.; Fernández, C.; Fierro, J.; Sánchez, M.E.; Escapa, A.; Morán, A. Hydrogen production: Two stage processes for waste degradation. Bioresour. Technol. 2011, 102, 8621–8627. [CrossRef] [PubMed]
15. Kapdan, I.K.; Kargi, F. Bio-hydrogen production from waste materials. Enzym. Microb. Technol. 2006, 38, 569–582. [CrossRef]
16. Redwood, M.D.; Paterson-Beedle, M.; Macaskie, L.E. Integrating dark and light bio-hydrogen production strategies: Towards the hydrogen economy. Rev. Environ. Sci. Biotechnol. 2009, 8, 149–185. [CrossRef] 17. Ntaikou, I.; Antonopoulou, G.; Lyberatos, G. Biohydrogen Production from Biomass and Wastes via Dark
Fermentation: A Review. Waste Biomass Valoriz. 2010, 1, 21–39. [CrossRef]
18. Blanco, I.; Pascuzzi, S.; Anifantis, A.S.; Scarascia Mugnozza, G. Study of a pilot photovoltaic-electrolyzer-fuel cell power system for a geothermal heat pump heated greenhouse and evaluation of the electrolyzer efficiency and operational mode. J. Agric. Eng. 2014, 45, 111–118. [CrossRef]
19. Posso, F.; Sánchez, J.; Espinoza, J.L.; Siguencia, J. Preliminary estimation of electrolytic hydrogen production potential from renewable energies in Ecuador. Int. J. Hydrog. Energy 2016, 41, 2326–2344. [CrossRef] 20. Valdés, R.; Rodríguez, L.R.; Lucio, J.H. Procedure for optimal design of hydrogen production plants with
reserve storage and a stand-alone photovoltaic power system. Int. J. Hydrog. Energy 2012, 37, 4018–4025. [CrossRef]
21. Miland, H.; Ulleberg, Ø. Testing of a small-scale stand-alone power system based on solar energy and hydrogen. Sol. Energy 2012, 86, 666–680. [CrossRef]
22. Maclay, J.D.; Brouwer, J.; Samuelsen, G.S. Experimental results for hybrid energy storage systems coupled to photovoltaic generation in residential applications. Int. J. Hydrog. Energy 2011, 36, 12130–12140. [CrossRef] 23. Jallouli, R.; Krichen, L. Sizing, techno-economic and generation management analysis of a stand alone
photovoltaic power unit including storage devices. Energy 2012, 40, 196–209. [CrossRef]
24. Khan, M.J.; Iqbal, M.T. Pre-feasibility study of stand-alone hybrid energy systems for applications in Newfoundland. Renew. Energy 2005, 30, 835–854. [CrossRef]
25. Ganguly, A.; Misra, D.; Ghosh, S. Modeling and analysis of solar photovoltaic-electrolyzer-fuel cell hybrid power system integrated with a floriculture greenhouse. Energy Build. 2010, 42, 2036–2043. [CrossRef] 26. Deshmukh, S.S.; Boehm, R.F. Review of modeling details related to renewably powered hydrogen systems.
Renew. Sustain. Energy Rev. 2008, 12, 2301–2330. [CrossRef]
27. Roy, A.; Watson, S.; Infield, D. Comparison of electrical energy efficiency of atmospheric and high pressure electrolyzers. Int. J. Hydrog. Energy 2006, 31, 1964–1979. [CrossRef]
28. Barthels, H.; Brocke, W.A.; Bonhoff, K.; Groehn, H.G.; Heuts, G.; Lennartz, M.; Mai, H.; Schmid, L.; Mergel, J.; Ritzenhoff, P. PHOEBUS-Jülich: An autonomous energy supply system comprising photovoltaics, electrolytic hydrogen, fuel cell. Int. J. Hydrog. Energy 1998, 23, 295–301. [CrossRef]
29. Ghosh, P.C.; Emonts, B.; Janßen, H.; Mergel, J.; Stolten, D. Ten years of operational experience with a hydrogen-based renewable energy supply system. Sol. Energy 2003, 75, 469–478. [CrossRef]
30. Hug, W.; Divisek, J.; Mergel, J.; Seeger, W.; Steeb, H. Highly efficient advanced alkaline electrolyzer for solar operation. Int. J. Hydrog. Energy 1992, 17, 699–705. [CrossRef]
31. Schug, C.A. Operational characteristics of high-pressure, high-efficiency water–hydrogen–electrolysis. Int. J. Hydrog. Energy 1998, 23, 1113–1120. [CrossRef]
32. Hollmuller, P.; Joubert, J.M.; Lachal, B.; Yvon, K. Evaluation of a 5 kWp photovoltaic hydrogen production and storage installation for a residential home in Switzerland. Int. J. Hydrog. Energy 2000, 25, 97–109. [CrossRef]
33. Hammoudi, M.; Henao, C.; Agbossou, K.; Dubé, Y.; Doumbia, M.L. New multi-physics approach for modelling and design of alkaline electrolyzers. Int. J. Hydrog. Energy 2012, 37, 13895–13913. [CrossRef]
34. Diéguez, P.M.; Ursùa, A.; Sanchis, P.; Sopena, C.; Guelbenzu, E.; Gandìa, L.M. Thermal performance of a commercial alkaline water electrolyzer: Experimental study and mathematical modeling. Int. J. Hydrog. Energy 2008, 33, 7338–7354. [CrossRef]
35. Walker, J.N.; Aldrich, R.A.; Short, T.H. Quantity of air flow for agricultural structures. In Ventilation of Agricultural Structures; Hellickson, M.A., Walker, J.N., Eds.; ASAE: St. Joseph, MI, USA, 1983; pp. 257–277. 36. Sioli, G. High Pressure Electrolyser. U.S. Patent US 2011/0210012 A1; U.S. Patent Office: Washington, DC, USA. 37. Penchini, D.; Cinti, G.; Discepoli, G.; Desideri, U. Theoretical study and performance evaluation of hydrogen
production by 200 W solid oxide electrolyzer stack. Int. J. Hydrog. Energy 2014, 39, 9457–9466. [CrossRef] 38. Ulleberg, Ø. Modeling of advanced alkaline electrolyzers: A system simulation approach. Int. J.
Hydrog. Energy 2003, 28, 21–33. [CrossRef]
39. Berry, G.D. Hydrogen production. In Encyclopaedia of Energy; Elsevier-Academic Press: San Diego, CA, USA, 2004; Volume 3, pp. 259–263.
40. Li, C.H.; Zhu, X.J.; Cao, G.Y.; Sui, S.; Hu, M.R. Dynamic modeling and sizing optimization of stand-alone photovoltaic power systems using hybrid energy storage technology. Renew. Energy 2009, 34, 815–826. [CrossRef]
41. Pascuzzi, S.; Anifantis, A.S.; Blanco, I.; Scarascia Mugnozza, G. Hazards assessment and technical actions due to the production of pressured hydrogen within a pilot photovoltaic-electrolyzer-fuel cell power system for agricultural equipment. J. Agric. Eng. 2016, 47, 88–93. [CrossRef]
42. Zini, G.; Tartarini, P. Hybrid systems for solar hydrogen: A selection of case-studies. Appl. Therm. Eng. 2009, 29, 2585–2595. [CrossRef]
43. Lehman, P.A.; Chamberlin, C.E.; Pauletto, G.; Rocheleau, M.A. Operating experience with a photovoltaic-hydrogen energy system. Int. J. Hydrog. Energy 1997, 5, 465–470. [CrossRef]
44. Little, M.; Thomson, M.; Infield, D. Electrical integration of renewable energy into stand-alone power supplies incorporating hydrogen storage. Int. J. Hydrog. Energy 2007, 32, 1582–1588. [CrossRef]
© 2016 by the authors; licensee MDPI, Basel, Switzerland. This article is an open access article distributed under the terms and conditions of the Creative Commons Attribution (CC-BY) license (http://creativecommons.org/licenses/by/4.0/).