JHEP08(2014)174
Published for SISSA by SpringerReceived: May 14, 2014 Accepted: July 9, 2014 Published: August 29, 2014
Search for massive resonances decaying into pairs of
boosted bosons in semi-leptonic final states at
√
s = 8 TeV
The CMS collaboration
E-mail: [email protected]
Abstract: A search for new resonances decaying to WW, ZZ, or WZ is presented. Final states are considered in which one of the vector bosons decays leptonically and the other
hadronically. Results are based on data corresponding to an integrated luminosity of
19.7 fb−1 recorded in proton-proton collisions at √s = 8 TeV with the CMS detector at
the CERN LHC. Techniques aiming at identifying jet substructures are used to analyze signal events in which the hadronization products from the decay of highly boosted W or Z bosons are contained within a single reconstructed jet. Upper limits on the production of generic WW, ZZ, or WZ resonances are set as a function of the resonance mass and width. We increase the sensitivity of the analysis by statistically combining the results of this search with a complementary study of the all-hadronic final state. Upper limits at 95% confidence level are set on the bulk graviton production cross section in the range from 700 to 10 fb for resonance masses between 600 and 2500 GeV, respectively. These limits on the bulk graviton model are the most stringent to date in the diboson final state.
Keywords: Hadron-Hadron Scattering, Particle and resonance production, Jet substruc-ture
ArXiv ePrint: 1405.3447
JHEP08(2014)174
Contents
1 Introduction 2
2 The CMS detector 4
3 Simulated samples 4
4 Reconstruction and selection of events 5
4.1 Trigger and basic offline selection 5
4.2 Muon reconstruction and selection 6
4.3 Electron reconstruction and selection 6
4.4 Jets and missing transverse energy reconstruction 7
4.5 W →`ν and Z → `` reconstruction and identification 8
4.6 W → qq0 and Z → qq identification using jet substructure 8
4.7 Final event selection and categorization 9
5 W tagging in a top-quark enriched control sample 10
6 Modeling of background and signal 12
6.1 Background estimation 12
6.2 Modeling of the signal mass distribution 17
7 Systematic uncertainties 18
7.1 Systematic uncertainties in the background estimation 18
7.2 Systematic uncertainties in the signal prediction 18
8 Statistical interpretation 19
8.1 Limits on a narrow-width bulk graviton model 20
8.2 Model-independent limits 21
9 Summary 26
A Detailed instructions and additional material for generic interpretation
of the results 28
JHEP08(2014)174
1 Introduction
The standard model (SM) of particle physics has been very successful in describing the high-energy physics phenomena investigated so far. One of the predictions of the SM is the existence of a scalar particle, known as the Higgs boson, associated with the spontaneous breaking of the electroweak (EW) symmetry and responsible for the masses of the SM
particles [1–6]. The recent discovery by the ATLAS and CMS Collaborations of a particle
compatible with the SM predictions for the Higgs boson provides further verification of the
SM [7–9]. In view of large loop corrections to the Higgs boson mass, the question arises
whether the measured Higgs boson mass is the result of fine-tuned constants of nature within the SM or whether new physics at the TeV scale stabilizes the Higgs field vacuum. This question can be reformulated in terms of the large difference between the mass of the
Higgs boson and the Planck scale MPl, where the gravitational force is expected to have
the same strength as the other fundamental forces (MPl∼ 1016TeV).
In many theoretical extensions of the SM, the spontaneous breaking of the EW sym-metry is associated with new strong dynamics appearing at the TeV scale. For instance,
the origin of the new dynamics may be due to new interactions [10–12] or a composite
Higgs boson [13–15]. These extensions of the SM predict the existence of new resonances
coupling to pairs of massive vector bosons (VV, where V = W or Z). Results from previous
direct searches at CMS [16–19] and ATLAS [20–23], and from indirect bounds from the
EW sector and from flavor physics [24, 25] generally place lower limits on the masses of
these VV resonances above the TeV scale.
Models extending the number of spatial dimensions are of particular interest in the attempt to explain the apparently large difference between the EW and the gravitational scale. Some of these models predict the existence of a so-called tower of Kaluza-Klein (KK) excitations of a spin-2 boson, the KK graviton. The WW and ZZ channels are some of the
possible decay modes of the Randall-Sundrum (RS) graviton [26] in warped extra dimension
models. The original RS model (here denoted as RS1) can be extended to the bulk graviton
(Gbulk) model, which addresses the flavor structure of the SM through localization of
fermions in the warped extra dimension [27–29]. In this scenario, coupling of the graviton
to light fermions is highly suppressed and the decays into photons are negligible. On the other hand, the production of gravitons from gluon fusion and their decays into a pair of massive gauge bosons can be sizable at hadron colliders. The model has two free
parameters: the mass of the first mode of the KK bulk graviton, MG, and the ratio k/MPl,
where k is the unknown curvature scale of the extra dimension, and MPl ≡ MPl/
√ 8π is the reduced Planck mass. Previous direct searches set limits on the cross section times
branching fraction for the production of Gbulk as a function of MG [17, 22]. It should
be noted that a revised version of the theoretical calculations has been recently released,
superseding the previous one [27,30]. With the new calculation, which predicts production
cross sections four times smaller, previous limits may have to be revised. For example, the
lower limit on the graviton mass quoted in ref. [17] is affected, though the experimental
bounds on the graviton production cross section times branching fraction as a function
JHEP08(2014)174
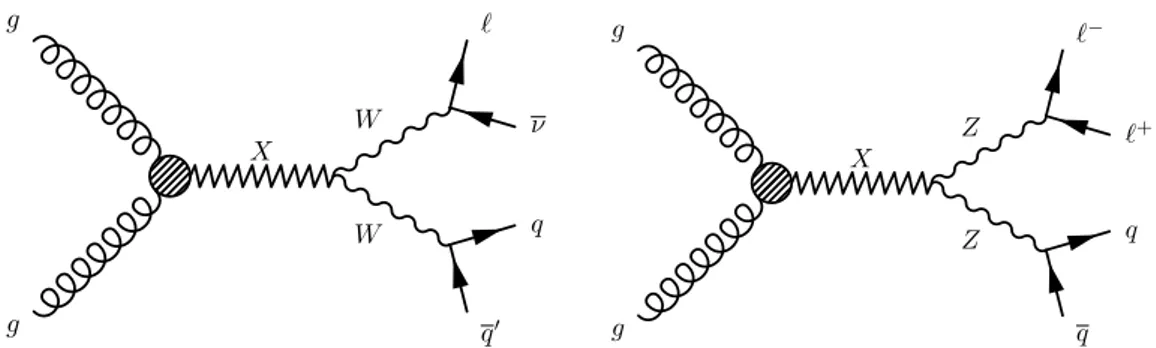
X W W g g q0 q ⌫ ` X Z Z g g q q `+ `Figure 1. Two Feynman diagrams for the production of a generic resonance X decaying to some of the final states considered in this study.
above 600 GeV, while the limit on the production cross section for graviton masses below
600 GeV from ref. [17] remains the most stringent CMS result for the final state considered
in the reference.
We present a search for new resonances decaying to WW, ZZ, or WZ in which one of the bosons decays leptonically and the other hadronically. The analysis is based on the
proton-proton collision data at√s = 8 TeV collected by the CMS experiment at the CERN
Large Hadron Collider (LHC) during 2012 and corresponding to an integrated luminosity
of 19.7 fb−1. The final states considered are either `νqq(0) or ``qq(0), resulting in events
with a charged lepton, a neutrino and a single reconstructed-jet (`ν+V-jet channel) or two
charged leptons and a single reconstructed-jet (``+V-jet channel). Figure 1 shows two
Feynman diagrams relevant to the production and decays of a generic resonance X. The
search is limited to final states where ` = µ or e; however the results include the case
in which W → τ ν or Z → τ τ where the tau decay is τ → `νν. The gain in sensitivity
from the decay channels including τ leptons is limited, because of the small branching
ratios involved.
For large values of the resonance mass, the two quarks originating from the hadron-ically decaying W or Z bosons are highly collimated and are typhadron-ically reconstructed as a single massive jet (“V jet”). Final states where two jets from a V decay are well resolved in the detector give a negligible contribution to the sensitivity for the resonance masses considered in this search. This analysis uses the additional information from jet substruc-ture to perform jet “V tagging” and to further suppress the SM background, which mainly
originates from the SM production of V + jets and non-resonant VV events [31]. In the
`ν+V-jet channel tt events also contribute to the background. The signal is characterized
as a local enhancement in the WW, ZZ, or WZ invariant mass distribution (mVV). The
invariant mass of the WW system is determined by estimating the neutrino transverse
momentum with the measured missing transverse energy (Emiss
T ) in the event, while an
es-timate of the neutrino longitudinal momentum is derived by imposing the constraint of the
W mass on the invariant mass of the `ν system. The mass distributions for the dominant
W+jets and Z+jets backgrounds are determined from events with a reconstructed jet mass not compatible with the W or Z hypothesis. This analysis is optimized for WW and ZZ resonances, but because of the loose requirement on the V-jet mass it is also sensitive to charged resonances decaying to WZ.
JHEP08(2014)174
The results of this analysis are combined with limits derived in a companion CMS
search for resonances decaying to VV final states in the all-hadronic decay channel [32].
The all-hadronic analysis uses the same V-tagging techniques as presented here to separate the signal from the large multijet background.
In this paper, section2briefly describes the CMS detector; section3gives an overview
of the simulations used in this analysis. Section 4 provides a detailed description of the
reconstruction and event selection. In section 5 we demonstrate the performance of the
V tagging by studying a sample of events enriched in top quarks. Section 6 describes the
background estimation and the signal modeling. Systematic uncertainties are discussed
in section 7. The results of the search for a bulk graviton and for generic resonances are
presented in section8. Appendix Acontains detailed instructions for applying the results
presented here to new models with diboson resonances.
2 The CMS detector
The central feature of the CMS detector is a 3.8 T superconducting solenoid with a 6 m internal diameter. Within the field volume are the silicon tracker, the crystal electro-magnetic calorimeter (ECAL), and the brass and scintillator hadron calorimeter (HCAL). The calorimeters are supplemented by a steel/quartz-fiber Cherenkov detector (HF) to extend the calorimetric coverage in the forward direction. The muon system is installed outside the solenoid and embedded in the steel flux-return yoke. The CMS experiment uses a right-handed coordinate system, with the origin at the nominal collision point, the x-axis pointing to the center of the LHC ring, the y-axis pointing up (perpendicular to
the LHC plane), and the z-axis along the anticlockwise beam direction. The polar angle
(θ) is measured from the positive z-axis and the azimuthal angle (φ) is measured from
the positive x-axis in the x–y plane. The radius (r) denotes the distance from the z-axis
and the pseudorapidity (η) is defined as η = − ln[tan(θ/2)]. The CMS tracker consists of 1440 silicon pixel and 15 148 silicon strip detector modules. The ECAL consists of nearly 76 000 lead tungstate crystals, which provide coverage in pseudorapidity |η| < 1.479 in the central barrel region and 1.479 < |η| < 3.0 in the two forward endcap regions. The HCAL consists of a sampling calorimeter which utilizes alternating layers of brass as an absorber and plastic scintillator as an active material, covering the pseudorapidity range |η| < 3, which is extended to |η| < 5 in combination with the HF. Muons are measured in the pseudorapidity range |η| < 2.4, with detection planes which employ three technologies: drift tubes, cathode strip chambers, and resistive plate chambers. A detailed description
of the CMS detector can be found in ref. [33].
3 Simulated samples
The W+jets and Z+jets SM processes are simulated with MadGraph v5.1.3.30 [34], tt
and single top quark events are generated with powheg 1.0 r1380 [35–40], while diboson
(WW, WZ, and ZZ) processes are produced with pythia v6.424 [41]. The parton showering
JHEP08(2014)174
parton distribution functions (PDF) are used in all generated samples, except for the
powheg tt sample, where the CT10 PDF set [44] is used. All generated samples are
processed through a Geant4-based [45] simulation of the CMS detector. The simulated
background samples are normalized using inclusive cross sections calculated at next-to-leading order (NLO), or next-to-next-to-next-to-leading order (NNLO) where available, calculated
with mcfm v6.6 [46–49] and fewz v3.1 [50].
The bulk graviton model is used as a benchmark signal process, with the graviton forced to decay to the WW and ZZ final states. In this specific model, the vector gauge
bosons are produced with a longitudinal polarization (VL) in more than 99% of the cases.
The graviton masses considered lie in the range 600 to 2500 GeV. The events are generated
with jhugen v3.1.8 [51], which properly treats the spin correlations in the final state, while
the values for the bulk graviton cross sections and decay rates are calculated at leading
order with CalcHEP v3.4.1 [52]. The total cross section of the process pp → Gbulk
at √s = 8 TeV is 15.1 fb, for a graviton mass of 1 TeV and k/MPl = 0.5. At the same
resonance mass, the branching fraction of Gbulk→ WW (Gbulk→ ZZ) is 18.7% (9.5%).
Supplementary minimum bias interactions are added to the generated events in order to match the additional particle production observed in data from the large number of proton-proton interactions occurring per LHC bunch crossing (pileup). The simulated samples are corrected for observed differences between data and simulation in the efficiencies of lepton trigger, lepton identification/isolation, and selection criteria identifying jets originating from hadronization of b quarks (b jets).
4 Reconstruction and selection of events
4.1 Trigger and basic offline selection
In the`ν+V-jet channel, candidate signal events are selected online with a trigger requiring
either one muon or one electron, without isolation requirements and with loose
identifica-tion criteria. The transverse momentum (pT) measured online must be higher than 40 GeV
for the muons while the minimum transverse energy threshold is 80 GeV for the electrons. The trigger efficiencies for the single-muon trigger vary between 82% and 94% depending on
the value of theη of the muon. The efficiency is above 98% for the single-electron trigger.
In the ``+V-jet channel, events are selected online with a trigger requiring either
two muons or two electromagnetic energy deposits, with loose identification criteria. The trigger used for the electron channel rejects candidates if there is significant energy in the HCAL associated with the ECAL cluster. The clusters are required to be loosely matched to the trajectories of tracks with associated hits in the pixel detector. No lepton
isolation requirements are applied at the trigger level. The pT thresholds applied in the
online selection of the muons are 22 GeV for the highest-pT muon and 8 GeV for the second
highest-pT muon. The transverse energy threshold for the ECAL clusters is set at 33 GeV.
The trigger efficiency of the double-muon trigger varies between 80% and 98% depending
on the value ofη of the leptons. The efficiency of the double-electron trigger is above 99%.
Offline, all events are required to have at least one primary vertex reconstructed within a 24 cm window along the beam axis, with a transverse distance from the nominal pp
JHEP08(2014)174
interaction region of less than 2 cm [53]. In the presence of more than one vertex passing
these requirements, the primary-event vertex is chosen to be the one with the highest total p2
T, summed over all the associated tracks.
4.2 Muon reconstruction and selection
Tracker muons are reconstructed using the inner tracker with an additional requirement
of a matching hit in the muon system [54]. Tracker muons must satisfy requirements on
the impact parameter of the track and on the number of hits in the silicon tracker. Muons reconstructed with a fit using both the inner tracking system and the muon spectrometer
are defined as global muons [54]. Compared to tracker muons, global muons must pass
additional requirements on the number of hits in the muon detectors. These quality se-lections ensure a precise measurement of the four-momentum and reject misreconstructed
muons. A large fraction of isolated high-pT muons is usually identified as both tracker and
global muons. For large values of the mass of a ZZ resonance, the two charged leptons
orig-inating from the high-pT Z boson are highly collimated because of the large Lorentz boost
and are characterized by small values of their angular separation, ∆R =√(∆η)2+ (∆φ)2.
While the global muon reconstruction and identification are optimized for the case of well-separated muons, inefficiencies in the global-muon reconstruction are observed when two muons from a boosted Z are very close, typically causing the loss of one of them. In order
to recover the inefficiency in the muon identification, the ``+V-jet selection requires two
tracker muons of which at least one should be reconstructed and identified as a global muon. Wherever possible, the kinematic quantities are calculated with the global fit.
An isolation requirement is applied in order to suppress the background from multijet
events where jet constituents are identified as muons. A cone of radius ∆R = 0.3 is
constructed around the muon direction. The isolation parameter is defined as the scalar sum of the transverse momenta of all the additional reconstructed tracks within the cone,
divided by the muon pT. The contribution from any other muon candidate in the cone
is excluded from the computation in order to retain high signal efficiency when the two muons originate from a boosted Z and are collimated to the point of entering in each other’s isolation cone. Muon candidates with an isolation parameter smaller than 0.1 are considered isolated and used in the rest of the analysis. The efficiency of this muon selection
has been measured with a tag-and-probe method using Z bosons [55], and it has a negligible
dependence on the number of reconstructed primary vertices in the event. In the``+V-jet
channel, events must have at least two muons with |η| < 2.4 of which one should have
pT > 40 GeV and the other pT > 20 GeV. In the `ν+V-jet channel, we require exactly one
global muon withpT> 50 GeV and |η| < 2.1.
4.3 Electron reconstruction and selection
Electron candidates are reconstructed by matching energy deposits in the ECAL with
reconstructed tracks [56]. In order to suppress multijet background, electron candidates
must pass stringent quality criteria tuned for high-pT objects and an isolation selection
[57]. The total scalar sum of thepT of all the tracks in a cone of radius ∆R = 0.3 around
JHEP08(2014)174
contribution from the electron itself, must be less than 5 GeV. A calorimetric isolation parameter is calculated by summing the energies of reconstructed deposits in both ECAL and HCAL, not associated with the electron itself, within a cone of radius ∆R = 0.3 around the electron. The upper threshold for this isolation parameter depends on the electron kinematic quantities and the average amount of additional energy coming from
pileup interactions. When evaluating the isolation parameter in the``+V-jet channel, the
contribution from any nearby electron candidate is excluded from the calculation. This is done in order to retain high signal efficiency when the two leptons from a Z decay are
highly boosted and one of them enters into the isolation cone of the other. In the``+V-jet
channel, we require at least two electrons withpT> 40 GeV and |η| < 2.5. In the `ν+V-jet
channel, we require exactly one electron withpT> 90 GeV and |η| < 2.5. In both channels,
the electrons must fall outside the overlap region between the ECAL barrel and endcaps (1.44 < |η| < 1.56).
4.4 Jets and missing transverse energy reconstruction
Hadronic jets are clustered from the four-momenta of the particles reconstructed by the
CMS particle-flow (PF) algorithm [58,59], using the FastJet software package [60]. The
PF algorithm reconstructs individual particles by combining information from all sub-detector systems. The reconstructed PF constituents are assigned to one of the five candi-date categories (electrons, muons, photons, charged hadrons, and neutral hadrons). In the jet clustering procedure charged PF particles not associated with the primary-event vertex are excluded. Jets used for identifying the hadronically decaying W and Z bosons are
clus-tered using the Cambridge-Aachen algorithm [61] with a distance parameterR = 0.8 (“CA8
jets”). In order to identify b jets, the anti-kT jet clustering algorithm is used [62] with a
distance parameterR = 0.5 (“AK5 jets”) and the combined secondary vertex b-tagging
al-gorithm [63] is applied to the reconstructed AK5 jets. The ratio of the b-tagging efficiency
between data and simulation is used as a scale factor to correct the simulated events. A correction based on the projected area of the jet on the front face of the calorimeter is used to take into account the extra energy clustered in jets due to neutral particles coming from pileup. Jet energy corrections are derived from simulation and from dijet and photon+jet
events in data [64]. Additional quality criteria are applied to the jets in order to remove
spurious jet-like features originating from isolated noise patterns in the calorimeters or the tracker. The efficiency of these jet quality requirements for signal events is above 99%. The CA8 (AK5) jets are required to be separated from any well-identified electron or muon by ∆R > 0.8 (0.3). All jets must have pT > 30 GeV and |η| < 2.4 in order to be considered in the subsequent steps of the analysis.
The missing transverse energy Emiss
T is defined as the magnitude of the vector sum of
the transverse momenta of the reconstructed PF objects. The raw Emiss
T value is modified
to account for corrections to the energy scale of all the reconstructed AK5 jets in the
event. More details on the Emiss
T performance in CMS can be found in refs. [65,66]. The
requirement Emiss
T > 40 (80) GeV is applied only for the muon (electron) channel in the
`ν+V-jet analysis. The threshold is higher in the electron channel to further suppress the larger background from multijet processes.
JHEP08(2014)174
4.5 W → `ν and Z → `` reconstruction and identification
In the `ν+V-jet channel, identified electrons or muons are associated with the W → `ν
candidate. The transverse momentum of the undetected neutrino is assumed to be equal to theEmiss
T . The longitudinal momentum of the neutrino is obtained by solving a
second-order equation that sets the`ν invariant mass to be equal to the known W-boson mass [67].
In the case of two real solutions, the smaller one is chosen; in the case of two complex solutions, their real part is used. The four-momentum of the neutrino is used to build the
four-momentum of the W → `ν candidate. The same procedure is applied for W → τ ν
candidates, where the τ decays to one electron or muon and two neutrinos. In this case,
theEmiss
T represents the transverse momentum of the three-neutrino system.
In the ``+V-jet channel, the leptonic Z-boson candidate is reconstructed by
combin-ing two oppositely charged lepton candidates of the same flavor. The invariant mass of the dilepton system is required to be between 70 and 110 GeV, consistent with the Z-boson mass. This requirement is introduced to reduce significantly the Drell-Yan and
top-quark backgrounds, at the cost of a suppression of the small Z → τ τ → (`νν) (`νν)
signal contribution.
4.6 W → qq0 and Z → qq identification using jet substructure
CA8 jets are used to reconstruct the W-jet and Z-jet candidates from hadronic decays of boosted W and Z bosons, respectively. In order to discriminate against multijet back-grounds we exploit both the reconstructed jet mass, which is required to be close to the W- or Z-boson mass, and the two-prong jet substructure produced by the particle cascades
of two high-pT quarks merging into one jet.
As the first step in exploring potential substructure, the jet constituents are subjected to a jet grooming algorithm, that improves the resolution on the jet mass and reduces the
effect of pileup [68]. The goal of jet grooming is to re-cluster the jet constituents while
applying additional requirements that eliminate soft, large-angle quantum chromodynamic (QCD) radiation coming from sources other than the hard interaction responsible for the V boson. Different jet grooming algorithms have been explored at CMS and their performance
on jets in multijet processes has been studied in detail [68]. In this analysis, we use the
jet pruning algorithm [69,70]. Jet pruning reclusters each jet starting from all its original
constituents using the CA algorithm, discarding “soft” recombinations in each step of the
iterative CA procedure. The combination of two input four-vectors i and j is considered
soft if either (i) pi
T or p
j
T is small compared to the pT of their combination, or (ii) the
separation angle betweeni and j is large. With ˜pT the transverse momentum of the result
of the recombination ofi and j, the two possible tags of a soft recombination are expressed
as (i) min(pi T, p
j
T)/ ˜pT < 0.1 and (ii) ∆Rij > morig/porigT , with morig and porigT representing
the mass and pT of the original un-pruned CA jet. Soft recombinations are rejected, in
which case the input four-vector with the smallestpTis discarded and the input four-vector
with the highest pT is retained for further recombinations. A jet is considered as a W-jet
JHEP08(2014)174
constituents surviving the pruning, falls in the range 65 < mjet < 105 GeV. Similarly, a
Z-jet candidate is required to have 70< mjet < 110 GeV.
Further discrimination against jets from gluon and single-quark hadronization is
ob-tained from the quantity called N-subjettiness [71]. The constituents of the jet before
the pruning procedure are re-clustered with the kT algorithm [72, 73], until N joint
ob-jects (subjets) remain in the iterative combination procedure of the kT algorithm. The
N-subjettiness,τN, is then defined as
τN = 1 d0 X k pT,kmin(∆R1,k, ∆R2,k, . . . , ∆RN,k), (4.1)
where the index k runs over the PF constituents of the jet and the distances ∆Rn,k are
calculated with respect to the axis of the nth subjet. The normalization factor d0 is
calculated asd0 =
P
kpT,kR0, settingR0 to the jet radius of the original jet. The variable
τN quantifies the capability of clustering the jet constituents in exactly N subjets, with
small values representing configurations more compatible with the N -subjets hypothesis.
The ratio between 2-subjettiness and 1-subjettiness,τ21=τ2/τ1, is found to be a powerful
discriminant between jets originating from hadronic V decays and from gluon and
single-quark hadronization. We reject V-jet candidates with τ21 > 0.75. The remaining events
are further categorized according to their value ofτ21in order to enhance the sensitivity of
the analysis. Jets coming from hadronic W or Z decays in signal events are characterized
by lower values of τ21 compared to the SM backgrounds.
4.7 Final event selection and categorization
After reconstructing the two vector bosons, we apply the final selections used for the
search. In the `ν+V-jet (``+V-jet) channel, both the leptonic and the hadronic V-boson
candidates must have apTgreater than 200 (80) GeV. The larger threshold for the`ν+V-jet
channel is related to the higher trigger thresholds and the larger multijet background in this
category of events. In addition, there are specific topological selection criteria in the
`ν+V-jet channel requiring that the two W bosons from the decay of a massive resonance are approximately back-to-back: the ∆R distance between the lepton and the W-jet is greater
thanπ/2; the azimuthal angular separation between the missing transverse energy vector
and the W-jet is greater than 2.0 radians; and the azimuthal angular separation between
the W →`ν and W-jet candidates is greater than 2.0 radians. To further reduce the level
of the tt background in the `ν+V-jet channel, events are rejected if there is one or more
b-tagged AK5 jet in the event, using a working point of the b-tagging algorithm tuned to provide a misidentification rate of ∼1% and efficiency of ∼70%. This veto preserves about
90% of signal events. The looser selections in the ``+V-jet channel allow the extension of
the range of probed masses to lower values. The minimum value of mVV is 700 (500) GeV
for the`ν+V-jet (``+V-jet) channel, respectively.
To enhance the analysis sensitivity, we distinguish two V-jet categories:
• high-purity (HP) category: τ21≤ 0.5;
JHEP08(2014)174
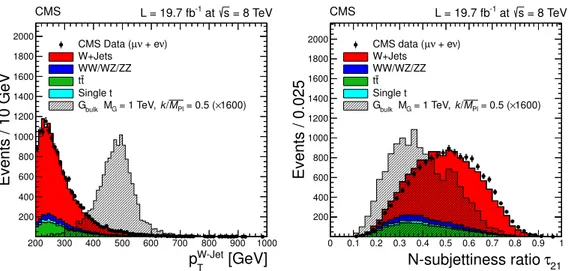
[GeV] W-Jet T p 200 300 400 500 600 700 800 900 1000 Events / 10 GeV 200 400 600 800 1000 1200 1400 1600 1800 2000 ) ν + e ν µ CMS Data ( W+Jets WW/WZ/ZZ tt Single t 1600) × = 0.5 ( Pl M / k = 1 TeV, G M bulk G CMS L = 19.7 fb-1 at s = 8 TeV 21 τ N-subjettiness ratio 0 0.1 0.2 0.3 0.4 0.5 0.6 0.7 0.8 0.9 1 Events / 0.025 200 400 600 800 1000 1200 1400 1600 1800 2000 CMS data (µν + eν) W+Jets WW/WZ/ZZ tt Single t 1600) × = 0.5 ( Pl M / k = 1 TeV, G M bulk G CMS L = 19.7 fb-1 at s = 8 TeVFigure 2. Hadronic WpT and N-subjettiness ratioτ21 distributions for the combined muon and
electron channels and with 65< mjet< 105 GeV. The VV, tt, and single-t backgrounds are taken
from simulation and are normalized to the integrated luminosity of the data sample. The W+jets background is rescaled such that the total number of background events matches the number of events in data. The signal is scaled by a factor of 1600 for better visualization.
Although it is expected that the HP category dominates the total sensitivity of the analysis, the LP is retained, since for large masses of a new resonance it provides improved signal efficiency with only moderate background contamination. The final categorization is based on four classes of events, depending on their lepton flavor (muon or electron) and V-jet purity (LP and HP). In case several distinct diboson resonance candidates are present in the same event, only one is kept for further analysis. Diboson pairs in the HP category are preferred to those in the LP category and, in case multiple choices are still possible,
the candidate with the V-jet with the highest pT is retained. After the final selection no
events with multiple leptonic Z candidates remain.
ThepTandτ21distributions for the hadronic W (Z) boson candidate after the`ν+V-jet
(``+V-jet) selection are shown in figure2 (figure3), after applying a 65< mjet< 105 GeV
(70 < mjet < 110 GeV) requirement. The τ21 distribution shows some disagreement
be-tween data and simulation. Previous studies suggest that part of this discrepancy can be
attributed to a mismodeling of the parton showering in simulation [31]. The analysis is
designed to be robust against differences between data and simulation independent of their specific sources, as described in the next sections.
5 W tagging in a top-quark enriched control sample
The data/simulation discrepancy observed in the key variable τ21 (figures 2 and 3) is
of particular concern as the mismodeling of the variable could bias the signal efficiency estimated from the simulated samples. It is important to study the mismodeling in a signal-free sample with the characteristics of the jets similar to those expected for a genuine signal. In this way one can extract correction factors to apply to the signal efficiency suggested by the simulation and obtain a small systematic uncertainty related to this effect. A sample
JHEP08(2014)174
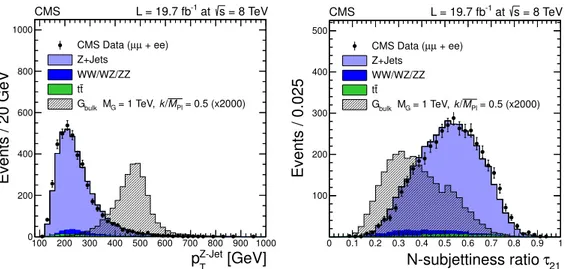
[GeV] Z-Jet T p 100 200 300 400 500 600 700 800 900 1000 Events / 20 GeV 0 200 400 600 800 1000 + ee) µ µ CMS Data ( Z+Jets WW/WZ/ZZ tt = 0.5 (x2000) Pl M / k = 1 TeV, G M bulk G CMS L = 19.7 fb-1 at s = 8 TeV 21 τ N-subjettiness ratio 0 0.1 0.2 0.3 0.4 0.5 0.6 0.7 0.8 0.9 1 Events / 0.025 100 200 300 400 500 + ee) µ µ CMS Data ( Z+Jets WW/WZ/ZZ tt = 0.5 (x2000) Pl M / k = 1 TeV, G M bulk G CMS L = 19.7 fb-1 at s = 8 TeVFigure 3. Hadronic ZpT and N-subjettiness ratio τ21 distributions for the combined muon and
electron channels and with 70< mjet< 110 GeV. The VV and tt backgrounds are taken from
simu-lation and are normalized to the integrated luminosity of the data sample. The Z+jets background is rescaled such that the total number of background events matches the number of events in data. The signal is scaled by a factor of 2000 for better visualization.
of high-pT W bosons decaying hadronically, and reconstructed as a single CA8 jet, can
be isolated in tt and single top-quark events. The control sample is selected by applying all analysis requirements but inverting the b-jet veto. The data are compared with the predictions from simulation. Discrepancies between data and simulation are corrected in the analysis using the scale factors for top-quark background normalization, V-tagging efficiency, and peak and resolution of the V-jet mass distribution derived in this section. Since the jet substructure produced in simulation depends on the modeling of the parton shower, pythia v6.426 is used for this part of the event simulation. In this way the results of this study can be consistently applied to the signal MC samples, that are also generated with the same parton showering.
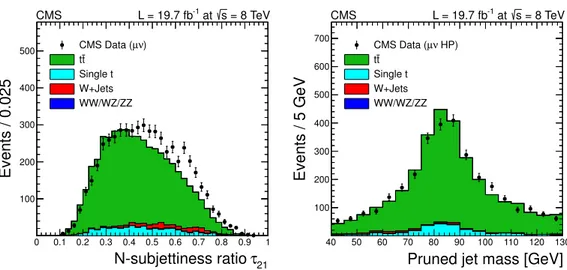
The τ21 distribution in the top-quark enriched control sample is shown in the left plot
of figure 4, while the right plot shows the pruned jet mass distribution after applying the
HP selection of τ21< 0.5. The pruned jet mass plot shows a clear peak for events with an
isolated W boson decaying to hadrons (W-signal component), as well as a combinatorial component mainly due to events where the extra b jet from the top-quark decay is in the proximity of the W. From the comparison between data and simulation, a normalization correction factor for tt and single top-quark background processes is evaluated in the signal
region (65< mjet < 105 GeV). The measured data-to-simulation scale factors are 0.97±0.02
(0.96 ± 0.03) in the muon (electron) channel for the high-purity category, and 1.31 ± 0.05 (1.39 ± 0.08) for the low-purity category. These scale factors (including both the W-signal and the combinatorial components) are used to correct the normalization of the tt and single top-quark simulated background predictions in the signal region.
A simultaneous fit to the jet mass distributions, before and after the mjet and τ21
JHEP08(2014)174
21 τ N-subjettiness ratio 0 0.1 0.2 0.3 0.4 0.5 0.6 0.7 0.8 0.9 1 Events / 0.025 100 200 300 400 500 CMS Data (µν) tt Single t W+Jets WW/WZ/ZZ CMS L = 19.7 fb-1 at s = 8 TeVPruned jet mass [GeV]
40 50 60 70 80 90 100 110 120 130 Events / 5 GeV 100 200 300 400 500 600 700 HP) ν µ CMS Data ( tt Single t W+Jets WW/WZ/ZZ CMS L = 19.7 fb-1 at s = 8 TeV
Figure 4. Distributions from the top-quark enriched control sample in the muon channel. Left: N-subjettiness ratio τ21, Right: mjet after requiringτ21 < 0.5. The distributions show some
dis-agreement between data and simulation. The simulation is corrected for these discrepancies using the method based on data described in section5. This approach ensures that the analysis is robust against differences between data and simulation, independent of their sources.
the top-quark enriched sample, in both data and simulation. The fit results are used to extract the efficiencies for identifying an isolated hadronic W boson (W tagging based on
mjet andτ21requirements). Differences in the resulting W-tagging efficiencies will be driven
by the discrepancy between data and simulation in the τ21 distribution. The ratio of the
efficiency in data and simulation yields W-tagging scale factors that are used to correct the total signal efficiency predicted by the simulation. The scale factor for W tagging is 0.89 ± 0.08 (1.28 ± 0.30) for the high-purity (low-purity) category, combining the muon and electron channels.
In addition, the W-jet mass peak position and resolution are extracted from the same fit and are measured to be 83.4 ± 0.3 and 7.2 ± 0.4 GeV, respectively, in the simulation and 84.7 ± 0.4 and 7.9 ± 0.6 GeV in the data, where the uncertainties given are statistical only. The mass peak position is slightly shifted with respect to the W-boson mass because of the presence of extra energy deposited in the jet cone coming from pileup, underlying event, and initial-state radiation not completely removed by the jet pruning procedure. For events with top quarks, additional energy contributions come also from the possible presence of a b jet close to the W-jet candidate.
The same corrections are used also in the case where the V-jet is assumed to come from a Z boson. The kinematic properties of W-jets and Z-jets are very similar and the agreement between data and simulation is expected to be equally good.
6 Modeling of background and signal
6.1 Background estimation
After the full selection, the dominant background comes from SM V+jets events. A proce-dure based on data has been developed in order to estimate this background. Other minor
JHEP08(2014)174
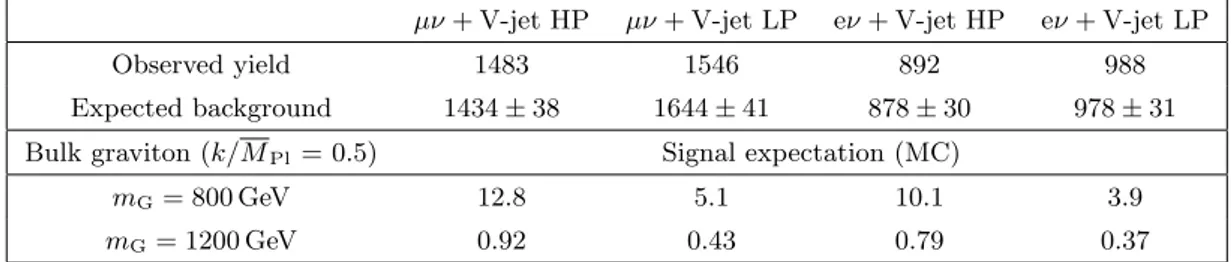
µν + V-jet HP µν + V-jet LP eν + V-jet HP eν + V-jet LPObserved yield 1483 1546 892 988
Expected background 1434 ± 38 1644 ± 41 878 ± 30 978 ± 31 Bulk graviton (k/MPl= 0.5) Signal expectation (MC)
mG= 800 GeV 12.8 5.1 10.1 3.9
mG= 1200 GeV 0.92 0.43 0.79 0.37
Table 1. Observed and expected yields for the `ν+V-jet analysis. The yields are quoted in the range 700< mWW< 3000 GeV. The expected background is quoted from the sideband procedure.
The uncertainties in the background prediction from data are statistical in nature, as they depend on the number of events in the sideband region. Statistical uncertainties in the signal expectations are negligible.
µµ + V-jet HP µµ + V-jet LP ee + V-jet HP ee + V-jet LP
Observed yield 575 338 360 233
Expected background 622 ± 29 338 ± 22 370 ± 22 207 ± 17 Bulk graviton (k/MPl = 0.5) Signal expectation (MC)
mG= 800 GeV 2.4 0.5 2.0 0.4
mG= 1200 GeV 0.16 0.04 0.14 0.035
Table 2. Observed and expected yields for the``+V-jet analysis. The yields are quoted in the range 500 (650)< mZZ< 2800 GeV for the HP (LP) category. The expected background is quoted from
the sideband procedure. The uncertainties in the background predictions from data are statistical in nature, as they depend on the number of events in the sideband region. Statistical uncertainties in the signal expectations are negligible.
sources of background, such as tt, single top-quark, and VV production, are estimated using the simulated samples after applying correction factors based on control samples in data, as described in the previous sections. A signal-depleted control region is defined
around the mjet mass window described in section 4.6. For the `ν+V-jet channel, lower
and upper sideband regions are defined in the mjet ranges [40, 65] and [105, 130] GeV,
respectively. In the``+V-jet channel, the sidebands are defined in the mjet ranges [50, 70]
and [110, 130] GeV.
The overall normalization of the V+jets background in the signal region is determined
from a fit to themjet distribution in the lower and upper sidebands of the observed data.
The analytical form of the fit function is chosen from simulation studies and the minor
backgrounds are taken from the simulation. Figures 5 and 6 show the result of this fit
procedure for the`ν+V-jet and ``+V-jet analyses, respectively. Tables 1 and 2 show the
predicted number of background events in the signal region after the inclusion of the minor backgrounds and compare it with the data.
The shape of the mVV distribution of the V+jets background in the signal region is
JHEP08(2014)174
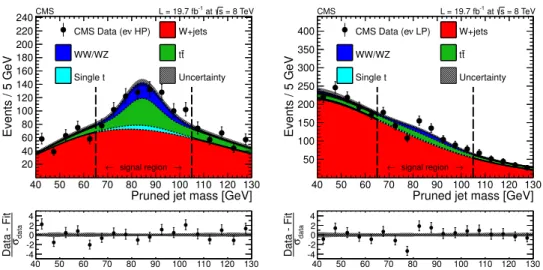
40 50 60 70 80 90 100 110 120 130 data σ Data - Fit -4-2 0 2 4Pruned jet mass [GeV]
40 50 60 70 80 90 100 110 120 130 Events / 5 GeV 20 40 60 80 100 120 140 160 180 200 220 240 HP) ν CMS Data (e W+jets WW/WZ tt Single t Uncertainty CMS L = 19.7 fb-1 at s = 8 TeV → signal region ← 40 50 60 70 80 90 100 110 120 130 data σ Data - Fit -4-2 0 2 4
Pruned jet mass [GeV]
40 50 60 70 80 90 100 110 120 130 Events / 5 GeV 50 100 150 200 250 300 350 400 CMS Data (eν LP) W+jets WW/WZ tt Single t Uncertainty CMS L = 19.7 fb-1 at s = 8 TeV → signal region ←
Figure 5. Distributions of the pruned jet mass, mjet, in the `ν+V-jet analysis in the electron
channel. The left (right) panel shows the distribution for the HP (LP) category. All selections are applied except the final mjet signal window requirement. Data are shown as black markers. The
prediction of the non-resonant W+jets background comes from a fit excluding the signal region (between the vertical dashed lines), while the predictions for the minor backgrounds come from the simulation. The MC resonant shapes are corrected using the differences between data and simulation in the W peak position and width measured in the tt control region (see section5). At the bottom of each plot, the bin-by-bin fit residuals, (data-fit)/σdata, are shown together with the
uncertainty band of the fit normalized byσdata.
50 60 70 80 90 100 110 120 130 data σ Data - Fit -2 0 2
Pruned jet mass [GeV]
50 60 70 80 90 100 110 120 130 Events / 5 GeV 20 40 60 80 100 120 140 CMS Data (ee HP) Z+jets WW/WZ/ZZ tt Uncertainty CMS -1 at s = 8 TeV L = 19.7 fb → signal region ← 50 60 70 80 90 100 110 120 130 data σ Data - Fit -2 0 2
Pruned jet mass [GeV]
50 60 70 80 90 100 110 120 130 Events / 5 GeV 20 40 60 80 100 CMS Data (ee LP) Z+jets WW/WZ/ZZ tt Uncertainty CMS -1 at s = 8 TeV L = 19.7 fb → signal region ←
Figure 6. Distributions of the pruned jet mass, mjet, in the ``+V-jet analysis in the electron
channel. The left (right) panel shows the distribution for the HP (LP) category. All selections are applied except the final mjet signal window requirement. Data are shown as black markers.
The prediction of the non-resonant Z+jets background comes from a fit excluding the signal region (between the vertical dashed lines), while the predictions for the minor backgrounds come from the simulation. The MC resonant shapes are corrected using the differences between data and simulation in the W peak position and width measured in the tt control region (see section5). At the bottom of each plot, the bin-by-bin fit residuals, (data-fit)/σdata, are shown together with the
JHEP08(2014)174
derived from the V+jets simulation, defined as:
αMC(mVV) =
FMC,SRV+jets(mVV) FMC,SBV+jets(mVV)
, (6.1)
where FMC,SRV+jets(mVV) and FMC,SBV+jets(mVV) are the probability density functions used to
de-scribe the mVV spectrum in simulation for the signal region and lowmjet sideband region,
respectively. The high mjet sideband was not considered in order to exclude possible
con-tamination from beyond-SM resonances decaying into a V boson and a SM Higgs boson, H,
with mass of 125.6 GeV [74], in addition to the VV final state considered here. The partial
compositeness model [14] is an example of such a scenarios. These signal events from HV
resonances, in which the Higgs boson is reconstructed as a jet in the CMS detector and the
V decays leptonically, would populate the high-mass sideband region of both the`ν+V-jet
(mjet ∈ [105, 130] GeV) and ``+V-jet (mjet ∈ [110, 130] GeV) analyses. This possibility
cannot be ignored because this search is not limited only to the bulk graviton model but
includes also a model-independent interpretation of the results (section 8.2).
The mVV distribution observed in the lower sideband region is corrected for the
pres-ence of minor backgrounds in order to have an estimation of the V+jets contribution in the control region of the data,FDATA,SBV+jets (mVV). The shape of the V+jets background distribu-tion in the signal region is obtained by rescalingFDATA,SBV+jets (mVV) forαMC(mVV). The final
prediction of the background contribution in the signal region,NBKGD
SR (mVV), is given by NSRBKGD(mVV) =CSRV+jets× F V+jets DATA,SB(mVV) ×αMC(mVV) + X k CSRk FMC,SRk (mVV), (6.2)
where the index k runs over the list of minor backgrounds and CSRV+jets andCk
SR represent
the normalizations of the yields of the dominant V+jets background and of the different
minor background contributions. The ratioαMC(mVV) reflects small kinematic differences
between the signal region and sideband, which are mostly independent from the theoretical prediction of cross sections. To test the validity and the robustness of the method, a closure test with data has been performed, predicting successfully the normalization and shape of the V+jets background in an upper sideband using the lower sideband data. The
mVV distribution of the background in the signal region is described analytically by a
function defined as f (x) ∝ e−x/(c0+c1x). Alternative fit functions have been studied but
their usage does not change the final performance. The mVV range of the fit determines
the region of masses probed by the searches. The range has been chosen such that there is a smoothly falling spectrum, in order to have a stable fit and robust control of the
background estimation. For the `ν+V-jet analysis, the fits are carried out in the mVV
range [700, 3000] GeV. In the ``+V-jet analysis, the ranges for the HP and LP categories
are [500, 2800] and [650, 2800] GeV, respectively. The fits are always unbinned. In the ``+V-jet analysis, the shapes of the background distributions for the muon and electron
channels are found to be statistically compatible. The final shape estimation for the
``+V-jet analysis has been carried out integrating over the two lepton flavors in order to reduce the statistical uncertainties in the fitted parameters.
JHEP08(2014)174
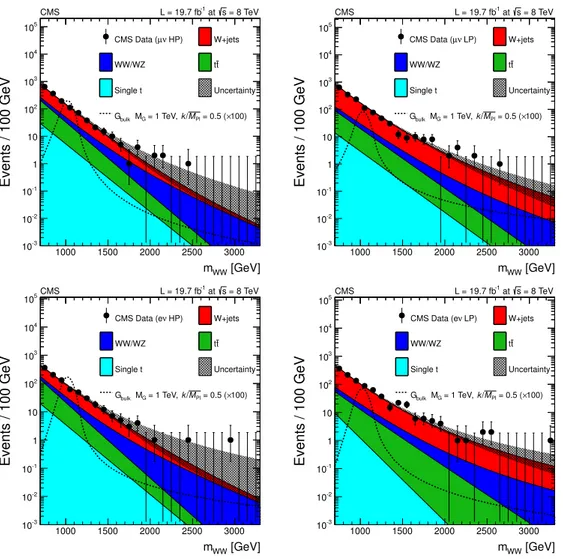
[GeV] WW m 1000 1500 2000 2500 3000 Events / 100 GeV -3 10 -2 10 -1 10 1 10 2 10 3 10 4 10 5 10 HP) ν µ CMS Data ( W+jets WW/WZ tt Single t Uncertainty 100) × = 0.5 ( Pl M / k = 1 TeV, G M bulk G = 8 TeV s at -1 CMS L = 19.7 fb [GeV] WW m 1000 1500 2000 2500 3000 Events / 100 GeV -3 10 -2 10 -1 10 1 10 2 10 3 10 4 10 5 10 LP) ν µ CMS Data ( W+jets WW/WZ tt Single t Uncertainty 100) × = 0.5 ( Pl M / k = 1 TeV, G M bulk G = 8 TeV s at -1 CMS L = 19.7 fb [GeV] WW m 1000 1500 2000 2500 3000 Events / 100 GeV -3 10 -2 10 -1 10 1 10 2 10 3 10 4 10 5 10 HP) ν CMS Data (e W+jets WW/WZ tt Single t Uncertainty 100) × = 0.5 ( Pl M / k = 1 TeV, G M bulk G = 8 TeV s at -1 CMS L = 19.7 fb [GeV] WW m 1000 1500 2000 2500 3000 Events / 100 GeV -3 10 -2 10 -1 10 1 10 2 10 3 10 4 10 5 10 LP) ν CMS Data (e W+jets WW/WZ tt Single t Uncertainty 100) × = 0.5 ( Pl M / k = 1 TeV, G M bulk G = 8 TeV s at -1 CMS L = 19.7 fbFigure 7. Final distributions in mWW for data and expected backgrounds for both the muon
(top) and the electron (bottom) channels, high-purity (left) and low-purity (right) categories. The 68% error bars for Poisson event counts are obtained from the Neyman construction as described in ref. [75]. Also shown is a hypothetical bulk graviton signal with mass of 1000 GeV andk/MPl= 0.5.
The normalization of the signal distribution is scaled up by a factor of 100 for a better visualization.
Figure 7shows the final observed spectrum in mWW of the selected events in the four
categories of the`ν+V-jet analysis. The observed data and the predicted background agree
with each other. The highest-mass event in the`ν+V-jet channel is from the electron LP
category and it hasmWW≈ 3200 GeV. This event is not included in the statistical analysis
of section 8, which is performed up to mWW of 3 TeV. The impact of this event on the
reported results is negligible since we produce limits for a narrow bulk graviton with a resonance mass up to 2.5 TeV. The observed event is compatible at the 1σ level with the
background prediction for mWW above 2.5 TeV.
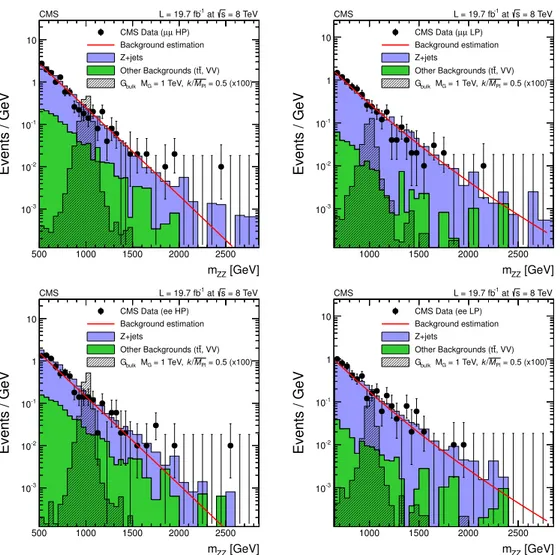
The mZZ distribution of the selected events in the ``+V-jet analysis is presented in
figure8. Also in this case, an overall good description in both normalization and shape of
the data by the background estimation is observed. The highest mass event in the``+V-jet
JHEP08(2014)174
[GeV] ZZ m 500 1000 1500 2000 2500 Events / GeV -3 10 -2 10 -1 10 110 CMS Data (Background estimationµµ HP)
Z+jets , VV) t Other Backgrounds (t = 0.5 (x100) Pl M / k = 1 TeV, G M bulk G = 8 TeV s at -1 CMS L = 19.7 fb [GeV] ZZ m 1000 1500 2000 2500 Events / GeV -3 10 -2 10 -1 10 1 10 CMS Data (µµ LP) Background estimation Z+jets , VV) t Other Backgrounds (t = 0.5 (x100) Pl M / k = 1 TeV, G M bulk G = 8 TeV s at -1 CMS L = 19.7 fb [GeV] ZZ m 500 1000 1500 2000 2500 Events / GeV -3 10 -2 10 -1 10 1
10 CMS Data (ee HP)Background estimation
Z+jets , VV) t Other Backgrounds (t = 0.5 (x100) Pl M / k = 1 TeV, G M bulk G = 8 TeV s at -1 CMS L = 19.7 fb [GeV] ZZ m 1000 1500 2000 2500 Events / GeV -3 10 -2 10 -1 10 1 10 CMS Data (ee LP) Background estimation Z+jets , VV) t Other Backgrounds (t = 0.5 (x100) Pl M / k = 1 TeV, G M bulk G = 8 TeV s at -1 CMS L = 19.7 fb
Figure 8. Final distributions inmZZ for data and expected backgrounds for both the muon (top)
and the electron (bottom) channels, high-purity (left) and low-purity (right) categories. Points with error bars show distributions of data; solid histograms depict the different components of the background expectation from simulated events. The 68% error bars for Poisson event counts are obtained from the Neyman construction as described in ref. [75]. Also shown is a hypothetical bulk graviton signal with mass of 1000 GeV and k/MPl = 0.5. The normalization of the signal
distribution is scaled up by a factor of 100 for a better visualization. The solid line shows the central value of the background predicted from the sideband extrapolation procedure.
6.2 Modeling of the signal mass distribution
The shape of the reconstructed signal mass distribution is extracted from the bulk
gravi-ton MC samples generated with the coupling k/MPl = 0.2, corresponding to an intrinsic
relative width of the resonance of about 0.2%. For models with k/MPl . 0.5, the
nat-ural width of the resonance is sufficiently small to be neglected when compared to the detector resolution. This makes our modeling of the detector effects on the signal shape independent of the actual model used for generating the events. In the final analysis of the
mVV spectrum, the discovery potential and exclusion power both depend on an accurate
JHEP08(2014)174
choosing a double-sided Crystal-Ball (CB) function (i.e., a Gaussian core with power law
tails on both sides) [76] to describe the CMS detector resolution. To take into account
dif-ferences between muon and electronpT resolutions at highpT, the signal mass distribution
is parametrized separately for events with electrons and muons. No appreciable differences
have been observed in themVV signal shape between low- and high-purity categories. The
typical width of the Gaussian core is about 3%–5% of the nominal mass in the ``+V-jet
channel or 4%–6% for the`ν+V-jet channel.
7 Systematic uncertainties
7.1 Systematic uncertainties in the background estimation
Uncertainties in the estimation of the background affect both the normalization and shape
of themVV distribution. Uncertainties in the background normalization are mainly
statis-tical in nature and scale with the amount of data in the sideband regions and the number
of events in the simulated samples. Tables 1 and 2 show the uncertainties in the
back-ground expectations for the`ν+V-jet and ``+V-jet analyses, respectively. The systematic
uncertainties in the V+jets background normalization are dominated by the statistical
un-certainty associated with the number of events in data in themjet sideband regions (below
10%). The systematic uncertainty in the tt normalization comes from the uncertainties in the data-to-simulation scale factors derived in the top-quark enriched control sample (below 5%). The systematic uncertainty in the WW inclusive cross section is assigned to be 20%, taken from the relative difference in the mean value between the published CMS
cross section measurement at√s = 8 TeV and the SM expectation [77]. An additional
sys-tematic uncertainty in the WW normalization comes from the uncertainty in the V-tagging
scale factors derived in section 5. The same uncertainties derived for WW are also used
for WZ and ZZ processes.
Systematic uncertainties in the background shape are estimated from the covariance matrix of the fit to the extrapolated sidebands and from the uncertainties in the
model-ing of αMC(mVV). They are both statistical in nature, as they are driven by the
avail-able data in the sidebands and the number of events generated for the simulation of the V+jets background.
7.2 Systematic uncertainties in the signal prediction
Systematic uncertainties affect both the signal efficiency and the mVV shape. Table 3
presents the primary uncertainties in the signal normalization. Among the sources of sys-tematic uncertainty in the signal efficiency are the muon momentum scale and resolution, the electron energy scale and resolution, the jet energy scale and resolution, and the un-clustered energy in the event. The event selection is applied to signal samples after varying the lepton four-momenta within one standard deviation of the corresponding uncertainty
in the muon momentum scale [54] or electron energy scale [56], or applying an appropriate
momentum/energy smearing in case of resolution uncertainties. The same procedure is also applied for the jet four-momenta using the corresponding energy scale and resolution
JHEP08(2014)174
uncertainties [64]. In this process, variations in the lepton and jet four-momenta are
prop-agated consistently to the Emiss
T vector. The signal efficiency is then recalculated using
modified lepton and jet four-momenta separately for each source of systematic uncertain-ties. The largest relative change in the signal efficiency compared to the default value is taken as the systematic uncertainty for that specific source. The muon, electron, and jet uncertainties are assumed to be uncorrelated.
The systematic uncertainties in the lepton trigger, identification, and isolation
effi-ciencies are derived using a dedicated tag-and-probe analysis in Z → `+`− events. The
uncertainties in trigger and identification+isolation efficiencies for muons are 3% and 4%, respectively. The total uncertainty in the electron trigger, identification, and isolation ef-ficiency is 3%. These uncertainties are evaluated taking into account the limited number of data events in the boosted regime. We also include systematic uncertainties in signal efficiency due to uncertainties in data-to-simulation scale factors for the V-tagging
iden-tification (derived from the top-quark enriched control sample, see section 5), and b-jet
identification efficiencies (derived with the methods described in ref. [63] and updated with
the 8 TeV data). The systematic uncertainties from pileup are assigned by re-weighting the signal simulation samples such that the distribution of the number of interactions per bunch crossing is shifted up and down by one standard deviation compared with that
found in data [78]. The impact of these changes on the signal efficiency is used to assess
the systematic effect. The impact of the proton PDF uncertainties on the signal efficiency
is evaluated with the PDF4LHC prescription [79] using MSTW [80] and NNPDF [81] PDF
sets. The uncertainty in the integrated luminosity is 2.6% [82].
Uncertainties in the scale and resolution of the four-momenta of the reconstructed
objects can bias the peak and smear the width of the signal profile. The systematic
uncertainties considered to affect the signal shape are the scale and resolution uncertainties on muons, electrons, jets, and the unclustered energy scale. For each of these sources of
experimental uncertainty, the lepton/jets four-momenta and Emiss
T vector are varied (or
smeared) by the relative uncertainty. In general, only small effects on the peak position and the width of the Gaussian core of the signal shapes have been found. The jet energy scale and resolution introduce a relative uncertainty of about 3% (2%) in the signal width
for the`ν+V-jet (``+V-jet) channel. In the `ν+V-jet channel, the unclustered energy scale
introduces a 1–3% uncertainty in the signal width, larger at low resonance masses. In the ``+V-jet channel, the muon resolution causes an additional relative uncertainty of 2% in the signal width. The uncertainty in the peak position of the signal is estimated to be less than 1%.
8 Statistical interpretation
The comparison between themVV distribution observed in data and the background
pre-diction from data is used to test for the presence of a resonance decaying to vector bosons. We set upper limits on the production cross section of a new resonance decaying to the
WW final state or the ZZ final state by combining the four event categories of the`ν+V-jet
prescrip-JHEP08(2014)174
Source Analysis
`ν+V-jet ``+V-jet
Muons (trigger and ID) 2% 5%
Muon scale 1% 2%
Muon resolution <0.1% 0.5%
Electrons (trigger and ID) 3% 3%
Electron scale <0.5% <0.5%
Electron resolution <0.1% <0.1%
Jet scale 1–3% 1%
Jet resolution <0.5% <0.1%
Unclustered energy scale <0.5% —
Pileup 0.5% 0.5%
V tagging 9% (HP)
24% (LP)
PDF <0.5%
Luminosity 2.6%
Table 3. Summary of systematic uncertainties in signal yield, relative to the expected number of observed signal events. All systematic uncertainties in the list are treated as uncorrelated.
tion described in refs. [83,84] (CLS method). The limits are computed using an unbinned
shape analysis. Systematic uncertainties are treated as nuisance parameters and profiled in the statistical interpretation using log-normal priors.
8.1 Limits on a narrow-width bulk graviton model
Exclusion limits can be set in the context of the bulk graviton model, under the assumption of a natural width negligible with respect to the experimental resolution (narrow-width
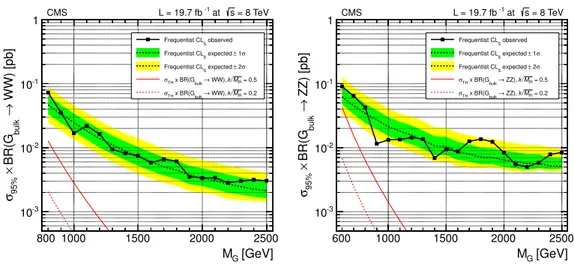
approximation). Figure 9 shows the 95% confidence level (CL) expected and observed
exclusion limits as a function of MG. The limits are compared with the cross section
times the branching fraction to WW and ZZ for a bulk graviton with k/MPl = 0.2 and
k/MPl= 0.5. These results were cross-checked with an alternative background estimation
from data, fitting the mVV distributions for the same selected events with a smoothly
falling function. This approach, common to previously released CMS results [19,32,85],
provides results very close to the baseline method described above, further strengthening our confidence in the robustness of the background estimation method.
The`ν+V-jet and ``+V-jet analyses are further combined together with a
complemen-tary CMS search in the VV → (qq(0))(qq(0)) → 2 V-jets final state [32] (dijet channel), in
order to maximize the sensitivity of the search for this specific model. The fully hadronic
analysis uses the same techniques to identify V-jets discussed in section 4.6. The
JHEP08(2014)174
[GeV] G M 1000 1500 2000 2500 WW) [pb] → bulk BR(G × 95% σ -3 10 -2 10 -1 10 1 observed S Frequentist CL σ 1 ± expected S Frequentist CL σ 2 ± expected S Frequentist CL = 0.5 Pl M / k WW), → bulk x BR(G TH σ = 0.2 Pl M / k WW), → bulk x BR(G TH σ CMS L = 19.7 fb -1 at s = 8 TeV 800 [GeV] G M 1000 1500 2000 2500 ZZ) [pb] → bulk BR(G × 95% σ -3 10 -2 10 -1 10 1 600 observed S Frequentist CL σ 1 ± expected S Frequentist CL σ 2 ± expected S Frequentist CL = 0.5 Pl M / k ZZ), → bulk x BR(G TH σ = 0.2 Pl M / k ZZ), → bulk x BR(G TH σ CMS L = 19.7 fb -1 at s = 8 TeVFigure 9. Observed (solid) and expected (dashed) 95% CL upper limits on the product of the graviton production cross section and the branching fraction of Gbulk→ WW (left) and Gbulk→ ZZ
(right). The cross section for the production of a bulk graviton multiplied by its branching fraction for the relevant process is shown as a red solid (dashed) curve fork/MPl = 0.5 (0.2), respectively.
are considered correlated at 100% among the three analyses entering the statistical combi-nation. The systematic uncertainties in electrons and muons are considered correlated at
100% between the``+V-jet and `ν+V-jet channels. The resulting 95% CL upper limits on
the signal cross section are shown in figure 10. The ``+V-jet channel is the only one
con-tributing to the limit for resonance masses below 800 GeV. In the range 800–2500 GeV, the `ν+V-jet channel dominates the sensitivity, although the ``+V-jet and dijet channels give significant contributions to the combined limit in the region below and above 1300 GeV, respectively. Because of the combination of the analyses, the expected upper limits on cross
section are made more stringent by about 15–20% compared to the individual `ν+V-jet
channel, depending on the resonance mass. The integrated luminosity of the sample is not
large enough to allow us to set mass limits on the bulk graviton models withk/MPl = 0.2
or 0.5. Figure 10 (right) presents also the local p-value of the significance of the excesses
observed in the data. No excesses with significances larger than two standard deviations are observed.
8.2 Model-independent limits
The analysis as presented above is specific to the case of a narrow bulk graviton model, but this is not the only extension of the SM predicting resonances decaying to vector bosons. Therefore it is useful to allow the reinterpretation of these results in a generic model. In this section we present the exclusion limits on the visible number of events after having introduced some modifications to the analysis that greatly simplify its structure, at a mod-erate price in terms of performance. Together with the upper limits on the number of signal events, we provide tables with the reconstruction and identification efficiencies for vector bosons in the kinematic acceptance of the analysis. Following the instructions detailed in
JHEP08(2014)174
[GeV] G M 1000 1500 2000 2500 ) [pb] bulk G → (pp 95% σ -3 10 -2 10 -1 10 1 Frequentist CLS observed σ 1 ± expected S Frequentist CL σ 2 ± expected S Frequentist CL = 0.5 Pl M / k ), bulk G → (pp TH σ I II III CMS L = 19.7 fb -1 at s = 8 TeV 600 [GeV] G M 1000 1500 2000 2500 p-value -4 10 -3 10 -2 10 -1 10 CMS L = 19.7 fb -1 at s = 8 TeV 600 σ 1 σ 2 σ 3Figure 10. Left: observed (solid) and expected (dashed) 95% CL upper limit on the graviton production cross section obtained with this analysis and the analysis of the all-hadronic channel [32]. The cross section for the production of a bulk graviton withk/MPl = 0.5 is shown as a red solid
curve. In region I, only the``+V-jet channel contributes. In region II, both ``+V-jet and `ν+V-jet channels contribute. In region III, both the semi-leptonic and all-hadronic channels contribute. Right: observed p-value as a function of the nominal signal mass. Conversions of the p-value to the number of standard deviations of a two-sided Gaussian distribution are drawn as dashed horizontal red lines.
would be expected to be detected in CMS with the collected integrated luminosity and to compare it with the upper limit on the number of events.
To avoid the dependence on the assumptions in the construction of the separate cat-egories, we perform a simplified analysis, reducing the event classification to one single category. We do this by adding the muon and electron channels and dropping the low-purity category (whose sensitivity is much smaller than the high-low-purity category). The loss in performance is very small over a large range of masses. The effect of dropping the LP category is visible only at very high masses, where the upper limit on the cross section becomes 15% less stringent.
A generic model cannot restrict itself to narrow signal widths, hence we provide limits
as a function of both mass (MX) and natural width (ΓX) of the new resonance. The
generated line shape is parametrized with a Breit-Wigner function (BW) and its width is defined as the Γ parameter of the BW. The BW line shape is convoluted with the
double-sided CB introduced in section 6.2 for describing the detector resolution. While different
values of ΓX are scanned, the parameters of the double-CB function are kept fixed to
the values determined under the narrow-width approximation. It was checked that the parametrization of the detector effects factorizes from the natural width of the resonance
and is stable as ΓXincreases. The width scan is done at regular steps of the relative width,
ΓX/MX. The range of values considered spans from the zero width approximation (as in
the nominal analysis), up to ΓX/MX= 0.40, in regular steps of 0.05.
We provide the efficiency as a function of the vector boson kinematic variables, as the efficiency can depend significantly on the production and decay kinematic quantities of the
JHEP08(2014)174
new resonance. The efficiencies are extracted from the bulk graviton samples generated for the baseline analysis. The efficiencies are calculated by first preselecting simulated signal events according to the acceptance requirements of the analysis. Thus the usage
of the tables is valid only within this kinematic region, summarized in tables 4 and 5 of
appendix A for the `ν+V-jet and ``+V-jet analyses, respectively. For preselected events,
the reconstructed V candidates are then independently checked to pass the full analysis
selection. The efficiency tables are presented as a function of thepT andη of the V boson
from the resonance decay prior to any simulation of detector effects. Bins with fewer than 25 events generated therein are excluded from the final tables. This choice controls the statistical uncertainty of the parametrization and has a very limited impact on the precision of the parametrized efficiencies because they are located in extreme regions of phase space. All the reweighting and rescaling effects (including lepton identification and trigger efficiencies, and V-tagging scale factors) are included in the efficiencies.
The efficiencies of the second-lepton and b-jet vetoes in the`ν+V-jet analysis are found
to be independent of the diboson event kinematic in signal events. We use a constant efficiency of 91.5% for the b-jet veto and 98.3% for the second-lepton veto, resulting in a
total efficiency for the two combined vetoes ofεvetoes= 90%.
It was checked that the dependence of the total signal efficiency and acceptance on the width of the generated sample is very mild. We include this effect in the systematic uncertainties of the procedure as discussed later. The resulting efficiencies are presented
in figures11 and 12 for W and Z bosons with longitudinal polarization, respectively. The
contribution from Z → τ τ decays with τ → `νν is not reported since it is suppressed by
the dilepton-mass requirement of the analysis described in section 4.5. The same values
are presented in tabulated form in appendixA.
Special care must be given to cases where the boson is transversely polarized (VT).
The calculated efficiencies are based on longitudinally polarized bosons, as in the case of the reference bulk graviton model. The efficiency of the V-tagging selections depend significantly on the degree of polarization of the vector boson [31]. This effect is investigated with samples of RS1 gravitons produced with the MadGraph generator. The V bosons originating from the decays of RS1 gravitons are transversely polarized in about 90% of the cases. In the cases of bosons decaying leptonically, the tables provided are still valid because of the generator-level selection on the individual leptons, which guarantees that polarization
effects for the leptonic boson are included in the acceptance. As shown in ref. [31], the
efficiency of the jet substructure selection is found to be lower for transversely polarized V bosons. Studies of simulated RS1 graviton samples show that the loss of efficiency is largely independent of the V kinematic variables, so that the effect of the transverse polarization
can be adequately modeled by a constant scale factor of 0.85, independent of theη and pT
of the V → qq.
To validate the procedure, the resulting parametrized efficiencies (including the event-veto efficiencies) are used to predict the total efficiency for reconstructing bulk and RS1 gravitons, and the estimation is compared to the exact number obtained from performing the baseline analysis directly on the simulated samples. In all cases, the agreement between the nominal and parametrized efficiencies is within 10% of their value. Various
approxi-JHEP08(2014)174
ID e ffi ci en cy × Reconstruction 0 0.1 0.2 0.3 0.4 0.5 0.6 0.7 0.8 0.9 1 [GeV] W T Generator p 500 1000 1500 2000 | W η Generator | 0 0.5 1 1.5 2 CMS Simulation s = 8 TeV ν µ → W ν ν ν µ → ν τ → W ID e ffi ci en cy × Reconstruction 0 0.1 0.2 0.3 0.4 0.5 0.6 0.7 0.8 0.9 1 [GeV] W T Generator p 500 1000 1500 2000 | W η Generator | 0 0.5 1 1.5 2 2.5 CMS Simulation s = 8 TeV ν e → W ν ν ν e → ν τ → W ID e ffi ci en cy × Reconstruction 0 0.1 0.2 0.3 0.4 0.5 0.6 0.7 0.8 0.9 1 [GeV] W T Generator p 500 1000 1500 2000 | W η Generator | 0 0.5 1 1.5 2 CMS Simulation s = 8 TeV q' q → L W ID e ffi ci en cy × Reconstruction 0 0.1 0.2 0.3 0.4 0.5 0.6 0.7 0.8 0.9 1 [GeV] Z T Generator p 500 1000 1500 2000 |Z η Generator | 0 0.5 1 1.5 2 CMS Simulation s = 8 TeV q q → L Z (W tagging)Figure 11. Reconstruction and identification efficiencies for the W → µν and W → τ ν → µννν (top left), W → eν and W → τ ν → eννν (top right), WL → qq0 (bottom left), and ZL → qq
(bottom right) decays as function of generated pV
T and ηV using the W-tagging requirements for
the hadronic V decays.
mations and uncertainties contribute to the final additional systematic uncertainty in the efficiency; the main ones are unaccounted correlations between the physics objects, statis-tical uncertainties due to limited size of the simulated sample, and residual dependencies on the natural width. We assign an additional systematic uncertainty of 15% on the total signal efficiency when calculating the model-independent limits. This additional systematic uncertainty conservatively addresses the remaining imperfections in the parametrization of the efficiencies.
Figure 13 and tables 6 and 7 of appendix A show the observed limits on the number
of events extracted from the simplified analysis, for the `ν+V-jet and ``+V-jet analyses
independently. The two analyses are not combined in order to avoid assumptions on the branching fractions of a hypothetic resonance decaying to both WW and ZZ channels.
The limits are calculated using an asymptotic approximation of the CLS method [86].