Glomerular Autoimmune Multicomponents of Human
Lupus Nephritis
In Vivo (2): Planted Antigens
Maurizio Bruschi,* Maricla Galetti,†‡Renato Alberto Sinico,§Gabriella Moroni,|Alice Bonanni,¶ Antonella Radice,§Angela Tincani,** Federico Pratesi,††Paola Migliorini,††Corrado Murtas,¶ Franco Franceschini,** Barbara Trezzi,§Francesca Brunini,§Rita Gatti,‡‡Regina Tardanico,§§ Giancarlo Barbano,¶Giorgio Piaggio,¶Piergiorgio Messa,|Pietro Ravani,||Francesco Scolari,¶¶ Giovanni Candiano,* Alberto Martini,*** Landino Allegri,†and Gian Marco Ghiggeri*¶ *Laboratory on Pathophysiology of Uremia and Divisions of¶Nephrology, Dialysis, and Transplantation and ***Paediatric Rheumatology, Scientific Institute for Research and Health Care (IRCCS), Istituto Giannina Gaslini, Genoa, Italy; Departments of†Clinical and Experimental Medicine and‡‡Biomedical, Biotechnological and Translational Sciences and ‡Italian Workers’ Compensation Authority (INAIL) Research Center, University of Parma, Parma, Italy;§Division of Nephrology, Section of Clinical Immunology, San Carlo Hospital, Milan, Italy;|Division of Nephrology and Dialysis, Scientific Institute for Research and Health Care (IRCCS) Fondazione Ospedale Maggiore, Mangiagalli, Regina Elena, Milan, Italy; **Rheumatology and Clinical Immunology, Spedali Civili and University of Brescia, Brescia, Italy;††Clinical Immunology Unit, Department of Internal Medicine, University of Pisa, Pisa, Italy;§§Service of Pathological Anatomy, Division of Nephrology, Spedali Civili di Brescia, Brescia, Italy;||Division of Nephrology, University of Calgary, Calgary, Alberta, Canada; and¶¶Division of Nephrology, University of Brescia, Montichiari Hospital, Brescia, Italy
ABSTRACT
Glomerular planted antigens (histones, DNA, and C1q) are potential targets of autoimmunity in lupus nephritis (LN). However, the characterization of these antigens in human glomeruliin vivo remains inconsistent. We eluted glomerular autoantibodies recognizing planted antigens from laser-microdissected renal biopsy samples of 20 patients with LN. Prevalent antibody isotypes were defined, levels were determined, and glomerular colocalization was investigated. Renal and circulating antibodies were matched, and serum levels were compared in 104 patients with LN, 84 patients with SLE without LN, and 50 patients with rheumatoid arthritis (RA). Autoantibodies against podocyte antigens (anti–a-enolase/antiannexin AI) were also investigated. IgG2 autoantibodies against DNA, histones (H2A, H3, and H4), and C1q were detected in 50%, 55%, and 70% of biopsy samples, respectively. Anti-DNA IgG3 was the unique non-IgG2 anti-DNA deposit, and anti-C1q IgG4 was mainly detected in subepi-thelial membranous deposits. Anti-H3, anti-DNA, and anti-C1q IgG2 autoantibodies were also prevalent in LN serum, which also contained IgG3 against the antigen panel and anti-C1q IgG4. Serum and glomerular levels of autoantibodies were not strictly associated. High serum levels of all autoantibodies detected, including anti– a-enolase and antiannexin AI, identified LN versus SLE and RA. Anti-H3 and anti–a-enolase IgG2 levels had the most remarkable increase in LN serum and represented a discriminating feature of LN in principal component analysis. The highest levels of these two autoantibodies were also associated with proteinuria.3.5 g/24 hours and creatinine.1.2 mg/dl. Our findings suggest that timely autoantibody characterization might allow outcome pre-diction and targeted therapies for patients with nephritis.
J Am Soc Nephrol 26: 1905–1924, 2015. doi: 10.1681/ASN.2014050493
Received May 20, 2014. Accepted September 30, 2014. Published online ahead of print. Publication date available at www.jasn.org.
Correspondence: Dr. Gian Marco Ghiggeri, Division of Ne-phrology, Dialysis and Transplantation, Laboratory on Pathophysiology
of Uremia, Istituto G. Gaslini, Largo G. Gaslini 5, Genoa 16147, Italy. Email: [email protected]
Lupus nephritis (LN) is the prototype of autoimmune GN. It is a clinically relevant condition1that is potentially causative of renal failure and death. Early identification and treatment is crucial to block autoantibody deposition and reverse the glo-merular inflammation. There is a consensus about an autoan-tibody genesis of LN2–5 mainly deriving from experimental models, but the mechanisms leading to the formation of im-mune deposits and the development of renal lesions are not clarified.6
Three categories of autoantibodies have been identified that constitute the basis for any pathologic and clinical consideration. Thefirst category targets implanted antigens (DNA, histones, and nucleosomes),7–10mainly deriving from breakdown of apopotic cells. The second category of antibodies binds C1q, which is a component of the com-plement cascade accumulating in the kidney in LN. The third category includes several podocyte antigens, mainly a-enolase and annexin AI, that have been only recently iden-tified.11 Other glomerular antigens can be included as well.11,12
Evidence from the literature suggests that it is the combination of all antibodies that produces stable renal lesions in LN and that different subsets have specific implications.12–16Experimental studies support the role of anti-DNA antibodies in starting the process2,17 and anti-podocyte antibodies in its maintainance.11In the case of anti-bodies versus DNA and/or DNA components (i.e., histones and nucleosomes),17 the binding is directed to basement membrane and mesangial matrix and seems propedeutic to further immune complex deposition.8,9Antibodies ver-sus podocyte antigens induce lupus-like renal lesions in mice, and the same antigens (i.e.,a-enolase) are targets of nephrogenic antibodies purified from MLR/MLR lupus-prone mice.11
Human studies are still weak, because renal tissuefindings are mainly on the basis of histopathology and electron microscopy. Relevant information is lacking on the com-position and characteristics of autoantibodies on the basis of an in vivo characterization of Igs microeluted directly from renal biopsies; until recently,11studies addressing compo-sition and quality of renal autoantibodies in human LN were limited to postmortem kidney tissues.18,19Technologies are now available that allow minute isolation of glomeruli from fresh renal biopsies and characterization of autoantibodies/ antigens. Laser microdissection and proteomics already have been successfully used to widen the spectrum of podo-cyte antigens in LN11 and other primary autoimmune GNs.20–23
We applied the same laboratory approach (laser microdis-section and proteomics) to characterize renal autoantibodies directed against implanted antigens (i.e., histones H1, H2A, H2B, H3, and H4, DNA, and C1q) in renal biopsies and serum of the same 20 patients already used for studying podocyte antigens.11Matched tests with serum antibodies (here includ-ing anti–a-enolase and antiannexin AI IgG2) were done in a
large cohort of patients with LN or SLE at different stages of the diseases compared with rheumatoid arthritis (RA) and controls.
RESULTS
Characterization of Glomerular Autoantibodies Versus Implanted Antigens
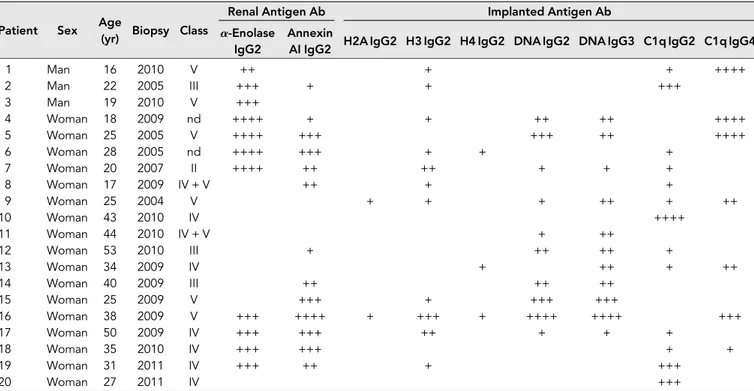
For the study of glomerular expression of autoantibodies, renal biopsies from 20 patients with LN who underwent the pro-cedure at the onset of urinary symptoms were used (Table 1). Serum levels of autoantibodies were determined in the same cohort.
Anti-DNA and Antihistones
Autoantibodies versus DNA (plasmid DNA was used as afixed antigen) and its protein component histones were detected with different patterns in glomerular eluates.
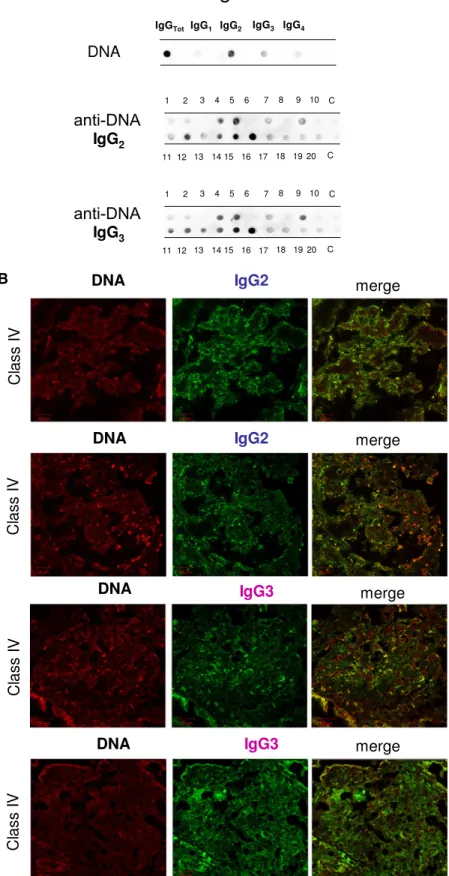
As shown in Figure 1A, significant amounts of anti-DNA IgG2 and IgG3 were present with the same intensity in ,50% of the same biopsies (6 of 20 and 8 of 20, respec-tively). Colocalization of IgG2 and IgG3 with DNA (Figure 1B) was present with the same intensity in all positive biopsies.
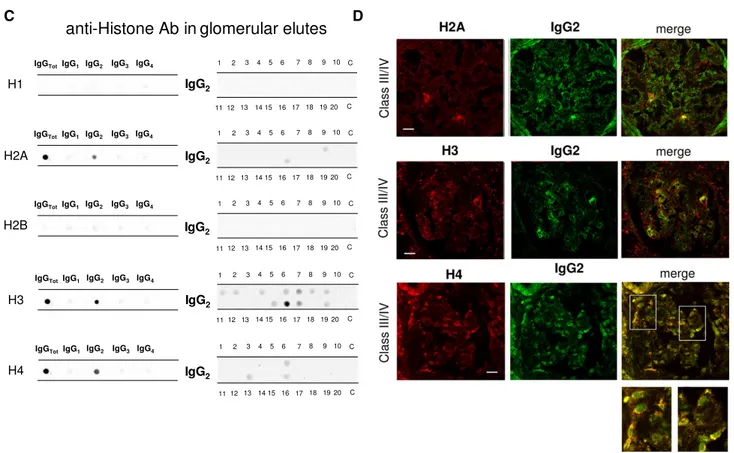
Antihistone H2A, H3, and H4 were primarily of the IgG2 isotype. Other isotypes were negative; anti-H1 and anti-H2B could not be detected (Figure 1C). Anti-H3 IgG2 was the ma-jor antihistone component (positive in 10 of 20), although it presented a weak positivity (Figure 1C); strong reactivity was found in only one sample. In general and with some variabil-ity, histone expression within glomeruli was diffuse (most ev-ident for H4), but colocalization with IgG2 was segmental (Figure 1D).
Anti-C1q
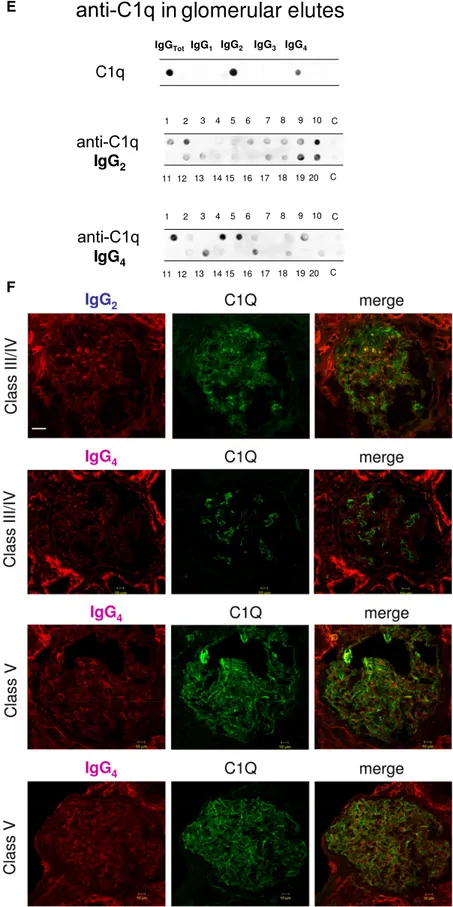
Anti-C1q autoantibodies were present in several glomerular elutes (Figure 1E). They principally consisted of IgG2 and IgG4 that were differently distributed in 20 biopsies: patients positive for IgG4 (patients 1, 4, 5, and 16) were negative for IgG2, and vice versa, patients 2, 10, 19, and 20 were positive for IgG2 and negative for IgG4. Actually, only four biopsies had a strong/medium positivity for anti-C1q IgG2; positivity to IgG4 was medium strong in four patients with class V LN and low medium in two patients with class IV. One strongly positive patient had an undetermined pattern (Tables 1 and 2). To exclude a phenomenon of aggregation between IgG4 and IgG2,24 the same dot blot was repeated along a gradient of NaCl (0.15–1.5 M) to disrupt potential aggregates between the two Igs: results excluded this interaction (Supplemental Figure 1). Colocalization of C1q with IgG2 and IgG4 is shown in Figure 1F. In the case of IgG2, colocalization was not widespread, and there were areas where the two compo-nents were well separated (Figure 1F, class IV). Colocalization of IgG4 was negative in all patients of pure proliferative lesions
(including patient 13), whereas it was positive in a patient with subepithelial immune deposits (class V).
Multiple Glomerular Autoantibody Expressions and Correla-tion with Serum Antibodies
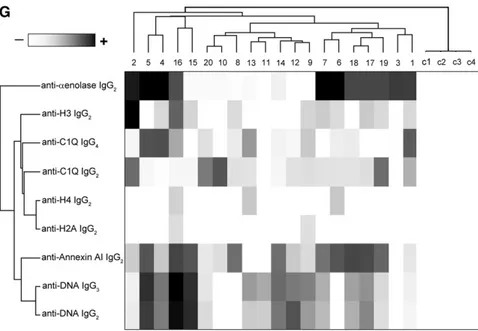
Table 2 shows the glomerular level of each antibody; in Fig-ure 1G, multiple positivities were analyzed with cluster anal-ysis (heat map). The results confirmed predominance of IgG2 versus endogenous glomerular antigens (anti– a-enolase and antiannexin AI) followed by anti-DNA and anti-C1q IgG2. In some cases, IgG2 and IgG3 were of the same intensity, which was the case of anti-DNA. Class spec-ificity was only found for anti-C1q IgG4, which was mainly detected in class V LN and colocalized in subepithelial de-posits (Figure 1F).
Glomerular and serum levels of specific antibodies in the same 20 biopsies were determined and tentatively correlated (Supplemental Figure 2). The majorfinding was that, overall, glomerular deposition was independent from serum levels. Glomerular levels of a few antibodies that were low in serum (i.e., anti-C1q IgG2-IgG3 and anti-DNA IgG2-IgG3; level in serum=0.5 mg/L or less), were, in some patients, comparable with anti–a-enolase IgG2 (serum level=50–100 mg). The ra-tio between glomerular and serum concentrara-tions was con-sequently higher by a variable factor from 40 to 250 for the former group of antibodies compared with anti–a-enolase IgG2 (median=1.1, 2.5, 0.4, and 1.6 versus 0.01), implying
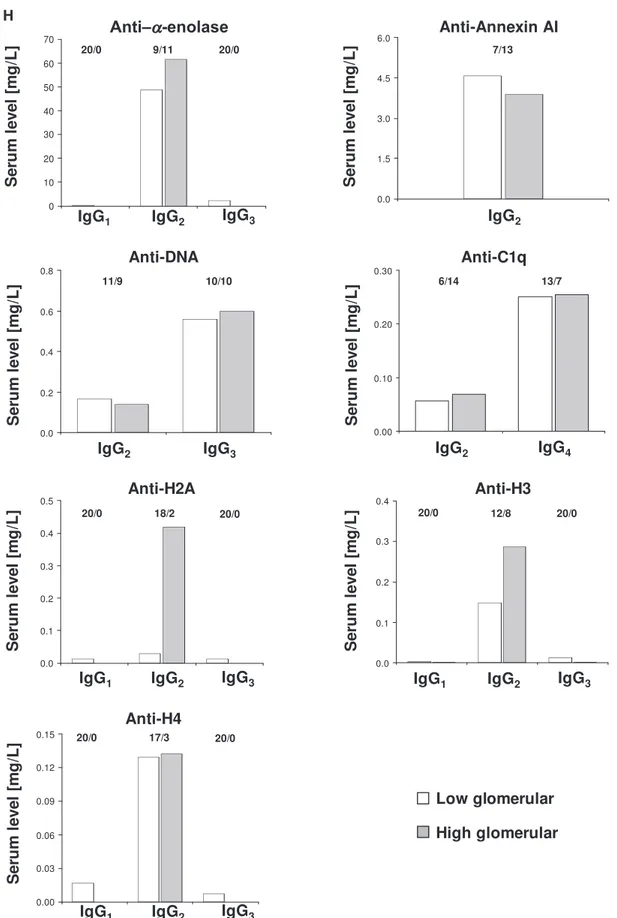
that affinity of each antibody to its target is quite variable. Using Spearman analysis, only a few correlations among se-rum and glomerular levels of antibodies of secondary impor-tance (i.e., anti–H4-IgG1 and IgG2 and anti-H3 IgG2) were observed (correlogram in Supplemental Figure 2). When pa-tients were subdivided according to the level of antibody in glomeruli (i.e., high and low antibody), no important differ-ence could be seen in serum levels, with the exception of anti-H2A and anti-H3 IgG2 (Figure 1H). However, antihistone antibodies are minor glomerular components, and correla-tions with serum levels seem of no definite value.
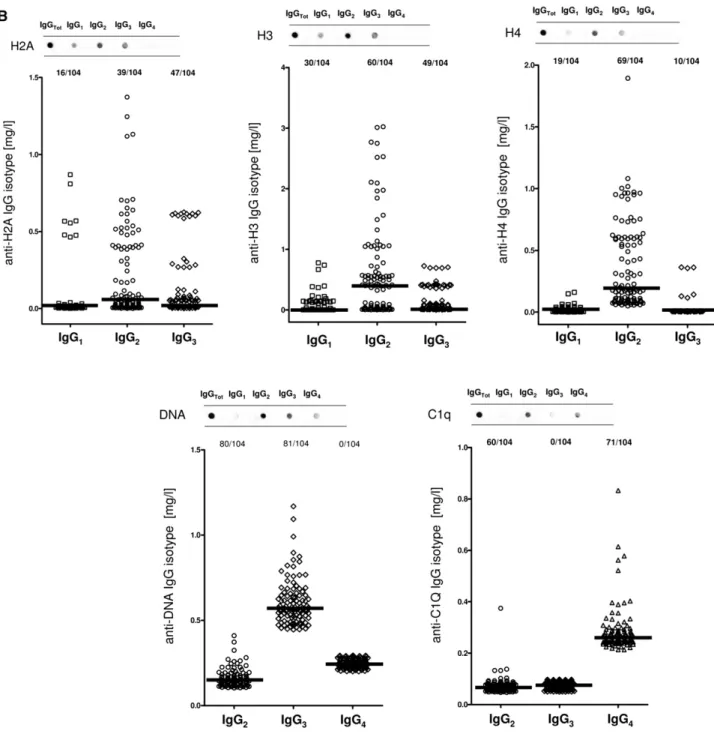
Serum Autoantibodies Versus Implanted Antigens Serum antibody levels were determined in 334 patients belonging to different SLE categories with (n=104) and without (n=84) LN, 50 patients with RA, and 96 normal controls. Dot blot was used for characterizing isotypes, and specific ELISAs were devised for determining serum levels.
Anti-H2A, -H3, and -H4
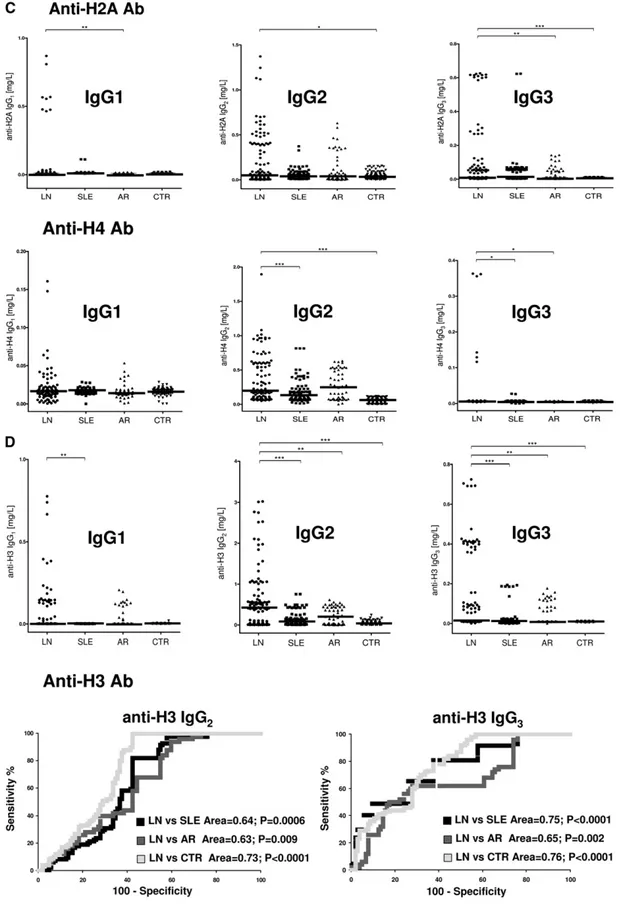
The isotypes of antihistone antibodies in serum included IgG1, IgG2, and IgG3, with a prevalence of IgG2 (Figure 2, A and B). Serum levels of anti-H3 IgG2 and IgG3 were higher in LN compared with the other groups (P,0.001); 58% and 47% of patients with LN had serum levels of IgG2 and IgG3, respectively, higher than the 95° percentile of normality
Table 1. Pathology characteristics and positivity/amount of different autoantibodies in glomerular eluates in 20 patients with LN
Patient Sex Age
(yr) Biopsy Class
Renal Antigen Ab Implanted Antigen Ab
a-Enolase IgG2
Annexin
AI IgG2 H2A IgG2 H3 IgG2 H4 IgG2 DNA IgG2 DNA IgG3 C1q IgG2 C1q IgG4
1 Man 16 2010 V ++ + + ++++ 2 Man 22 2005 III +++ + + +++ 3 Man 19 2010 V +++ 4 Woman 18 2009 nd ++++ + + ++ ++ ++++ 5 Woman 25 2005 V ++++ +++ +++ ++ ++++ 6 Woman 28 2005 nd ++++ +++ + + + 7 Woman 20 2007 II ++++ ++ ++ + + + 8 Woman 17 2009 IV + V ++ + + 9 Woman 25 2004 V + + + ++ + ++ 10 Woman 43 2010 IV ++++ 11 Woman 44 2010 IV + V + ++ 12 Woman 53 2010 III + ++ ++ + 13 Woman 34 2009 IV + ++ + ++ 14 Woman 40 2009 III ++ ++ ++ 15 Woman 25 2009 V +++ + +++ +++ 16 Woman 38 2009 V +++ ++++ + +++ + ++++ ++++ +++ 17 Woman 50 2009 IV +++ +++ ++ + + + 18 Woman 35 2010 IV +++ +++ + + 19 Woman 31 2011 IV +++ ++ + +++ 20 Woman 27 2011 IV +++
These patients underwent a renal biopsy at the time of the enrolment and had their renal tissue processed with laser capture for antibody characterization. Data
relative to the antirenal antigen antibodies have been presented in a separate paper11and are here shown for comparison with antibodies versus implanted
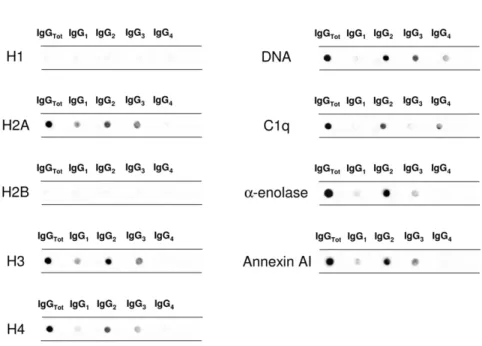
Figure 1. Glomerular autoantibodies and implanted antigens: isotypes in single biopsies. Renal biopsies obtained from 20 patients with LN (Supplemental Table 1) at the time of appearance of urinary symptoms were processed with laser capture, and microdissected glomeruli were used for elution of autoantibodies. (A, C, and E) Definition of most representative isotypes on pooled samples was done with dot blot analysis and followed by single-biopsy analysis. The same glomerular eluates used for anti–a-enolase and antiannexin AI
(Figure 2D, Table 3); ROC analysis showed a medium degree of specificity/sensitivity for both antibodies, particularly for LN ver-sus SLE (areas under the curve=0.75 and 0.64, respectively). Anti-DNA
Anti-DNA isotypes in serum included IgG2, IgG3, and a minor component of IgG4 (Figure 2A). Serum levels of anti-DNA
IgG2 and IgG3 were higher in LN compared with SLE and other groups (P,0.001) (Figure 2E, Table 3). ROC curves showed a very high specificity of both antibodies in differentiating LN and SLE (area under the curve=0.83 for both), whereas the performance was lower in the case of comparison with AR (area under the curve=0.62 for both).
antibodies were processed for definition of isotypes of antibodies versus implanted antigens (DNA, H2A, H3, H4, and C1q). In all cases, after the definition of prevalent isotype, competition experiments using the same glomerular eluates and increasing amounts of the specific antigen from 5 to 15 ng to saturate antibodies were done (not shown). In B, D, and F, the colocalization of each implanted antigen with the most relevant antibodies in single renal biopsy samples (IgG2 and IgG3 for DNA; IgG2 for H2A, H3, and H4; and IgG2 and IgG4 for C1q) is reported. In B and D, double IF staining was evaluated for each antigen (red) and IgG2 (green), whereas in F, the antigen is in green and IgG is in red. Merged images are reported in yellow. The last box in Figure 1 D is the magnification of white frame. For anti-C1q IgG4, confocal images include different renal biopsy specimens with LN classes III–IV and V. Colocalization was absent in the case of class IV LN, whereas it was well evident in subepithelia deposits in biopsies of patients with class V LN. Magnification of the same figures is in Supplemental Figure 3. Scale bar, 20mm in A–C; 10 mm. Original magnification, 3630. In G, the hierarchical cluster analysis heat map for single antibody in each renal biopsy is shown: antibody intensities (colors from black [high] to gray [medium] to white [low]) are reported in lines and refer to single patient biopsies that are reported at the bottom of thefigure. Results are given for 20 patients with LN of our study cohort and four normal kidneys; a semiquantitative evaluation of the same data is reported in Tables 1 and 2. A preliminary heat map analysis of autoantibody expressed in biopsies of 20 patients enrolled in the study has been already presented in thefirst part of this study11; thisfigure includes
anti-DNA IgG3 and anti-C1q IgG4, which have been only now characterized. In H, the serum levels of antibodies are reported considering two different population of patients with detectable (high) and undetectable (low) glomerular levels. The numbers of positive/negative con-sidering the overall numbers of 20 biopsies are shown. Glomerular levels of each antibody were calculated from the dot blot and the standard curve that included different concentrations of each antibody (Supplemental Figure 4). For serum levels, specific ELISAs were used as described in Concise Methods.
Anti-C1q
Anti-C1q antibodies in serum included IgG2 and IgG4 isotypes. Serum levels were higher in LN than in other groups for both (P,0.001); 57% and 68% presented serum levels of IgG2 and IgG4, respectively, higher than the 95° of normality (Figure 2F, Table 3). Specificity was high in particular for LN versus controls (areas under the curve=0.88 and 0.93, respectively).
Clinical Correlations
High serum levels of all antibodies (in-cluding anti–a-enolase and antiannexin AI IgG2) allowed us to identify patients with LN: antipodocyte differentiated LN from AR, whereas anti-H3 and anti-DNA had better performance in differentiating LN from SLE (Figure 3A). Principal com-ponent analysis (PCA) was used as the multivariate discriminating test. When patients were analyzed separately in re-spect to autoantibody levels (here includ-ing antipodocyte antibodies), LN, SLE, RA, and controls were well discriminated (Figure 3B); anti–a-enolase IgG2 and anti-H3 IgG2/IgG3 contributed signifi-cantly in characterizing different popula-tions (Figure 3C). Actually, anti–a-enolase IgG2 and anti-H3 IgG2 serum levels pre-sented the highest median fold increment (10-fold for both) (Figure 3D), implying that there are patients with very high, me-dium, and normal levels. High levels of both anti-H3 IgG2 and anti–a-enolase IgG2 were associated with heavy protein-uria (.3.5 g/24 h) and reduced renal func-tion (creatinine.1.2% mg); intermediate serum levels were associated with inter-mediate proteinuria (1–3.5 g/24 h), whereas low levels had no association. Serum levels of other antibodies presented less impressive increment but were overall still associated with proteinuria (Figure 4, C–J).
DISCUSSION
This study was designed to identify and char-acterize autoantibodies versus implanted antigens in biopsies of patients with LN in vivo. This is the second part of a study on lupus renal antigens in human LN, and findings related to the identification of
podocyte antigens have been recently published in JASN.11In this second approach, antibodies versus implanted anti-gens were eluted from laser-microdissected glomeruli of the same 20 biopsies and characterized in respect to composition, isotype, amount, and colocalization in each biopsy; the merge between glomerular and serum levels was a crucial part of the study.
Correlation with pathology and clinical characteristics with patients with LN led to relevant conclusions on the basis of the following major results: (1) autoantibodies versus po-docyte antigens predominate in renal biopsies over implanted antigens, which were still present; (2) IgG2 represented the most relevant isotype in all cases followed by anti-DNA IgG3; anti-C1q IgG4 was limited to membranous deposits (class V); (3) anti-C1q IgG4/IgG2 and anti-DNA IgG2/IgG3 deposition occurred despite low serum levels, suggesting high affinity; and (4) IgG2 also predominated in serum, but the isotype panel was less stringent; in some cases (i.e., anti–a-enolase and anti-H3), IgG2 increment was higher than 10-fold of normal levels and identified a category of patients with high risk of developing proteinuria and renal failure. Altogether and with some differences, high serum levels of IgG2/IgG3 antibodies identified with very high specificity LN versus SLE/RA: anti–a-enolase and antiannexin AI IgG2 better dif-ferentiated LN from AR (89% specificity), and anti-H3 and anti-DNA had a better performance in differentiating LN from SLE (75% and 83% specificity, respectively).
Owing to the novelty of the approach used here (laser microdissection and proteomics) and considering that these are thefirst data on renal autoantibodies in human LN in vivo, findings should represent the starting point to reconsider mechanisms of LN and develop biomarkers. Thefirst issue is pathogenesis, which is mainly focused on target antigens
and antibody isotypes. With respect to target antigens, ourfindings confirm pre-vious observations: DNA/histones as tar-gets of autoimmunity in human LN have been from time to time shown by immu-noelectronmicroscopy9; the implication of a-enolase and annexin AI has been shown in the companion paper11and is further discussed here. Actually, other stud-ies reported an association of antiannexin antibodies with peculiar autoimmune con-ditions, such as discoid lupus25and anti-phospholipid syndrome, typically a serious condition potentially causing vascular events.26–28 Therefore, our results go in the direction of other reports that already suggested a generic implication of anti-histones, anti-DNA, and antipodocyte antibodies.11,29,30
Looking at the renal composition of autoantibodies, a relevant finding here is the preponderance in glomeruli of anti-bodies of the IgG2 isotype (anti–a-enolase/annexin AI and H3 histone) with little amounts of anti-DNA IgG3 and predom-inant colocalization of anti-IgG4 with C1q in subepithelial deposits of class V biopsies. IgG2 were unexpected, because these antibodies are weak complement activators compared with IgG1 and IgG3.31Immunofluorescence on the same bi-opsies used for the proteomic approach confirmed IgG2 prev-alence but also showed IgG1 and IgG3 (Supplemental Figure 3). We cannot exclude that IgG1 and IgG3 are directed versus other glomerular autoantigens, and research should now focus on this point, because there are at least 11 podocyte antigens that are good candidates for being investigated.11We also con-sidered that the timing of the biopsy probably has strong in-fluence on this aspect; anticipating the biopsy at the time of presentation of minimal urinary signs would allow the iden-tification of more precocious antibodies, because it is known32–34that renal immune deposits may anticipate the onset of clinical symptoms.
Presence and colocalization of IgG4 with C1q in subepi-thelial membranous deposits are also new and of interest, clearly suggesting that membranous and proliferative lesions originate from partially different mechanisms. The finding about IgG4 prevalence in subepithelial deposits creates a link with idiopathic membranous nephritis (MGN) that typically is characterized by IgG4 deposition.20,21,35,36The basic con-cept that primary (as in the case of MGN) and secondary subepithelial deposits (as in the case of class V LN) can be differentiated on the basis of the IgG isotype should, there-fore, be reviewed considering the presence of anti-C1q IgG4 in the latter case. In both conditions, there is a promiscuity of target antigens (anti-PLA2R, anti-AR, and anti-SOD in MGN20,36antipodocyte and implanted in LN) and anti-body isotypes that should bring us to consider a more
complex pathogenesis than expected. A clearly speculative possibility is that, in both MGN and LN, some antigens/anti-bodies comefirst (e.g., anti-PLA2R in MGN and anti-implanted in LN) and are followed by others that represent a general podocyte response to the former autoimmunity. Anti-C1q IgG4 clearly represents a second-phase antibody, because C1q deposits develop after an initial autoimmune process
has started. This finding supports the two-phase theory above.
Concomitance of IgG2 prevalence in renal glomeruli and serum antibodies confirms and further supports the idea of the key importance of antibodies of IgG2 isotype in human lupus GN. It is of note that, in the case of anti–a-enolase IgG2, serum levels are in the range of hundreds of milligrams per liter, with a
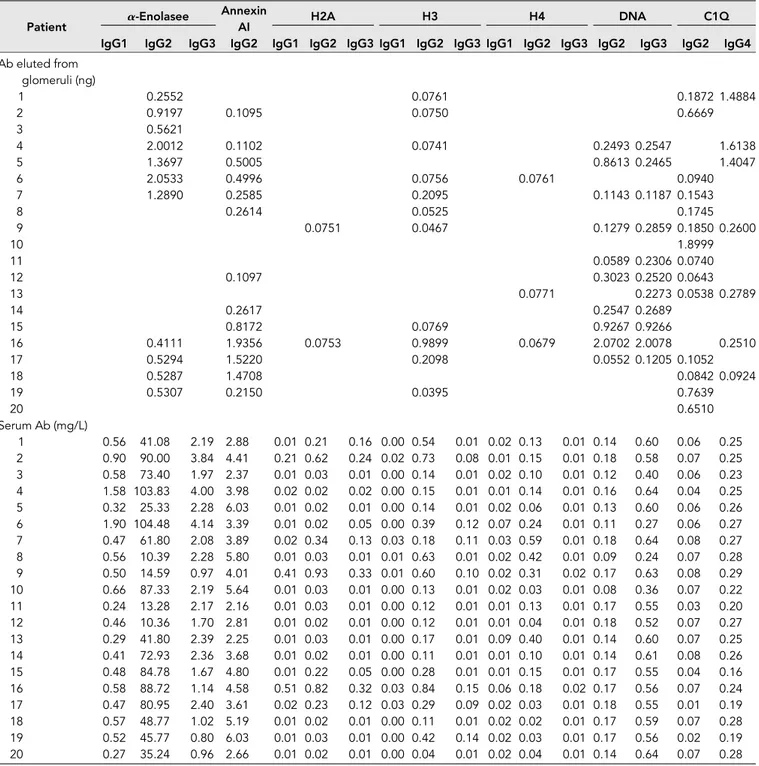
Table 2. Levels of each antibody in glomerular eluates and serum were determined in 20 patients with LN for whom a renal biopsy was available
Patient a-Enolasee
Annexin
AI H2A H3 H4 DNA C1Q
IgG1 IgG2 IgG3 IgG2 IgG1 IgG2 IgG3 IgG1 IgG2 IgG3 IgG1 IgG2 IgG3 IgG2 IgG3 IgG2 IgG4 Ab eluted from glomeruli (ng) 1 0.2552 0.0761 0.1872 1.4884 2 0.9197 0.1095 0.0750 0.6669 3 0.5621 4 2.0012 0.1102 0.0741 0.2493 0.2547 1.6138 5 1.3697 0.5005 0.8613 0.2465 1.4047 6 2.0533 0.4996 0.0756 0.0761 0.0940 7 1.2890 0.2585 0.2095 0.1143 0.1187 0.1543 8 0.2614 0.0525 0.1745 9 0.0751 0.0467 0.1279 0.2859 0.1850 0.2600 10 1.8999 11 0.0589 0.2306 0.0740 12 0.1097 0.3023 0.2520 0.0643 13 0.0771 0.2273 0.0538 0.2789 14 0.2617 0.2547 0.2689 15 0.8172 0.0769 0.9267 0.9266 16 0.4111 1.9356 0.0753 0.9899 0.0679 2.0702 2.0078 0.2510 17 0.5294 1.5220 0.2098 0.0552 0.1205 0.1052 18 0.5287 1.4708 0.0842 0.0924 19 0.5307 0.2150 0.0395 0.7639 20 0.6510 Serum Ab (mg/L) 1 0.56 41.08 2.19 2.88 0.01 0.21 0.16 0.00 0.54 0.01 0.02 0.13 0.01 0.14 0.60 0.06 0.25 2 0.90 90.00 3.84 4.41 0.21 0.62 0.24 0.02 0.73 0.08 0.01 0.15 0.01 0.18 0.58 0.07 0.25 3 0.58 73.40 1.97 2.37 0.01 0.03 0.01 0.00 0.14 0.01 0.02 0.10 0.01 0.12 0.40 0.06 0.23 4 1.58 103.83 4.00 3.98 0.02 0.02 0.02 0.00 0.15 0.01 0.01 0.14 0.01 0.16 0.64 0.04 0.25 5 0.32 25.33 2.28 6.03 0.01 0.02 0.01 0.00 0.14 0.01 0.02 0.06 0.01 0.13 0.60 0.06 0.26 6 1.90 104.48 4.14 3.39 0.01 0.02 0.05 0.00 0.39 0.12 0.07 0.24 0.01 0.11 0.27 0.06 0.27 7 0.47 61.80 2.08 3.89 0.02 0.34 0.13 0.03 0.18 0.11 0.03 0.59 0.01 0.18 0.64 0.08 0.27 8 0.56 10.39 2.28 5.80 0.01 0.03 0.01 0.01 0.63 0.01 0.02 0.42 0.01 0.09 0.24 0.07 0.28 9 0.50 14.59 0.97 4.01 0.41 0.93 0.33 0.01 0.60 0.10 0.02 0.31 0.02 0.17 0.63 0.08 0.29 10 0.66 87.33 2.19 5.64 0.01 0.03 0.01 0.00 0.13 0.01 0.02 0.03 0.01 0.08 0.36 0.07 0.22 11 0.24 13.28 2.17 2.16 0.01 0.03 0.01 0.00 0.12 0.01 0.01 0.13 0.01 0.17 0.55 0.03 0.20 12 0.46 10.36 1.70 2.81 0.01 0.02 0.01 0.00 0.12 0.01 0.01 0.04 0.01 0.18 0.52 0.07 0.27 13 0.29 41.80 2.39 2.25 0.01 0.03 0.01 0.00 0.17 0.01 0.09 0.40 0.01 0.14 0.60 0.07 0.25 14 0.41 72.93 2.36 3.68 0.01 0.02 0.01 0.00 0.11 0.01 0.01 0.10 0.01 0.14 0.61 0.08 0.26 15 0.48 84.78 1.67 4.80 0.01 0.22 0.05 0.00 0.28 0.01 0.01 0.15 0.01 0.17 0.55 0.04 0.16 16 0.58 88.72 1.14 4.58 0.51 0.82 0.32 0.03 0.84 0.15 0.06 0.18 0.02 0.17 0.56 0.07 0.24 17 0.47 80.95 2.40 3.61 0.02 0.23 0.12 0.03 0.29 0.09 0.02 0.03 0.01 0.18 0.55 0.01 0.19 18 0.57 48.77 1.02 5.19 0.01 0.02 0.01 0.00 0.11 0.01 0.02 0.02 0.01 0.17 0.59 0.07 0.28 19 0.52 45.77 0.80 6.03 0.01 0.03 0.01 0.00 0.42 0.14 0.02 0.03 0.01 0.17 0.56 0.02 0.19 20 0.27 35.24 0.96 2.66 0.01 0.02 0.01 0.00 0.04 0.01 0.02 0.04 0.01 0.14 0.64 0.07 0.28
For serum antibody levels, specific ELISAs were used. For their concentration in glomerular eluates, a dot blot was used (Concise Methods). In some cases, levels
fold increment up to 10 times over the 95° of normality, which is the level rarely reported in human pathology. However, animal models already highlighted the role of anti-DNA IgG2 in deter-mining immunodeposits in mice: almost all models of LN induced by anti-DNA clones used mAbs of the IgG2 isotype.11,17,37
Characterizing renal and circulating antibodies allowed us to address several questions about the significance ofbiomarkers.In the case of LN and despite recent evolution,38,39no biomarker of glomerular pathology is so far available for patients with SLE, and urine analysis still represents the unique index of renal in-volvement. Inflammatory molecules expressed by renal tubular epithelia, such as CSF-1, are of clear interest, but their rise may underscore minimal proteinuria and be a part of a general mech-anism of tubular cells activation.40–42
Proteinuria is very discriminative between LN and disease controls (SLE, RA, and normal controls) but represents the outcome and cannot be used in positive prediction, for definition, in LN. Therefore, any predictive efforts should be targeted to immunologic biomarkers of lupus activity as we here propose. Whether the autoantibodies proposed in our study anticipate proteinuria remains to be proven by pro-spective studies, which are now in progress.
On the road of biomarker development, despite that we suggest that a complex multisystem is involved, we also
propose a simplification that may evolve from bench to bedside. Refining target molecules (no H1/H2B/H4 detected), de-fying isotype (main focus on IgG2) and new antigens (a-enolase and annexin AI), and introducing a quantitative assay would improve the predictive and statisti-cal significance. Antipodocyte and anti-DNA/H3 antibodies might represent the bulk of an assay for monitoring patients and trying to anticipate renal lesions. Ow-ing to the prevalence of IgG2 and the ex-istence of a strong correlation between IgG2 and IgG3, to determine only IgG2 would simplify the role of clinical chemists. Overall, a chip targeting serum anti –a-eno-lase, antiannexin AI, anti-H3, and anti-DNA IgG2 antibodies would be of easy assembly and limited cost. Anti-C1q should also in-clude IgG4. The real issue now is to under-stand how the above antibodies can predict the evolution to LN/renal failure, which means defining the temporary limits in which they precede the onset of proteinuria. New prospective studies in patients with uncom-plicated SLE are now in progress to address this crucial point and define the panel of au-toantibody of interest.
Finally, in clear contrast with previous papers, we could not confirm other anti-bodies as biomarkers of LN (e.g., anti– a-actinin, antilaminin, antifibronectin, antimyosin, and anticollagen).5,43In all cases, the target antigen is represented by ubiquitous proteins well expressed in both podocytes (the cell model here used) and mesangial cells. Actually, we did not show the presence of such antibodies in glomeruli, and we believe that they do not represent a major quota of autoanti-bodies in serum. Crossreactivity with anti-DNA could explain the difference with our results44–46
In conclusion, several new hints on LN derive from the direct analysis of antibodies directly eluted from glomeruli of patients with LN. Specific IgG2 deposition in most cases and prevalent IgG4 in membranous deposits suggest different mechanisms or phases in renal lesions. Analysis of circulating antibodies underscored a main position of IgG2 targeted to the same renal antigens and proposed a panel of antibodies that could represent the start point for a predictive assay to be used in prospective studies.
CONCISE METHODS Patients
Overall, 184 patients with SLE were included in the study (Supplemental Table 2), and their sera were used for studies on circulating
Figure 2. Circulating autoantibodies and implanted antigens in serum of patients with LN. (A) For each antibody detected in serum (including all implanted antigens), the definition of isotype was done with dot blot analysis. (B) Determination of antibody levels in serum was done with self-made ELISAs in 184 patients with SLE, 104 of whom had LN. Results are expressed as medians and interquartile ranges. (C–G) Comparison of serum levels for each antibody (including ROC curves) in SLE, LN, and AR. The same data are reported in Table 3. ROC curves for antibodies with high circulating levels were calculated to determine specificity and sensitivity versus SLE, RA, and normal subjects. *P,0.05; **P,0.01; ***P,0.001.
autoantibodies; 104 patients with LN were recruited when they underwent a renal biopsy for diagnostic purposes, and all had a diagnosis of LN on the basis of typical renal lesions. Fresh frozen renal samples were available for 20 patients and used for the proteomic approach (Supplemental Table 1). For histol-ogic evaluation of kidney disease, Dubosq–Bresil solution-fixed tissues were embedded in paraffin, sectioned, and stained with hematoxylin/eosin, Masson’s trichrome, periodic acid–Schiff, and silver methenamine periodic acid–Schiff. Routine IMF studies on frozen sections were performed using anti-human IgG, IgA, IgM, C1q, C3, andfibrinogen antibody. Sera were also obtained from 100 normal controls of the same age. Routine serological
analyses were done with commercial assays (Supplemental Mate-rial).
Normal Kidneys
Noncarcinomatous portions of kidneys removed for renal cancer were obtained from four patients and processed as negative tissue controls with laser capture.
Ethical Committee
Permission for the study was given on June 10, 2010, by the Ethical Committee of San Carlo Borromeo Hospital. Informed consent for the study was obtained from all participants.
Cell Culture
Human conditionally immortalized podocyte cell lines47were a gift from M.A. Saleem (University of Bristol, Bristol, UK). They were cultured in RPMI 1640 supplemented with 10% inactivated FCS, insulin transferrin selenium, 100 units/ml penicillin, and 100 mg/ml streptomycin.
Antibodies
Antibody sources are reported as Supplemental Material.
Laser Capture Microdissection and Elution of Antibodies from Renal Biopsy Tissue
Laser capture microdissection and elution of antibodies were done as already described21,23; details are given in Supplemental Material.
Two-Dimensional Electrophoresis
Two-dimensional electrophoresis of podocyte extracts (gift from M.A. Saleem) was performed in soft gels as described.48A detailed description is given in Supplemental Material.
Monodimensional Electrophoresis
Gradient PAGE was done according to Laemmli.49
Western Blot
Western blot with glomerular eluates and sera was done with podocyte cell line whole extracts separated by either mono- or bidimensional electrophoresis. Equipment and technique of analysis are described in Supplemental Material.
Gel/Membrane Staining and Image Analyses
After separation in SDS-PAGE gels, proteins were visualized by a double-staining procedure: the methyl-trichloroacetate negative double-staining followed by the blue silver colloidal Coomassie50for preparative mass spectrometry analysis. Images of stained gels were digitized using a GS800 photometer, and Western blots were acquired using a Versa DOC 400. All images were analyzed with the PD Quest software (Bio-Rad, Hercules, CA).
Classic Immunofluorescence and Colocalization
Renal biopsy specimens were embedded in OCT (Tissue Tek; Miles Inc., Elkhart, IN) and stored in liquid nitrogen; 3-mm sections were
Table 3. Serum levels of autoantibodies versus different renal antigens, including podocyte proteins and implanted antigens Aut oant ibo dies and Prot einu ria LN (n =104) SLE (n =84) AR (n =50) CTR (n =100 ) Medi an (mg/ L) Int erqua rtil e > 95° N (%) Medi an (mg/ L) Int erqua rti le > 95° N (%) P vers us LN Medi an (mg/ L) Int erq uart ile > 95° N (%) P vers us LN Medi an (mg/ L) Int erqu artil e > 95° N (%) P ver sus LN uPr ot24 h T 0 2.35 3.3 1 102 0.08 0.08 9 0.08 0.06 4 0.0 7 0.08 0.14 AEN O IgG 1 T0 0.36 0.4 6 1 7 0.38 0.34 0 0.03 0.01 0 0.4 4 0.37 0.79 6 AEN O IgG 2 T0 45.3 7 73.3 6 8 4 (81) 24. 76 30.0 5 5 0 (69 ) , 0.00 1 3.67 8.42 8 , 0.00 1 5.4 3 10. 57 15.8 2 , 0.0 01 AEN O IgG 3 T0 1.58 2.1 1 1 5 1.18 1.68 0 — 0.13 0.01 0 , 0.00 1 2.0 5 2.14 3.80 — AEN O IgG 4 T0 2.54 1.6 0 8 2.26 1.43 0 — 0.56 0.01 0 , 0.00 1 2.5 1 2.14 4.30 — ANX 1 IgG 2 T0 4.08 4.2 5 7 6 (73) 3.33 2.45 52 (62 ) , 0.00 1 2.08 0.90 9 , 0.01 1.3 1 0.36 2.71 , 0.0 01 H2A IgG 1 T0 0.01 26 0.0 6 1 6 0.01 37 0.00 4 4 — 0.01 05 0.00 4 1 , 0.01 0.0 136 0.00 4 0.02 — H2A IgG 2 T0 0.05 6 0.3 8 3 9 0.03 9 0.04 5 — 0.04 5 0.22 14 — 0.0 387 0.05 3 0.15 , 0.0 5 H2A IgG 3 T0 0.01 2 0.0 6 4 7 0.01 2 0.05 38 — 0.01 1 0.04 0 2 0 — 0.0 12 0.00 1 0.01 3 — H3 IgG 1 T0 0.00 3 0.0 3 3 0 0.00 3 0.00 1 0 , 0.01 0.00 3 0.04 6 1 5 (3 0 ) — 0.0 03 0.00 1 0.00 4 — H3 IgG 2 T0 0.40 8 0.7 0 6 0 (58) 0.07 0.14 26 (31 ) , 0.00 1 0.19 2 0.42 27 (5 2) , 0.01 0.0 36 0.05 0.14 , 0.0 01 H3 IgG 3 T0 0.01 2 0.1 4 4 9 (47) 0.01 1 0.00 4 1 7 (20 ) — 0.01 1 0.08 19 (3 8) , 0.05 0.0 11 0.00 4 0.01 2 , 0.0 01 H4 IgG 1 T0 0.01 6 0.0 8 1 9 0.01 7 0.00 4 5 — 0.01 5 0.00 4 7 — 0.0 17 0.00 3 0.02 — H4 IgG 2 T0 0.19 2 0.5 0 6 9 0.13 2 0.15 48 , 0.00 1 0.25 0 0.45 31 — 0.0 54 0.08 0.11 5 , 0.0 01 H4 IgG 3 T0 0.00 7 0.0 01 10 0.00 7 0.00 1 4 , 0.05 0.00 7 0.00 1 0 , 0.05 0.0 08 0.00 1 0.00 8 — DNA IgG 2 T0 0.14 9 0.0 5 8 0 (77) 0.11 8 0.02 22 (26 ) , 0.00 1 0.13 3 0.04 30 (6 0) , 0.05 0.1 13 0.01 0.12 6 , 0.0 01 DNA IgG 3 T0 0.57 3 0.1 4 8 1 (78) 0.48 6 0.04 23 (27 ) , 0.00 1 0.52 8 0.10 31 (6 2) , 0.05 0.4 69 0.04 0.50 8 , 0.0 01 C1Q IgG 2 T0 0.06 8 0.0 2 6 0 (57) 0.05 6 0.01 16 (19 ) , 0.00 1 0.05 4 0.01 2 , 0.00 1 0.0 47 0.01 0.06 4 , 0.0 01 C1Q IgG 4 T0 0.26 3 0.0 4 7 1 (68) 0.23 5 0.03 26 (31 ) , 0.00 1 0.23 3 0.02 8 , 0.00 1 0.2 08 0.04 0.24 9 , 0.0 01 Ant ibo d ie s lev els were det erm ined fo r e ve ry iso typ es wi th spe ci fic E LIS As an d e xp res sed as mil ligr ams per lit er.
cut by a cryostat (Leica CM1850; Leica Mycrosystems) and placed on poly–L-lysine–coated glass slides for indirect immunostaining. De-tails of staining are given in Supplemental Material.
Characterization of Autoantibody Isotype and Levels in Single-Biopsy Eluate
Autoantibody isotypes for both endogenous and implanted antigens and single-biopsy levels were evaluated with dot blot using a Bio-Dot apparatus (Bio-Rad): the nitrocellulose membrane was prewetted in TBS and mounted on the apparatus. Constant amounts of
recombi-nant protein (100 ng) in TBS were placed on the nitrocellulose membrane for 4 hours at room temperature and then, at 4°C overnight; a vacuum was then applied for a few minutes. The nitro-cellulose was then gently removed and saturated with 5% BSA in TBS. Samples (glomerular eluates and sera) diluted 1:50 in TBS-T (0.05% [vol/vol]) and 1% (wt/vol) BSA were placed on the membrane and left for 6 hours at room temperature and then, at 4°C overnight; at the end, the membrane was washed three times in TBS-T. Incubation with HPR–anti-human IgGs (IgG1, IgG2, IgG3, and IgG4 diluted in 1% [wt/vol] BSA in TBS-T) was performed for 4 hours at room
Figure 3. Clinical characteristics within different patients with LN on the basis of serum antibody levels. For this comparison, data already shown in Figures 1 and 2 and Tables 1 and 2 were analyzed with hierarchical cluster analysis and PCA. (A) The former test combines and compares simultaneously serum levels of each specific antibody (and includes different isotypes); the resulting heat map, where colors from red (maximum) to green (minimum) indicate the relative abundances, gives an estimate of how different parameters separate patients on the basis of the presence of nephritis. It seems that serum anti–a-enolase and antiannexin AI IgG2 separate LN and AR better than other antibodies, whereas anti-H3 IgG2/IgG3 and anti-DNA do it for LN versus SLE. (B) PCA gives an overall picture of statistical power of every single clinical and laboratory parameter. When all patients were analyzed with respect to autoantibody levels (here including antipodocyte antibodies), the four population of LN, SLE, AR, and normal controls were clearly separated (different colors). When proteinuria was in-cluded in the analysis, the same result was obtained according to which of the four population was comparably separated. (C) Considering LN alone, anti–a-enolase IgG2 and anti-H3 IgG2/IgG3 contributed significantly in characterizing these patients, whereas proteinuria and other clinical tests (VES, CPR, renal function, etc.) were of no value. (D) Serum antibodies presented in some case a notable fold increment that reached 10 times the 95° of normality. Anti-H3IgG2 and anti–a-enolase IgG2 had the highest performances.
Figure 4. Clinical associations of each antibody with relevant clinical characteristics. Odd ratios and confidence intervals were calculated for the association of each antibody with relevant clinical characteristics, such as proteinuria, renal function, and lupusflare (A-J). Anti–-enolase IgG2 and anti-H3 IgG3 had the best performance in relation to renal parameters (proteinuria and renal function), and anti-C1q and anti-DNA better correlated with lupusflares.
temperature. The membrane was then washed three times for 15 minutes each with TBS-T before developing the immune reaction with SuperSignal West Pico Chemiluminescent substrate (Thermo Fisher Scientific). A standard curve for each antibody consisted of different concentrations of HPR-conjugate IgG of different isotypes (IgG1, IgG2, IgG3, and IgG4), and it was built to cover the whole range of Ig concentrations in eluates (Supplemental Figure 4). Results were given as nanograms per 100ml eluate. Images of stained gels were digitized using a GS800 photometer, and Western blots were acquired using a Versa DOC 400. All images were analyzed with the PD Quest software (Bio-Rad).
ELISA for Determination of Serum Antibody Levels
The following conditions were used for determining serum levels of each antibody with self-made ELISA; specific changes, such as the amount of antigen used, are reported below. One hundred microliters antigen was used for all; the same MaxiPrep 96-well plate was used for every assay. Aliquots (200ml) of blocking solution (PBS, 5% [wt/vol] BSA, and 0.05% [vol/vol] Tween20) were put in each well. Serum samples (100ml) were diluted 1:50 in PBS-Tween20 (PBST; 0.05% [vol/vol]), and BSA (1% [wt/vol]) was added and incubated for 4 hours at room temperature and then, at 4°C overnight. After three washes in PBST, HRP-conjugated anti-human IgGs (IgG1, IgG2, IgG3, and IgG4) diluted 1:3000 in PBST and 1% (wt/vol) BSA were incubated at room temperature for 4 hours, and after three washes in PBST, 100ml substrate TMB/H2O2(10:1) was added and incubated up to 30 minutes. The reaction was stopped by adding 100ml 0.45 M H2SO4to any wells before reading absorbance at 450 nm. A standard curve was prepared using each HRP-IgG at different dilutions.
Amount of Antigen Related to Different Assay
Recombinanta-enolase (100 ng), annexin AI (5 ng), H2A, H3, and H4 (45 ng), DNA (40 ng), and C1q (100 ng) were used.
Statistical Analyses
We summarized serum levels of antibodies as medians and inter-quartile ranges. We used nonparametric Wilcoxon tests for unpaired data to compare antibody titers in different patient cohorts. We used two-tailed P values,0.05 as the level of significance in all analyses. We used data on antibodies levels for each patient to build multivariate data matrix. In PCA, we used orthogonal transformation to convert the set of possibly correlated observations for each patient into a set of values of linearly uncorrelated variables (principal components). In the LN cohort, we used PCA to explain which parameters best de-scribed the differences versus other patient cohorts. In both cases, principal components 1 and 2 were used to perform the PCA plot.
The heat map of the hierarchical cluster analysis ranked statistically significant differences of antibodies in serum of the whole patient population and/or glomeruli eluted from 20 biopsies of patients with LN. Correlations between glomerular and serum levels were analyzed with Spearman coefficient; for graphical representation, we used a correlogram with a tree dendrogram, in which similar variables are coupled according to the results of cluster analysis.
We used univariate and multivariate logistic regression analyses to identify risk factors associated with antibodies titer above 95°
percentile. For those antibodies with the great variability (anti– a-enolase and anti-H3IgG2), we tested the association of same risk factors with values between 95% and the median, the median and the third quartile, and above the third quartile. We used linear regression to test whether serum antibody levels predicted log2transformation of proteinuria, serum creatinine, CPR, C3, or C4; the R software was used for all analyses.
ACKNOWLEDGMENTS
The Giannina Gaslini Institute provided financial and logistical support to the study. This work was also supported by the Italian Ministry of Health Ricerca Corrente and contributions derived from Cinque per mille dell’IRPEF. We also acknowledge contributions from the Renal Child Foundation.
DISCLOSURES None.
REFERENCES
1. Cameron JS: Lupus nephritis. J Am Soc Nephrol 10: 413–424, 1999 2. Madaio MP: The relevance of antigen binding to the pathogenicity of
lupus autoantibodies. Kidney Int 82: 125–127, 2012
3. Waldman M, Madaio MP: Pathogenic autoantibodies in lupus nephritis. Lupus 14: 19–24, 2005
4. Bagavant H, Fu SM: Pathogenesis of kidney disease in systemic lupus erythematosus. Curr Opin Rheumatol 21: 489–494, 2009
5. Hanrotel-Saliou C, Segalen I, Le Meur Y, Youinou P, Renaudineau Y: Glomerular antibodies in lupus nephritis. Clin Rev Allergy Immunol 40: 151–158, 2011
6. Borchers AT, Leibushor N, Naguwa SM, Cheema GS, Shoenfeld Y, Gershwin ME: Lupus nephritis: A critical review. Autoimmun Rev 12: 174–194, 2012
7. Kramers C, Hylkema MN, van Bruggen MC, van de Lagemaat R, Dijkman HB, Assmann KJ, Smeenk RJ, Berden JH: Anti-nucleosome antibodies complexed to nucleosomal antigens show anti-DNA re-activity and bind to rat glomerular basement membrane in vivo. J Clin Invest 94: 568–577, 1994
8. Kalaaji M, Mortensen E, Jørgensen L, Olsen R, Rekvig OP: Nephritogenic lupus antibodies recognize glomerular basement membrane-associated chromatin fragments released from apoptotic intraglomerular cells. Am J Pathol 168: 1779–1792, 2006
9. Kalaaji M, Fenton KA, Mortensen ES, Olsen R, Sturfelt G, Alm P, Rekvig OP: Glomerular apoptotic nucleosomes are central target structures for nephritogenic antibodies in human SLE nephritis. Kidney Int 71: 664– 672, 2007
10. Mjelle JE, Rekvig OP, Van Der Vlag J, Fenton KA: Nephritogenic anti-bodies bind in glomeruli through interaction with exposed chromatin fragments and not with renal cross-reactive antigens. Autoimmunity 44: 373–383, 2011
11. Bruschi M, Sinico RA, Moroni G, Pratesi F, Migliorini P, Galetti M, Murtas C, Tincani A, Madaio M, Radice A, Franceschini F, Trezzi B, Bianchi L, Giallongo A, Gatti R, Tardanico R, Scaloni A, D’Ambrosio C, Carnevali ML, Messa P, Ravani P, Barbano G, Bianco B, Bonanni A, Scolari F, Martini A, Candiano G, Allegri L, Ghiggeri GM: Glomerular autoimmune multicomponents of human lupus nephritis in vivo (1):
a-Enolase and annexin AI [published online ahead of print May 1, 2014]. J Am Soc Nephrol 10.1681/ASN.2013090987
12. Mannik M, Merrill CE, Stamps LD, Wener MH: Multiple autoantibodies form the glomerular immune deposits in patients with systemic lupus erythematosus. J Rheumatol 30: 1495–1504, 2003
13. Pankewycz OG, Migliorini P, Madaio MP: Polyreactive autoantibodies are nephritogenic in murine lupus nephritis. J Immunol 139: 3287–3294, 1987 14. Sabbaga J, Pankewycz OG, Lufft V, Schwartz RS, Madaio MP: Cross-reactivity distinguishes serum and nephritogenic anti-DNA antibodies in human lupus from their natural counterparts in normal serum. J Au-toimmun 3: 215–235, 1990
15. Zhang J, Jacobi AM, Wang T, Berlin R, Volpe BT, Diamond B: Poly-reactive autoantibodies in systemic lupus erythematosus have patho-genic potential. J Autoimmun 33: 270–274, 2009
16. Li QZ, Xie C, Wu T, Mackay M, Aranow C, Putterman C, Mohan C: Iden-tification of autoantibody clusters that best predict lupus disease activity using glomerular proteome arrays. J Clin Invest 115: 3428–3439, 2005 17. Krishnan MR, Wang C, Marion TN: Anti-DNA autoantibodies initiate
experimental lupus nephritis by binding directly to the glomerular basement membrane in mice. Kidney Int 82: 184–192, 2012 18. Krishnan C, Kaplan MH: Immunopathologic studies of systemic lupus
erythematosus. II. Antinuclear reaction of gamma-globulin eluted from homogenates and isolated glomeruli of kidneys from patients with lu-pus nephritis. J Clin Invest 46: 569–579, 1967
19. Mannik M, Wener MH: Deposition of antibodies to the collagen-like region of C1q in renal glomeruli of patients with proliferative lupus glomerulonephritis. Arthritis Rheum 40: 1504–1511, 1997
20. Prunotto M, Carnevali ML, Candiano G, Murtas C, Bruschi M, Corradini E, Trivelli A, Magnasco A, Petretto A, Santucci L, Mattei S, Gatti R, Scolari F, Kador P, Allegri L, Ghiggeri GM: Autoimmunity in membra-nous nephropathy targets aldose reductase and SOD2. J Am Soc Nephrol 21: 507–519, 2010
21. Bruschi M, Carnevali ML, Murtas C, Candiano G, Petretto A, Prunotto M, Gatti R, Argentiero L, Magistroni R, Garibotto G, Scolari F, Ravani P, Gesualdo L, Allegri L, Ghiggeri GM: Direct characterization of target podocyte antigens and auto-antibodies in human membranous glo-merulonephritis: Alfa-enolase and borderline antigens. J Proteomics 74: 2008–2017, 2011
22. Murtas C, Bruschi M, Candiano G, Moroni G, Magistroni R, Magnano A, Bruno F, Radice A, Furci L, Argentiero L, Carnevali ML, Messa P, Scolari F, Sinico RA, Gesualdo L, Fervenza FC, Allegri L, Ravani P, Ghiggeri GM: Coexistence of different circulating anti-podocyte antibodies in membranous nephropathy. Clin J Am Soc Nephrol 7: 1394–1400, 2012 23. Murtas C, Bruschi M, Carnevali ML, Petretto A, Corradini E, Prunotto M, Candiano G, degl’Innocenti ML, Ghiggeri GM, Allegri L: In vivo char-acterization of renal auto-antigens involved in human auto-immune diseases: The case of membranous glomerulonephritis. Proteomics Clin Appl 5: 90–97, 2011
24. Uwatoko S, Mannik M: Low-molecular weight C1q-binding immunoglobulin G in patients with systemic lupus erythematosus consists of autoantibodies to the collagen-like region of C1q. J Clin Invest 82: 816–824, 1988 25. Kretz CC, Norpo M, Abeler-Dörner L, Linke B, Haust M, Edler L,
Krammer PH, Kuhn A: Anti-annexin 1 antibodies: A new diagnostic marker in the serum of patients with discoid lupus erythematosus. Exp Dermatol 19: 919–921, 2010
26. Salle V, Mazière JC, Smail A, Cévallos R, Mazière C, Fuentes V, Tramier B, Makdassi R, Choukroun G, Vittecoq O, Goëb V, Ducroix JP: Anti-annexin II antibodies in systemic autoimmune diseases and anti-phospholipid syndrome. J Clin Immunol 28: 291–297, 2008
27. de Laat B, Derksen RH, Mackie IJ, Roest M, Schoormans S, Woodhams BJ, de Groot PG, van Heerde WL: Annexin A5 polymorphism (-1C—.T) and the presence of anti-annexin A5 antibodies in the antiphospholipid syndrome. Ann Rheum Dis 65: 1468–1472, 2006
28. Zhou D, Luo N, Wu Q, You Y, Zhai Z, Mou Z, Wu Y, Hao F: Transcellular distribution heterogeneity of Annexin A5 represents a protective
response to lupus-related thrombophilia: A pilot Proteomics-based study. Biochem Biophys Res Commun 420: 357–363, 2012
29. Gullstrand B, Lefort MH, Tydén H, Jönsen A, Lood C, Johansson A, Jacobsen S, Truedsson L, Bengtsson AA: Combination of autoanti-bodies against different histone proteins influences complement-dependent phagocytosis of necrotic cell material by polymorphonuclear leukocytes in systemic lupus erythematosus. J Rheumatol 39: 1619– 1627, 2012
30. Sui M, Lin Q, Xu Z, Han X, Xie R, Jia X, Guo X, Zhang W, Guan X, Ren H: Simultaneous positivity for anti-DNA, anti-nucleosome and anti-histone antibodies is a marker for more severe lupus nephritis. J Clin Immunol 33: 378–387, 2013
31. Bindon CI, Hale G, Brüggemann M, Waldmann H: Human monoclonal IgG isotypes differ in complement activating function at the level of C4 as well as C1q. J Exp Med 168: 127–142, 1988
32. Cavallo T, Cameron WR, Lapenas D: Immunopathology of early and clinically silent lupus nephropathy. Am J Pathol 87: 1–18, 1977 33. Arbuckle MR, McClain MT, Rubertone MV, Scofield RH, Dennis GJ,
James JA, Harley JB: Development of autoantibodies before the clin-ical onset of systemic lupus erythematosus. N Engl J Med 349: 1526– 1533, 2003
34. Wakasugi D, Gono T, Kawaguchi Y, Hara M, Koseki Y, Katsumata Y, Hanaoka M, Yamanaka H: Frequency of class III and IV nephritis in systemic lupus erythematosus without clinical renal involvement: An analysis of predictive measures. J Rheumatol 39: 79–85, 2012 35. Kerjaschki D: Pathomechanisms and molecular basis of membranous
glomerulopathy. Lancet 364: 1194–1196, 2004
36. Beck LH Jr., Bonegio RG, Lambeau G, Beck DM, Powell DW, Cummins TD, Klein JB, Salant DJ: M-type phospholipase A2 receptor as target antigen in idiopathic membranous nephropathy. N Engl J Med 361: 11–21, 2009
37. D’Andrea DM, Coupaye-Gerard B, Kleyman TR, Foster MH, Madaio MP: Lupus autoantibodies interact directly with distinct glomerular and vascular cell surface antigens. Kidney Int 49: 1214–1221, 1996 38. Sinico RA, Radice A, Ikehata M, Giammarresi G, Corace C, Arrigo G,
Bollini B, Li Vecchi M: Anti-C1q autoantibodies in lupus nephritis: Prevalence and clinical significance. Ann N Y Acad Sci 1050: 193–200, 2005
39. Moroni G, Radice A, Giammarresi G, Quaglini S, Gallelli B, Leoni A, Li Vecchi M, Messa P, Sinico RA: Are laboratory tests useful for monitoring the activity of lupus nephritis? A 6-year prospective study in a cohort of 228 patients with lupus nephritis. Ann Rheum Dis 68: 234–237, 2009 40. Menke J, Rabacal WA, Byrne KT, Iwata Y, Schwartz MM, Stanley ER,
Schwarting A, Kelley VR: Circulating CSF-1 promotes monocyte and macrophage phenotypes that enhance lupus nephritis. J Am Soc Nephrol 20: 2581–2592, 2009
41. Menke J, Iwata Y, Rabacal WA, Basu R, Yeung YG, Humphreys BD, Wada T, Schwarting A, Stanley ER, Kelley VR: CSF-1 signals directly to renal tubular epithelial cells to mediate repair in mice. J Clin Invest 119: 2330–2342, 2009
42. Menke J, Amann K, Cavagna L, Blettner M, Weinmann A, Schwarting A, Kelley VR: Colony stimulating factor 1: A potential biomarker for lupus nephritis [published online ahead of print July 10, 2014]. J Am Soc Nephrol 10.1681/ASN.2013121356
43. Renaudineau Y, Deocharan B, Jousse S, Renaudineau E, Putterman C, Youinou P: Anti-alpha-actinin antibodies: A new marker of lupus ne-phritis. Autoimmun Rev 6: 464–468, 2007
44. Mostoslavsky G, Fischel R, Yachimovich N, Yarkoni Y, Rosenmann E, Monestier M, Baniyash M, Eilat D: Lupus anti-DNA autoantibodies cross-react with a glomerular structural protein: A case for tissue injury by molecular mimicry. Eur J Immunol 31: 1221–1227, 2001
45. Deocharan B, Zhou Z, Antar K, Siconolfi-Baez L, Angeletti RH, Hardin J, Putterman C: Alpha-actinin immunization elicits anti-chromatin autoimmunity in nonautoimmune mice. J Immunol 179: 1313–1321, 2007
46. Zhao Z, Weinstein E, Tuzova M, Davidson A, Mundel P, Marambio P, Putterman C: Cross-reactivity of human lupus anti-DNA antibodies with alpha-actinin and nephritogenic potential. Arthritis Rheum 52: 522– 530, 2005
47. Saleem MA, O’Hare MJ, Reiser J, Coward RJ, Inward CD, Farren T, Xing CY, Ni L, Mathieson PW, Mundel P: A conditionally immortalized hu-man podocyte cell line demonstrating nephrin and podocin expres-sion. J Am Soc Nephrol 13: 630–638, 2002
48. Bruschi M, Musante L, Candiano G, Ghiggeri GM, Herbert B, Antonucci F, Righetti PG: Soft immobilized pH gradient gels in proteome analysis: A follow-up. Proteomics 3: 821–825, 2003
49. Laemmli UK: Cleavage of structural proteins during the assembly of the head of bacteriophage T4. Nature 227: 680–685, 1970
50. Candiano G, Bruschi M, Musante L, Santucci L, Ghiggeri GM, Carnemolla B, Orecchia P, Zardi L, Righetti PG: Blue silver: A very sensitive colloidal Coomassie G-250 staining for proteome analysis. Electrophoresis 25: 1327–1333, 2004
This article contains supplemental material online at http://jasn.asnjournals. org/lookup/suppl/doi:10.1681/ASN.2014050493/-/DCSupplemental.