This content has been downloaded from IOPscience. Please scroll down to see the full text.
Download details:
IP Address: 150.146.205.185
This content was downloaded on 16/08/2016 at 10:36
Please note that terms and conditions apply.
Radiative neutron capture as a counting technique at pulsed spallation neutron sources: a
review of current progress
View the table of contents for this issue, or go to the journal homepage for more 2016 Rep. Prog. Phys. 79 094301
(http://iopscience.iop.org/0034-4885/79/9/094301)
Reports on Progress in Physics
E M Schooneveld et al
Radiative neutron capture as a counting technique at pulsed spallation neutron sources: a review of current progress
Printed in the UK 094301 RPPHAG © 2016 IOP Publishing Ltd 2016 79
Rep. Prog. Phys.
ROP
0034-4885
10.1088/0034-4885/79/9/094301
9
Reports on Progress in Physics
E M Schooneveld1, A Pietropaolo2,3, C Andreani4, E Perelli Cippo5, N J Rhodes1, R Senesi3, M Tardocchi5 and G Gorini6
1 Science and Technology Facilities Council, Didcot, Oxfordshire, UK
2 ENEA Centro Ricerche Frascati, Via E. Fermi 45, I-00044 Frascati, Rome, Italy
3 MIFP-Mediterranean Institute of Fundamental Physics, Via Appia Nuova 31 00040 Marino, Rome, Italy 4 Department of Physics and NAST Centre, Universita’ degli Studi di Roma Tor Vergata,
Via della Ricerca Scientifica 1, 00133 Roma and CNR-IPCF sezione di Messina and Centro Fermi, Italy 5 Istituto di Fisica del Plasma ‘Piero Caldirola’, CNR, via Cozzi 53, I-20125 Milano, Italy
6 Universita Milano Bicocca, Piazza della Scienza 3, 20126 Milano, Italy
E-mail: [email protected], [email protected], [email protected],
[email protected], [email protected], [email protected], [email protected] and [email protected]
Received 13 May 2015, revised 15 April 2016 Accepted for publication 18 April 2016 Published 9 August 2016
Abstract
Neutron scattering techniques are attracting an increasing interest from scientists in various research fields, ranging from physics and chemistry to biology and archaeometry. The success of these neutron scattering applications is stimulated by the development of higher performance instrumentation. The development of new techniques and concepts, including radiative capture based neutron detection, is therefore a key issue to be addressed.
Radiative capture based neutron detectors utilize the emission of prompt gamma rays after neutron absorption in a suitable isotope and the detection of those gammas by a photon counter. They can be used as simple counters in the thermal region and (simultaneously) as energy selector and counters for neutrons in the eV energy region. Several years of extensive development have made eV neutron spectrometers operating in the so-called resonance detector spectrometer (RDS) configuration outperform their conventional counterparts. In fact, the VESUVIO spectrometer, a flagship instrument at ISIS serving a continuous user programme for eV inelastic neutron spectroscopy measurements, is operating in the RDS configuration since 2007.
In this review, we discuss the physical mechanism underlying the RDS configuration and the development of associated instrumentation. A few successful neutron scattering experiments that utilize the radiative capture counting techniques will be presented together with the potential of this technique for thermal neutron diffraction measurements. We also outline possible improvements and future perspectives for radiative capture based neutron detectors in neutron scattering application at pulsed neutron sources.
Keywords: neutron detectors, radiative capture, spallation neutron sources (Some figures may appear in colour only in the online journal)
Radiative neutron capture as a counting
technique at pulsed spallation neutron
sources: a review of current progress
Report on Progress
IOP
doi:10.1088/0034-4885/79/9/094301 Rep. Prog. Phys. 79 (2016) 094301 (23pp)
1. Introduction
Neutron-based techniques are gaining an increasing interest from a continuously growing community of scientists in dif-ferent research fields, ranging from physics and chemistry to biology and archaeometry. This mostly relies upon the unique properties of the neutron: being a neutral particle, it interacts weakly with materials and thus it is capable of probing bulky samples. Neutron scattering techniques are able to provide information on structure and dynamics of condensed mat-ter. ‘Where atoms are’ and ‘how atoms move’ was the great achievement of Shull and Brockhouse using thermal neutron scattering [1–4]. Since that period these techniques were con-tinuously refined and strengthened, extending the horizons of scientists working in different fields. The advent of spallation neutron sources [5] offered the possibility to further enhance the great potential of neutron scattering techniques: new tech-niques were born thanks to the availability of intense fluxes of neutrons above the thermal region, such as the neutron Compton scattering [6–16] or inelastic neutron-electron scat-tering [17–20].
The potential envisaged by means of theoretical specula-tions could be realized because of the continuous develop-ment of dedicated instrudevelop-mentation. In turn, the developdevelop-ment of new and high performance instrumentation opened the way to new experimental investigations that inspired theoretical approaches, in a sort of synergic loop. As a matter of fact, the neutron detection techniques are a key issue to be addressed for the improvement of instrument capabilities. In this part-icular context, the recent problem of 3He shortage stimulates
and inspires research and development activities on thermal neutron detection approaches. In the case of epithermal neu-trons, standard detectors based on 6Li or 3He nuclei have a
low detection efficiency, due to the 1/v dependence of their neutron absorption cross section, v being the neutron velocity. In this review, an overview is presented of a neutron detec-tion approach based on the (n,γ) conversion reactions for both thermal and epithermal neutron scattering at spallation neu-tron sources. The main focus will be on epithermal neuneu-trons as the detection technique based on (n,γ) reactions reached its maturity, while thermal neutron radiative capture is at its early, although promising, stage for time of flight neutron diffraction.
2. Neutron radiative capture reactions
Radiative capture relies on the absorption of a neutron by a nucleus followed by the prompt (τ 10−14 s) emission of
gamma rays. The capture reaction can be modelled as the formation and decay of a ‘compound nucleus’ following the reaction [21, 22]: → ( ) → γ + + ∗ + + + X n X X Q. A Z A 1 Z A 1 Z (1) The Q-value of the radiative capture reaction can be written, given the zero photon rest mass and indicating the neutron mass with mn, as:
+ − +
M XA m M X
Z n A 1 Z
[( ( ) ) ( )]
(2)
which is the energy needed to separate a neutron from the compound nucleus. Since neutron separation energies are always positive, radiative capture is an exoergic reaction: the threshold energy is zero, so that neutrons of any energy may trigger the reaction. Upon neutron capture, the compound nucleus is likely found at an excited level in turn decaying by the emission of one or more gamma rays to reach the ground state. Neglecting the recoil energy of the nucleus upon gamma emission, the total amount of energy produced by the radiative process is equal to the de-excitation energy. In what follows, the radiative capture reactions for thermal and epithermal neu-trons are briefly described.
2.1. Thermal neutron radiative capture
Radiative capture gamma ray spectra resulting from thermal neutron capture have been measured for many isotopes and recorded over many years [23]. The decay mode of the com-pound nucleus upon thermal neutron capture is specific to the absorbing system. In this respect, three major types of capture gamma ray spectra can be identified. The first type are spectra characterized by a few emission lines where the direct trans-ition from the absorbing level to the ground state dominates. In these cases, most of the energy is carried by a single gamma ray of energy in the order of 6–8 MeV; see for example figure 1 showing the radiative capture gamma ray spectrum for 56Fe.
The second type of spectra are featuring a resolved line struc-ture, such as that of light and medium weight elements with large spacing among single particle state levels and where the transition to intermediate levels are as likely as direct ground state transitions. The third type of spectra has many unre-solved lines. For these spectra, especially those of heavy ele-ments that have a high level density, the transition to any level can be well described by statistical approaches [21, 22]. It is found that the number of gamma rays in the neutron capture-induced spectrum depends on the number of states below the excited state of the nucleus after neutron absorption. In fact, in the case of 1H, the 2H nucleus features only two states and
the corresponding gamma spectrum is composed of only one
Figure 1. Capture gamma ray spectrum for 56Fe. The direct transition to the ground state dominates de-excitation of the nucleus, as the most intense gamma emission is at the highest gamma energy. Data taken from [23].
0.0 1.0 2.0 3.0 4.0 5.0 6.0 7.0 8.0 0 20 40 60 80 100 Intensity [% ]
line at 2.22 MeV, i.e. binding energy of one neutron in a 2H
nucleus. For a thorough and more exhaustive discussion of these issues the reader is referred to [21–23].
2.2. Resonance neutron radiative capture
For low energy neutrons, and energies below the first capture resonance, the radiative capture cross section σ( )n,γ is found to
vary as 1/v, with v being the neutron velocity. In the proxim-ity of an isolated resonance, the radiative capture cross sec-tion is well described by the Breit–Wigner line shape [24]. In medium to heavy nuclei the isolated resonances are found at low energies as indicated, for example, in figure 2 for the case of 238U and 207Ag, data from [25]. In this case, the only term
that contributes to the partial wave expansion of the interac-tion cross secinterac-tion is that with angular momentum l = 0 and the σ( )n,γ can be written as:
E J I E E 2 1 8 2 1 n, n 2 3 r 2 4 2 ( ) ( ) ( ) ( ) ( ) σ λ π = ⋅ + ⋅ + Γ Γ − + γ γ Γ (3) where I is the spin of the target nucleus, J that of the com-pound nucleus, Er the resonance energy and Γn and Γγ the
par-tial widths for neutron and gamma emission, with Γ = Γ + Γn γ
being the total width. The radiative capture width, Γγ, is
typi-cally on the order of 0.1–0.5 eV for medium mass nuclei and is somewhat smaller, around 0.1 eV or less, for large mass nuclei. Figure 3 reports the resonance cross section for two different nuclear masses, namely 240Pu and 197Au. The partial
gamma width, considering the uncertainty principle between energy and lifetime operators, determines the time scale over which the radiative transition between two levels occurs. This is found to extend between 10−13–10−15 s. These lifetimes
are, with a few exceptions, an order of magnitude smaller than other possible de-excitation channels that may occur upon
Figure 2. Radiative capture cross section of (a) 238U and (b) 207Ag in the epithermal neutron energy range below 10 eV.
slow neutron capture, such as p- or α-emission. In a very few
light elements Γp and Γα are as large as, or larger than, Γγ. This
is used for example in slow neutron detection using 3He or 6Li or 10B where secondary charged particle emission is the
dominant process (the radiative channel in n − 10B reaction
has a branching ratio of about 93%). In heavy fissile nuclei, such as 235U, the radiative channel is much less likely than the
fission and this physical characteristic might be exploited in neutron detection as well, as for example in thermal and epi-thermal neutron beam monitoring [26]. The prompt process of radiative capture, the large amount of energy emitted by the gamma rays and the line-structured emission spectra allow to conceive neutron detection approaches based on the detection of the radiative capture gamma rays. These approaches can be used in both elastic and inelastic neutron scattering applica-tions, especially at pulsed spallation neutron sources, as will be discussed in the following sections.
3. The time of flight technique at pulsed spallation neutron sources
The advent of spallation neutron sources in the 1980s [5] opened new experimental perspectives in neutron scattering experiments. Being mostly pulsed, it is possible to use the time of flight technique, henceforth named TOF, to recon-struct the kinematics of the scattering process. In what follows we mostly focus on the tests performed at the ISIS spallation neutron source (Rutherford Appleton laboratory, UK) where the counting technique based on radiative capture was exten-sively refined following the first tests performed in the 1980s. Radiative capture based neutron detectors are now used as detection system for the user program of the VESUVIO elec-tron volt neuelec-tron spectrometer [13, 27, 28]. At ISIS, an ion source produces H− ions at 17 keV energy in 200 μs long
pulses to form a beam that is then curved through a 90° mag-net. The H− ions then reach an energy of 35 keV across a DC
acceleration gap, and are focused and directed into the radio frequency quadrupole (RFQ) accelerator, operating at 665 keV and 202.5 MHz. Inside the RFQ, four specially shaped elec-trodes produce an alternating gradient quadrupole electric field for focusing and acceleration. Discrete bunches of H−
ions 4.94 ns apart are passed into the LINAC, where they are further accelerated up to 70 MeV. Before injection into the synchrotron, the electrons of the H− ions are removed by a
stripper foil. In the synchrotron, the protons are then acceler-ated up to 800 MeV and fired onto a (tantalum clad) tung-sten target, with a repetition rate of 50 Hz. The neutron pulse
produced by spallation is very short (typically few hundreds of nanoseconds) and contains predominantly high energy neutrons. A system of moderators, reflectors and coolers sur-rounds the spallation target. The purpose of the moderator is to slow down the fast neutrons to the energies required for the neutron instruments (typically between about 1 meV and 100 eV), maintaining the time correlation with the proton beam. This allows using the TOF technique for the kinematic reconstruction of the scattering process (i.e. to define energy and wave vector transfer). The total neutron TOF, t, is the time a neutron has taken to travel from the moderator to the detec-tor. It can be written as:
t L v L v 0 0 1 1 = + (4) where L0 and L1 are the (known) incident and scattering flight
paths of the instrument, while v0 and v1 are the initial and final
neutron velocities, The energy transfer is:
m v v 2 02 12 ( ) ω = − (5) and the momentum transfer:
q=m v( 02+v12−2v v0 1cosϑ)1 2/ ,
(6) where ϑ is the scattering angle. Figure 4 represents a schematic layout of a TOF instrument. The TOF technique requires the knowledge of L0, L1, the scattering angle ϑ and the
knowl-edge of either the initial or the final neutron energy (E0 or E1)
to reconstruct the kinematics of the scattering process. By knowing the initial energy, the total neutron TOF allows for the measurement of the final one, while the angular position of the detector, ϑ, makes it possible to determine the wave
vector transfer, q. Each signal is stored in a time channel of a time to digital converter (TDC), its value being the time differ-ence between the initial time of the gate tstart (approximatively
corresp onding to the instant the neutron leaves the moderator) and the detection instant (tstop).
The experimental signal recorded on a typical ISIS beam line is a TOF spectrum, representing the number of counts collected in a time channel of width δt centred in t. For exam-ple, it can be shown that the expression for the count rate per time bin [27, 29] for an inverse geometry spectrometer using a nuclear resonance to define the scattered neutron energy, can be approximated, with good degree of accuracy, by the simple relation [30, 31]:
C t( )=A E L L tN( 0, 0, 1)δ S⋅ ∆ζ E1ηd
(7)
Figure 4. Schematics of the neutron time of flight principle.
L0 L1 Moderator sample tstart tstop Detector
where NS is the number of scattering centres in the sample, ζ
the double differential scattering cross section d2d dE EE0, ,1 1
( )
σ ϑ
Ω , ∆E1
the total width of the nuclear resonance, L0, L1 the primary
and the scattering flight paths, respectively and ηd the overall detection efficiency.
The quantity A E L L( 0, 0, 1) is given by:
A E L L E A E L L m , , 4 2 2 d 0 0 1 0 0 3 2 0 3 12 ( ) φ( ) / π = (8) where φ( )E0 is the flux of the incident neutrons with energy
E0, 4ALd
1 2
π is the geometrical acceptance and m the neutron mass.
4. Theoretical overviews
4.1. Deep inelastic neutron scattering
One of the great advantages of spallation neutron sources is the availability of intense fluxes of epithermal neutrons, typi-cally ranging fom 500 meV to 100 keV. These can be used to probe the fast dynamics in molecular systems and/or quantum fluids and solids to investigate the single atom momentum dis-tributions [15]. In this section, deep inelastic neutron scatter-ing (DINS) is briefly introduced for a better understandscatter-ing of the experimental tests presented in the following. The reader is referred to [15] for a thorough discussion of the technique and detailed description of theoretical issues.
In the DINS regime, the inelastic neutron scattering cross section for unpolarized neutrons is related to the dynamic structure factor S(q,ω) via the relation [32–36]:
( ) [ ( ) ( ) ( )] σ ϑ ω ω Ω = − | | + | | − | | E E E E E b Sq b b S q d , , d d 1 , , , 2 0 1 1 1 0 2 2 2 I (9)
b and S qI( , ω) being the scattering length of the probed nucleus
and the incoherent contribution to the total dynamic structure factor, respectively. At high q values (typically above 20 A˚−1), the scattering is incoherent, meaning that it occurs from a single particle. The typical values of the energy transfer ω attainable in DINS experiments range from 1 eV to 100 eV, corresponding to a time scale of the order of 10−15–10−17 s, which is much
shorter than the characteristic times of the high energy collec-tive modes in condensed matter (typically well above τ 10−15
s). Under these kinematical conditions, the nucleus probed by the neutron recoils freely [9, 15]. Thus, DINS explores the so-called short-time self-dynamics, and the incoherent and free recoil scattering (resembling that occurring in the Compton scattering of hard x-rays off electrons) manifests in the well-known impulse approximation (IA). Within the IA, the inelastic neutron scattering cross section in equation (9) is [9, 15]:
E E E E E b S q d , , d d 1 , , 2 0 1 1 1 0 2 IA ( ) ( ) σ ϑ ω Ω = − | | (10) while the dynamic structure factor is given by [33]:
S n
M
q, p r p q d ,p
IA( ω)=
∫
( ) δ ω⎣⎢⎡ − ω − ⋅ ⎦⎥⎤(11)
n( )p being the single particle momentum distribution. Equation (11) establishes that scattering occurs between the neutron and a single particle, while also conserving kinetic energy and momentum of the particle + neutron system. The term r 2Mq
2 2
ω =
is the recoil energy, i.e. the kinetic energy the struck particle would have, providing it was stationary before the collision and absorbed all the momentum transferred by the neutron. Within the framework of the IA, ω and q are explicitly coupled through the West scaling variable y, defined as [15, 32, 34]: y M q r . 2 ( ω ω) = − (12) Equation (11) can then be reduced to the form
ω = S M q J y q q, , , IA ( ) ( ˆ) (13) where J y q( ˆ), =
∫
n( ) (p′ δ y−p′⋅qˆ)dp′ (14) is the neutron compton profile (NCP), formally defined as the Radon transform of the momentum distribution. The quantity qˆ is a unit vector, as J y q( ˆ), no longer depends on the mag-nitude of q. The function J y q y( ˆ), d is the probability for an atom to have a momentum parallel to qˆ of magnitude betweeny
and (y+dy).
For an isotropic system, the direction qˆ is immaterial and equation (14) becomes [15, 37]: J y 2 p n p d .p y ( )= π
∫
( ) | | ∞ (15) It has to be stressed that in the IA framework, J( y ) is sym-metrical and centred at y = 0 and the relation between n( p ) and J( y ) is [6, 37]: ( )= − π ⋅⎡⎣⎢ ( )⎤⎦⎥ = n p y J y y 1 2 d d y p. 3 (16) It is worthwhile mentioning that the IA is strictly valid only in the asymptotic double limit (q, ω) →∞, keeping y con-stant. For finite values of the energy and wave vector transfers, the longitudinal momentum distribution retains an additional dependence on q which is known as final state effects (FSE). A detailed description of this contribution can be found in ref-erences [35, 38, 39].4.2. Thermal neutron diffraction theory
In this brief section, the theory of diffraction measurements is discussed for time of flight measurements at pulsed spall-ation neutron sources. Neutron diffraction (ND) is a powerful technique for investigating the crystal structure of materials [40–44]. The diffraction process is described as the deflection of the incident beam by crystal planes [h k l ]. The well-known Bragg’s law: d n 2 hklsin( ) λ= ϑ (17)
links together dhkl (the spacing relative to a set of lattice
planes), the scattering angle 2ϑ and the wavelength λ of the
incident radiation. In order to obtain a full diffraction pattern from a powder sample one of the two parameters (2ϑ or λ) can
be varied leaving the other constant. Diffractometers operat-ing at a spallation source are based on the determination of neutron energy (and hence wavelength) through the TOF tech-nique; in this case Bragg’s law can be re-written in terms of TOF (thkl) as: d ht Lm 2 sin hkl hkl n ( )ϑ0 = (18) where 2ϑ0 is a (fixed) scattering angle, L is the full flight path
of the neutrons from the moderator to the detector through the scattering sample and h the Planck’s constant. The exper-imental signal from a TOF diffraction measurement is a pat-tern of Bragg peaks. Peak positions are directly related to the crystal lattice dimensions and are used to identify phases, structures and/or to infer texture, strain and grain size infor-mation through lineshape analysis [45–48].
5. Development of radiative neutron capture counting techniques
5.1. Epithermal neutrons: the resonance detector technique As far as epithermal neutron scattering is concerned, since 1986 an extensive research and development activity was car-ried out at ISIS originally on the eVS and subsequently on the VESUVIO spectrometers [9, 10, 31, 49–66]. Part of this research activity was addressed to develop and enhance the capabilities and effectiveness of the so-called resonance detec-tor spectrometer (RDS) configuration, conceived and tested in the early 1980s [67–73]. As historical examples, figures 5 and 6 show TOF spectra recorded in the RDS configuration at the Dubna (Russia) pulsed reactor IBR-30 [74] with a
Ge(Li)-149Sm analyser and the RAT spectrometer [72] at the KENS
facility (Japan) [75] with a BGO-Ta analyser, respectively. The main advantages of the RDS configuration are: (i) the counting efficiency is mostly independent of neutron energy [76], unlike techniques that use 6Li or 3He based counters
[57, 77], (ii) the count rate of the detector is much lower so that it does not saturate and (iii) hybrid data recording approaches, such as the foil cycling technique [78, 79], can be utilized to enhance the resolution and provide environmental gamma background subtraction capability.
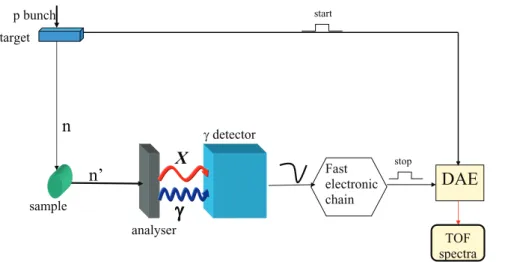
An RDS is an inverse geometry instrument where the energy of the scattered neutron is selected by means of resonance analyser and a gamma detector; see figure 7. The RDS count-ing procedure relies upon two main steps [51, 56, 61, 69, 72]: in the first step, the scattered neutron beam impinges onto the analyser foil which provides the energy analysis by means of (n,γ) resonant absorption at a given resonance energy Er. In
the second step, the prompt gamma rays are detected and pro-vide the total TOF of the absorbed neutron. It has to be empha-sized that the gamma detector is used as a counter: simply provides a trigger to the counting electronics if the signal is
above a discrimination threshold that can be set electronically. It is sufficient that one photon among the whole cascade is detected, even by a partial release of its energy in the detector.
The analyser foil has to fulfil some important require-ments: (i) the radiative capture cross section has to show iso-lated and intense resonances in the energy region of interest
Figure 5. Neutron TOF spectrum from a TiH2 sample and 149Sm analyser foil after 34 h of data collection. TMA is the TOF given in channel numbers; the channel width is 16 μs. The peak at E0 is produced by elastically scattered neutrons and hence correspond to Er=0.873 eV, whereas the peaks at E1 and E2 are due to inelastically scattered neutrons. E1 and E2 are separated from Er by 0.14 eV and 0.28 eV, respectively. The dashed line indicates the background. Reproduced from [67], Copyright 1981, with permission from Elsevier.
Figure 6. RDS spectrum of polycrystalline graphite measured with a Ta analyser foil and a BGO scintillator: (Upper spectrum) raw data including background and sample holder contribution; (lower spectrum) data after subtraction of the background and sample holder contributions. Reproduced from [72], Copyright 1984, with permission from Elsevier.
(Er=1– 100 eV), (ii) these resonances should have small
widths as compared to Er, (iii) the emitted γ-ray spectrum
should contain lines with appreciable relative intensities at high energies. The first two requirements are important in order to properly select the scattered neutron energy and to ensure a low contrib ution to the energy component of the res-olution function of the spectrometer, respectively. The third requirement allows for selecting gamma rays that provide the best signal to background (S/B) ratio, as it will become clear in the next sections.
In table 1, a number of suitable isotopes that can be used in the RDS configuration are listed together with their main physical parameters. The gamma emission lines of 197Au
and 238U, the two most widely used isotopes, are shown in
figure 8. The choice of the preferred isotope for the analyser foil depends on the neutron scattering experiment that is per-formed. The preferred isotope depends for example on the momentum transfer that is assessed, the energy resolution that is required and the data collection time that is allocated for the experiment. The width of the 238U resonances are narrower
than the 197Au resonance, giving a better energy resolution,
but this narrower width results in less neutrons being absorbed
in the analyser foil. For relatively short allocated data col-lection times, the limited counting statistics with a 238U foil
might give less accurate lineshape functions than with a 197Au
analyser foil. At ISIS 197Au analyser foils are used for the
majority of the experiments.
A further and instructive example of RDS is given in figure 9, where the DINS spectrum in the exchanged energy domain recorded with a C6D6 liquid scintillator during a
DINS measurement on liquid N2 is shown. This
measure-ment was done at the 100 MeV linac neutron source of the National Bureau of Standards (USA) [69]. Another measure-ment performed at the same facility, in the Filter Difference mode [80], was performed using a BGO and a Germanium detector to assess the effectiveness of narrow energy selec-tion windows in the gamma ray cascade spectrum from
Figure 7. Schematic drawing representing the experimental setup of a resonance detector spectrometer.
X
sample analyser detectorn’
n
DAE
target p bunch TOF spectra Fast electronic chain stop startTable 1. Main physical parameters of different nuclear resonances that can be utilized in the RDS configuration: Er is the resonance energy, σ0 the peak value of the resonance cross section and Γ0 the
half width at half maximum of the resonance.
Isotope Er (eV) σ0 (b) Γγ (meV)
113In 49 14.6 9965 67 139La 57 72.2 5969 96 150Sm 62 20.7 56 207 109 160Dy66 20.5 16 165 124 168Er 68 79.7 11 203 121 178Hf 72 72.6 16 838 112 182W74 21.1 46 800 104 190Os 76 91.0 6777 105 197Au 79 4.96 36 592 60 238U 92 6.67 23 564 25 238U92 20.8 37 966 34 238U 92 36.6 42 228 57 238U 92 66.0 20 134 48
Figure 8. Relative intensity versus γ energy for the radiative neutron capture emission of (a) 238U and (b) 197Au.
the resonance analyser in achieving an improved S/B ratio. Figure 10 shows the DINS time of flight spectra recorded by means of a BGO scintillation detector without energy selec-tion in the Au gamma ray cascade and a Germanium detec-tor with fine energy selection windows. The reader is referred to [81] for a complete description of the setup. These results show that the S/B doesn’t noticeably improve with the use of a fine gamma energy window. The width of the peak is also the same for both data sets. This conclusion can be considered to some extent introductory to the discussion presented in the following sections, where it will be shown how to achieve an
optim ized S/B in the RDS configurations, highlighting that the energy resolution of the detector is not a key parameter for this application. The following sections will also describe other details of the extensive research and development activ-ity on RDS, carried out at the ISIS spallation neutron source, that have enabled the completion of an operating inverse neu-tron spectrometer devoted to a scientific user program. 5.2. Optimising detector type and settings for the resonance detector technique
The previous section shows results with various types of detectors. For RD detectors to be used permanently on an epi-thermal neutron spectrometer, detector type, performance and cost all have to be optimised. Hence a systematic research has been done that is described below.
5.2.1. Experiments with sodium iodide scintillation detec-tors. This section is dedicated to the discussion of the first RDS test, performed on the eVS spectrometer at the ISIS spallation neutron source, with a uranium analyser on the face of a sodium-iodide [NaI(Tl)] scintillator [51]. The main characteristics of NaI(Tl) are highlighted in table 2. The NaI detector, a cylinder with an 8 cm diameter and 8 cm height, was used to detect the high energy component (in the MeV region) of the gamma ray cascade following resonance radia-tive capture in uranium; see figure 8 for the energy distribution of the gammas. This RDS test was a DINS measurement on polycrystalline Pb (100 cm2 area and 1 mm thickness) [51].
During these measurements data was also recorded with the standard equipment of eVS, which utilizes the same type of analyser foils but use neutron counters based on 6Li-glass
scintillator. This configuration, also known as resonance filter spectrometer (RFS), is extensively discussed in [80]. For the sake of brevity, we report the results of a Pb sample, referring the reader to [51] for a more detailed description of the experi-ment. Figure 11 shows the RDS and RFS TOF spectra recorded by the NaI-U and 6Li-glass-U detection systems, respectively.
The TOF is shown in a region around the recoil peak of Pb at the final neutron energy corresponding to the 6.67 eV 238U
resonance. The RDS signal is a peak originating from the detec-tion of radiative capture gamma rays by the NaI detector, while the RFS signal is present as a dip in the TOF spectrum that is produced by resonant neutron absorption in the analyser foil. The large background under the peak in the RDS signal is caused by gamma rays emitted by materials in the exper-imental area as well as the moderators, reflectors and coolers
Figure 9. The spectrum of inelastically scattered neutrons from a liquid nitrogen sample using an Au absorber with resonance at 4.9 eV. The peak at 7.8 eV arises from an uncorrected background. Reproduced figure with permission from [69]. Copyright 1982 by the American Physical Society.
Figure 10. Neutron time of flight spectrum from an aluminium sample recorded in the RDS configuration using a Bismuth germanate (BGO) gamma detector and an Au analyser foil. In the same plot is also shown the time of flight spectrum from an aluminium sample in the RDS configuration using a high-purity germanium (HPGe) gamma detector and an Au analyser foil. Data from BGO are a subtraction between analyser in and analyser out data, while HPGe data are a subtraction between analyser in and analyser out and using energy discrimination thresholds on the gamma spectrum from the Au analyser. See [81] for details.
Table 2. Main physical characteristics of NaI(Tl) scintillator. Effective atomic number 50
Density (g cm−3) 3.67 Melting point (°C) 651 Maximum emission wavelength (nm) 410 Refractive index at λmax 1.85
Light yield (photons MeV−1) 4 104
Decay time (ns) 230
surrounding the spallation target; see [52] for more details. The exper imental response function F( y ), corresp onding to the recoil peak recorded in the RDS configuration at t 320 μs
in figure 11, is plotted in figure 12. The lineshape analysis on
F( y ) using a Gaussian fitting model provided a value for the standard deviation σ(y,Pb)=35.3A˚−1 in accordance with the
expectations. This test represented a successful application of the RDS scheme for DINS and demonstrated the viability of the gamma counter approach. However, iodine has a consider-able number of resonance peaks in the neutron energy range of interest, see details in [51], also causing the detector to become radioactive during the experiments. An alternative scintillator or gamma detector is therefore required.
5.2.2. Experiments with a cadmium–zinc–telluride semiconductor detector. Cadmium–zinc-telluride (CZT) is a ternary semicon-ductor compound Cd1−xZnxTe with a blending fraction x of CdTe
in ZnTe [58, 82] ranging between 5% and 13%, corresponding to an energy band gap of 1.53 eV and 1.48 eV, respectively. The high band-gap values give rise to a low level of leakage-currents, thus allowing room temperature operation [82]. The ability to oper-ate at room temperature allows the construction of compact, low maintenance devices. Table 3 summarizes the main characteristics of one of the CZTs used for the measurements. In order to test the performance of the CZT detectors for the RDS configuration, a DINS experiment was carried out on the VESUVIO spectrometer at ISIS on a Pb sample, using a 50 μm thick 238U analyser foil.
The experiment was intended to test the RDS configuration using smaller detectors as compared to the NaI(Tl) and detecting γ
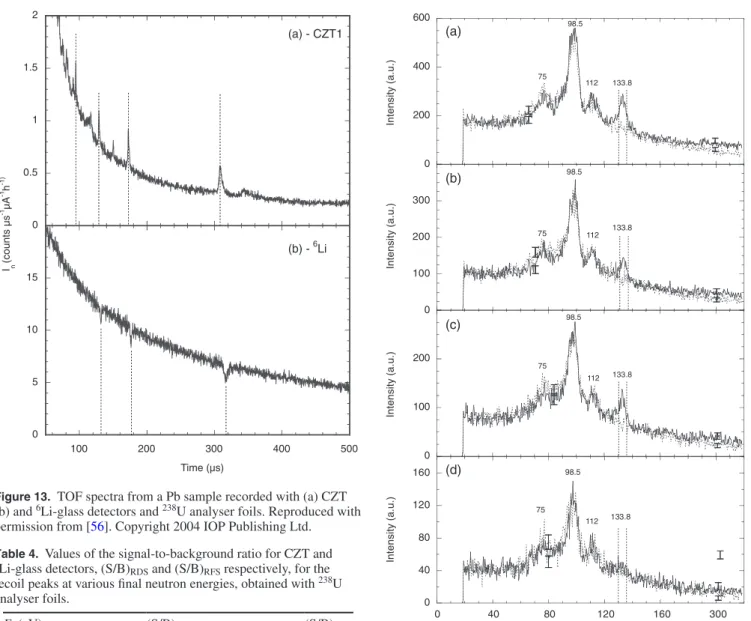
ener-gies below 250 keV. Figure 13 shows the experimental signal from a Pb sample in the TOF range 50 μs ⩽ ⩽t 500 μs recorded
with the CZT detector (figure 13(a)) in the RDS configuration and the corresp onding spectrum recorded with the 6Li-glass neutron
counters placed at a similar scattering angle (figure 13(b)) using the RFS configuration. The S/B ratio is clearly better for the CZT detector with respect to the 6Li-glass scintillator detector. This is
highlighted in table 4 where the S/B is reported for both 6Li-glass
and CZT detectors at different resonance energies.
A biparametric (TOF versus gamma ray energy) recording system was setup in order to characterise the response of the CZT to the prompt photon emission from both 197Au and 238U
analysers. This information can be used to optimize gamma energy regions of interest and hence potentially improve S/B. The analyser foils were placed in the beam to reduce record-ing time. The reader is referred to [56, 58] for a more detailed discussion of the setup. Figure 14 shows the projection of the biparametric data onto the gamma energy axis for two TOF windows, one on-resonance and the other off-resonance, for the first four uranium resonances. The peak at a gamma energy of 133.8 keV is clearly due to resonant neutron cap-ture, so a gamma energy region around this peak will probably
Figure 11. Neutron TOF spectra from a Pb sample recorded using a 30 μm thick uranium foil. The NaI spectrum (top) has a peak corresponding to the Pb recoil peak at a final neutron energy of 6.67 eV. The same resonance gives rise to the absorption dip in the 6Li-glass spectrum (bottom). Reproduced from [51]. Copyright 2002, with permission from Elsevier.
300 305 310 315 320 325 330 1.4x10⁴ 1.5x10⁴ 1.6x10⁴ 1.7x10⁴ 1.8x10⁴ 1.9x10⁴ 2.0x10⁴ 5000 5500 6000 6500 7000 7500 Counts/ µµµµ s Time (µµµµs) Counts/ µµµµ s
Figure 12. Experimental response function F( y ) from the NaI scintillator for a 30 μm uranium foil and a final neutron energy of 6.67 eV. Continuous line is the Voigtian fit. Reproduced from [51]. Copyright 2002, with permission from Elsevier.
Table 3. Main physical characteristics of the CZT detector used for DINS experiment on Pb.
Effective atomic number ≃50
EI (eV) ≃4.7
Size (mm3) 5× ×5 2
Efficiency at 100 keV 86.5 %
Rise time (ns) 200
decay time (μs) 200
Energy resolution (FWHM) at 122 keV (keV) 6
provide the best S/B ratio. Using a gamma energy region of 130.5–135.7 keV, figure 15 shows the projection of the bipara-metric data onto the TOF axis as dashed line. The continuous line is the TOF spectrum obtained without gamma energy dis-crimination. The S/B ratio is indeed better if gamma energy selection is used, but the improvement is surprisingly small and the reduction in signal intensity is very substantial. This is in agreement with the data shown in figure 10, confirming that gamma energy selection is not a viable option and a detector with a good gamma energy resolution is not required.
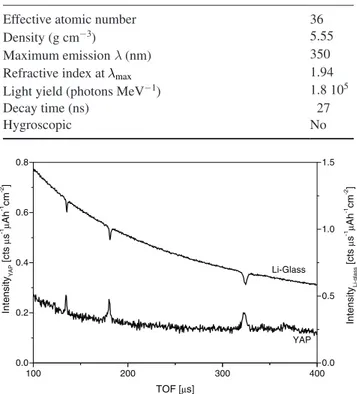
5.2.3. Experiments with yttrium–aluminium–perovskite scin-tillators. RDS does not require the use of gamma detectors with a good energy resolution. Scintillator detectors are there-fore attractive because of their high density and relatively low
cost per unit area. The detectors are used as counters and do not require a significant amount of gamma to be absorbed by the photoelectric effect, allowing the use of scintillators with a relatively low atomic number (Z). YAP(Ce) is therefore an attractive scintillator material because it has no neutron absorption resonances in the energy range of interest for RDS and has favourable scintillation properties. Table 5 lists the main characteristics of YAP(Ce) scintillator. Figure 16 shows
Figure 13. TOF spectra from a Pb sample recorded with (a) CZT (b) and 6Li-glass detectors and 238U analyser foils. Reproduced with permission from [56]. Copyright 2004 IOP Publishing Ltd.
0 0.5 Time (µs) 1 1.5 0 5 10 15 100 200 300 400 500 In (c ou nt s µs -1 µA -1 h -1 ) (a) - CZT1 2 (b) - Li6
Table 4. Values of the signal-to-background ratio for CZT and 6Li-glass detectors, (S/B)
RDS and (S/B)RFS respectively, for the recoil peaks at various final neutron energies, obtained with 238U analyser foils. Er (eV) (S/B)RDS (S/B)RFS 6.67 0.44 0.14 20.8 0.38 0.10 36.6 0.13 0.06 66.0 0.14 —
Note: In the case of the highest-energy resonance the 6Li-glass (RFS)
data were of insufficient statistical quality to allow for a meaningful determination of the S/B. Data from [56].
Figure 14. Projection of 238U reduced biparametric data on the energy axis for specified time intervals. The result is the γ energy spectrum from neutron capture on 238U. In each panel a pair of spectra is shown corresponding to a narrow time window around the neutron resonance (continuous line) and an off-resonance background region (dashed line). The chosen time intervals are: (a) 306.5⩽ ⩽t 312.5μs (resonance) and 198.5⩽ ⩽t 298.5μs (off-resonance); (b) 173.5⩽ ⩽t 176.5μs (resonance) and
⩽ ⩽t
138.5 168.5μs (off-resonance); (c) 130.5⩽ ⩽t 134.5μs (resonance) and 108.5⩽ ⩽t 128.5μs (off-resonance); (d) 97.5⩽ ⩽t 100.5μs (resonance) and 90.5⩽ ⩽t 96.5μs (off-resonance). The two vertical lines select a 5 keV energy window around the γ-ray peak at 133.8 keV. The statistical error bars are shown for illustrative purpose at the energy values of about 80 and 200 keV. Reproduced from [58]. Copyright 2004 with permission from Elsevier.
ARTICLE IN PRESS 0 100 200 300 300 (b) 133.8 112 75 98.5 0 200 400 600 In te ns ity (a .u .) In te ns ity (a .u .) In te ns ity (a .u .) In te ns ity (a .u .) (a) 133.8 112 75 98.5 0 40 0 40 80 80 120 120 160 160 133.8 Energy (keV) (d) 112 75 98.5 0 100 200 133.8 (c) 112 75 98.5
a comparison of the DINS spectra from a Pb sample recorded with a 6Li-glass detector and a YAP detector with a gamma
discrimination threshold of 40 keV. Both detectors were placed at the same scattering angle and use 238U analyser foils. The
YAP detector is clearly superior as far as the S/B ratio is con-cerned. To further optimise the S/B ratio of the YAP detection system, a biparametric acquisition system was setup during DINS experiment on a Pb sample, as thoroughly discussed in [77, 83]. These measurements, performed in a realistic setup for the RDS configuration, allowed to determine the best oper-ating conditions for DINS measurements on VESUVIO. A
thorough characterization of the background radiation present at the spectrometer [52, 84] was undertaken to facilitate the analysis of the bi-parametric data. It was found that using a discrimination threshold above circa 600 keV, it was possible to maximise the S/B and count rate. This can be explained by the suppression of the 480 keV gammas coming from neutron capture on boron that is used as absorbing mat erial in the walls surrounding the spectrometer as well as in the beam dump (see [52, 84]).
As an example of the impressive improvement of the S/B, figures 17 and 18 show the DINS TOF spectra from a Pb sample and 238U analyser foils recorded with a Lower Level
threshold Discrimination (LLD) of 40 keV and 600 keV, respectively. It can be observed that for the peak at 310 μs (Pb
recoil peak corresponding to E1 = 6.671 eV) the background
is 20 times lower and the peak intensity 2.5 times lower in figure 18 than in figure 17.
A more detailed comparison of the YAP and 6Li-glass
scin-tillation detectors is shown in table 6, where the S/B ratio val-ues for the YAP and 6Li-glass detectors are shown for several
recoil peaks in the spectra. For all recoil peaks in the spectrum the S/B ratio is better for YAP than for 6Li-glass.
Figure 15. Neutron time-of-flight spectra obtained by projecting the biparametric 238U data onto the time axis for a 130.5–135.7 keV gamma energy region (dashed line) and without any energy selection (continuous line). The spectra have been normalised so that the intensity of the lowest neutron energy resonance is equal to 1. The S/B ratio is much better than in figure 13 since the analyser foil is in the beam. Reproduced with permission from [56]. Copyright 2004 IOP Publishing Ltd.
100 1000 104
Energy selection (130.5-135.7 keV) No energy selection 50 100 150 200 250 300 350 400 I( a.u. ) Time ( s)
Table 5. Main physical characteristics of YAP(Ce) scintillator.
Effective atomic number 36
Density (g cm−3) 5.55
Maximum emission λ (nm) 350
Refractive index at λmax 1.94
Light yield (photons MeV−1) 1.8 105
Decay time (ns) 27
Hygroscopic No
Figure 16. DINS spectra from a Pb sample and 238U analyser foils recorded with a 6Li-glass and YAP detectors placed at the same scattering angle. 0.0 0.2 0.4 0.6 0.8 100 200 300 4000.0 0.5 1.0 1.5 Intensit yLi-glass [cts µs -1 µAh -1 cm -2 ] Intensit yYAP [cts µs -1µAh -1cm -2] Li-Glass YAP TOF [µs]
Figure 17. DINS spectrum from a Pb sample and 238U analyser foils recorded with YAP, utilizing a 40 keV LLD.
Figure 18. DINS spectrum from a Pb sample and 238U analyser foils recorded with a YAP detector utilizing a 600 keV LLD. The peak at about 350 μs is the Al recoil peak, due to the Al that is present in the sample holder.
50 100 150 200 250 300 350 400 0.0 2.0x10⁻⁴ 4.0x10⁻⁴ 6.0x10⁻⁴ 8.0x10⁻⁴ 1.0x10⁻³ 1.2x10⁻³ Intensity [cts / µ s] TOF [µs]
5.3. Thermal neutron detection
Thermal neutron detection systems based on radiative cap-ture have been proposed so far, especially for homeland secu-rity applications. In this specific context, the use of detection systems relying on the coupling of a neutron absorber such as (mostly) cadmium or gadolinium to a scintillation detec-tor has been investigated. The reader is referred to [85–87] and references therein for a more in depth discussion of this specific topic. The merits of radiative capture based detec-tors have not yet been fully explored for application in ther-mal neutron detection at neutron scattering facilities, such as for use in diffractometers. YAP scintillators combined with Cd converter foils are able to successfully record dif-fraction data, such as shown by the calibration procedure of the Vesuvio spectrometer. First exploratory tests of the performance of radiative capture based detectors for neu-tron diffraction have been performed. One of these tests is discussed in more detail in section 6.3. These tests give promising results in the sense that the crystal parameters can be determined with the same accuracy and similar count-ing efficiency as standard 3He gas tubes, but the observed
background under the diffraction peaks is much larger at the moment. A dedicated thermal neutron detector will probably outperform a radiative capture based detector for thermal neutron diffraction measurements in the foreseeable future. However, if epithermal neutron scattering and ther-mal neutron scattering measurements will be performed with the same detector at the same time, radiative capture based detectors are very good candidate detectors.
6. Neutron scattering experiments that utilize radiative capture counting techniques
Neutron scattering experiments have been carried out to ver-ify the performance of radiative capture based detectors for inelastic neutron scattering and thermal neutron diffraction. The reliability of these devices for the RDS configuration is demonstrated in two different inelastic neutron scattering measurements that have been performed on a H2O
molecu-lar system: (1) a DINS experiment on VESUVIO on liquid bulk water below the critical point, (2) a HINS measurement on the very low angle detector (VLAD) prototype on Ice-Ih
at T = 270 K. Neutron diffraction measurements on metal-lic samples, performed at the INES diffractometer [88, 89] at ISIS, are also briefly discussed.
6.1. DINS measurements on liquid H2O
DINS measurements on a liquid H2O sample at two different
thermodynamic (P, T ) conditions, namely (1 bar, 293 K) and (100 bar, 423 K), have been performed on VESUVIO, using a single YAP detector coupled to a uranium analyser. For the sake of brevity, we report the results of the experiment on (1 bar, 293 K) sample in Al and TiZr sample holders, refer-ring the reader to [90] for a complete and thorough discus-sion. Figure 19 shows the TOF spectrum from H2O in an Al
sample holder after subtraction of the gamma background and correction of the signals from oxygen and aluminium (sample holder). By means of a standard procedure, detailed in [90], the hydrogen peaks in the TOF domain are mapped into the
y-West scaling variable space to perform the full lineshape analysis that provides the measurement of the mean kinetic energy. Figure 20 shows four experimental response functions measured at two final neutron energies (20.8 and 36.6 eV) from water in an Al and a TiZr sample holder.
A comparison was made between the results obtained with YAP-U detection system in RDS configuration and those obtained in the RFS configuration of VESUVIO relying on 6Li-glass
scintillation detectors. Table 7 reports the results obtained from a data analysis using different models for J( y ), namely simple Gaussian, spherically averaged multivariate Gaussian and Gauss-Hermite expanded [91, 92]. These results show that the data of the RDS and RFS configurations are in good agreement.
All information gained with the series of tests discussed in the previous sections and the successful measurements on water, widely and extensively studied with neutron scattering, assessed that the RDS configuration is effective for DINS, achieving better performances as compared to the RFS setup. Moreover, the foil cycling technique (FCT) discussed in sec-tion 7.1 has shown the ability to enhance the overall resolution
Figure 19. Time of flight spectrum from H2O at room temperature and pressure in an Al container, corrected for background and contributions from the Al container, using 238U analyser foils. Reproduced with permission from [90]. Copyright 2006 IOP Publishing Ltd.
Table 6. List of the signal-to-background (S/B) ratios for the YAP and 6Li-glass detectors with 238U analyser foils.
TP (μs) Er (eV) S/B YAPL S/B YAPH S/B 6Li-glass
310 6.67 0.60 4.00 0.12 180 20.8 0.40 6.25 0.09 135 36.6 0.15 4.00 0.007 90 66.0 0.13 2.72 70 80.3 0.09 1.24 55 102 0.07 0.71
Note: The first column indicate the TOF positions of the Pb recoil peaks considered, the second column is the corresponding final neutron energy (resonance energy), the third and fourth columns are the observed S/B value for YAP with LLD = 40 and 600 keV, respectively. The last column is the observed S/B ratio for the 6Li-glass detector.
of the spectrometer and provide a good subtraction of the gamma background, allowing a more reliable lineshape anal-ysis of the recoil peaks. Since 2007 the VESUVIO spectro-meter is operating in the RDS configuration using the FCT for the user research program on the beam line [27].
6.2. High-energy inelastic neutron scattering on Ice-Ih
The unique range of exchanged wavevectors, q, and energy transfers, ω, that can be accessed by epithermal neutron scattering experiments makes them an attractive tool for the invest igation of condensed matter. The success of DINS experiments provides motivation to extend the application of epithermal neutron scattering. Especially attractive is the extension of the kinematical region of low (1–10 A˚−1) wave-vector transfers, coupled to high energy transfers (typically
0.1–10 eV) defined as high-energy inelastic neutron scatter-ing (HINS) regime [61, 93]. The scattering processes in the HINS region are still largely unexplored but would allow exper imental invest igations such as dispersion relations of high energy excitations in magnetic materials, semiconduc-tors, high lying molecular rotational vibrational states, molec-ular electronic excitations, and electronic levels in solids [17, 94–96].
Figure 20. Proton experimental response functions, F( y ), and results from the fits obtained using an isotropic Gaussian model for J( y ), of H2O sample at (p = 1 bar, T = 293 K) in (top left) Al container (E1 = 20.8 eV), (top right) Al container (E1 = 36.6 eV), (bottom left) TiZr container (E1 = 20.8 eV), (bottom right) TiZr container (E1 = 36.6 eV). Reproduced with permission from [90]. Copyright 2006 IOP Publishing Ltd.
Table 7. Values of the proton’s means kinetic energy measured in the RDS and RFS configurations for an H2O sample at room temperature and pressure.
Model J( y ) EKRDS (meV) EKRFS (meV)
Gauss 122±10 124±3
Spherical average 144±15 147±8
Gauss-Hermite 149±12 144±3
Note: See [90] for details.
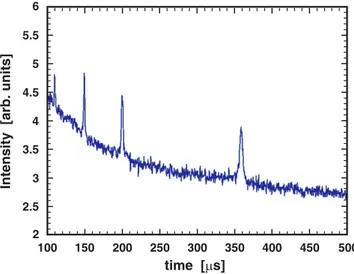
Figure 21. TOF spectra from Ice-Ih, obtained with the VLAD bank and YAP detectors placed at 5° with 238U analyser foils.
2 100 150 200 250 300 time [ s] 350 400 450 500 2.5 3 3.5 4 4.5 5 ]s ti n u . br a[ yti s ne t nI 6 5.5
In order to develop HINS at spallation neutron sources, a prototype of a low angle eV RDS-based spectrometer was conceived and realized for the VESUVIO spectrometer. The device, called the very low angle detector bank (VLAD), is thoroughly described in [97].
Beyond the scientific interest, HINS measurements on polycrystalline Ice-Ih in the region of the O-H stretching mode provide a very good benchmark for demonstrating the reliability of the RDS detection system in accessing lower q values. The O-H stretching mode density of states in poly-crystalline Ice-Ih was already been measured, through ine-lastic neutron scattering [98] on the direct geometry high resolution medium energy chopper spectrometer (HRMECS) at the Argonne National Laboratory, while other authors measured S q( ,ω) and g( )ω of Ice-Ih at different thermody-namical conditions [99, 100]. The measurements described in [98] have been regarded as the reference term for tests of the RDS detection system. Results, obtained with the VLAD bank and the YAP-U detection system are pre-sented here while a detailed description of the data analysis can be found in a dedicated experimental paper [101]. In figure 21 the TOF spectra from Ice-Ih in an aluminium sample container, for a detector with an angular position of 5° using a
238U analyser foil, is shown as example. Subtracting the empty
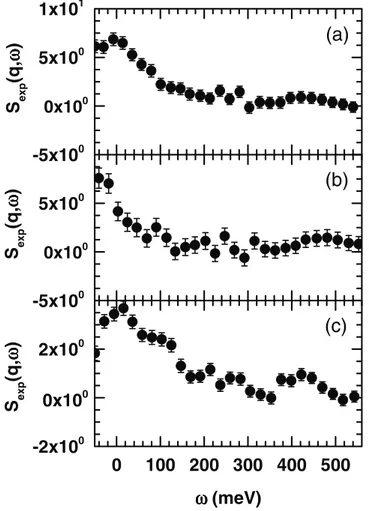
can spectra from the ones shown in figure 21 and correcting for the residual sample dependent background, the resulting signal spectra at three scattering angles were transformed to obtain the absolute scattering function S q( ,ω) with q varying in the range 2.5–5.5 A˚−1. This is shown in figure 22 where the peak due to O-H stretching is visible on the right-hand side of the main scattering peak (elastic peak at ω =0). Following [98], S q( ,ω) was further analysed, bearing in mind that in polycrystalline samples it is related to the density of states g( )ω through its q→0 limit by:
( ) ( ) ( ) → ⎡ ⎣⎢ ⎤ ⎦⎥ ω ω ω π σ ω = + g S q q m n lim , 2 4 1 1 q 0 2 H inc (19) where n( )ω is the Bose population factor (≈1 for T = 270 K) and σinc is the incoherent scattering cross section of hydrogen.
With the q values sufficiently close to zero, the shape of the g( )ω in the O-H stretching energy region, i.e. 350 meV ⩽ ⩽ω 450 meV, was derived according to equation (19). The result-ing g( )ω values are shown in figure 23. The integral in the stretching region under the g( )ω curve is:
( ) /
∫
gω ω = ±d 9 2 atoms cell.350 450
(20)
Figure 22. S q( ,ω) from Ice-Ih, obtained by transforming the TOF spectra at angles of: (a) 2.0° (b) 3.5° and (c) 5.0°. The O-H stretching band is located at approximately 425 meV. Reproduced with permission from [61]. Copyright 2004 IOP Publishing Ltd.
0
100 200 300 400 500
-2x10
00
2x10
0-5x10
00
5x10
0-5x10
00
5x10
01x10
1S
exp(q
,ωωωω
)
ω
ω
ω
ω (meV)
S
exp(q
,ωωωω
)
(c)
(b)
(a)
0x10
00x10
00x10
0S
exp(q
,ωωωω
)
Figure 23. The O-H stretching mode energy density of states in the range 300–550 meV. The peak is centred around circa 425 meV. The dashed line is the g( )ω obtained by deconvoluting a Gaussian resolution function with 70 meV FWHM from the best fit (full line). Reproduced with permission from [61]. Copyright 2004 IOP Publishing Ltd.
Figure 24. The energy density of states of the O-H stretching mode in polycrystalline Ice-Ih from inelastic neutron scattering measurements on HRMECS at the Argonne National Laboratory. Reproduced with permission from [98]. Copyright 1985 IOP Publishing Ltd.
This result is in good agreement with previous measurements on the same system described in [98]. The peak position (≈425 meV) is also well reproduced within the exper imental error. The latter is due to both statistical uncertainties and to the instrumental resolution (mostly the energy comp-onent), which contributes to a large extent to the width of the g( )ω curve. The effect of the instrumental resolution can be accounted for by deconvoluting its contribution (full width at half maximum ≈70 meV) from a Gaussian fit to the data (full line in figure 23). The width of the resulting Gaussian function (dashed) is in good agreement with earlier measure-ments [98]. It should be noted that direct geometry (chopper) instruments have an energy resolution which is intrinsically better than inverse geometry instruments. However they are kinematically limited in energy loss to a maximum of about 1 eV, whereas inverse geometry instruments are kinematically unlimited. For a quantitative comparison, the g( )ω obtained by Andreani et al in [98] is shown in figure 24. In that case the g( )ω is centred around ≈417 meV, while the value of the
int egral in equation (20) is 8.1 atoms/cell, which is in good agreement with the result of the HINS experiment on VLAD. It has to be stressed that the HRMECS measurements accessed a lowest q value of about 3–4 A˚−1, while on VLAD the lowest value of q is about 2 A˚−1, thanks to the higher final (and thus initial) neutron energies accessed.
6.3. Use of thermal neutron radiative capture at spallation source instruments
Thermal neutron radiative capture can be used for detection purposes on eV instruments like VESUVIO or calibration pur-poses. In fact, in order to reconstruct the kinematics in DINS and HINS measurements, the angular position of the detector must be determined. Adding a Cd analyser beyond or after the resonance analyser allows one to record for example the dif-fraction pattern from sample container or sample (in case this is crystalline). This approach is well described in [90].
Beyond calibration purposes, thermal neutron radiative capture can in principle be used for a complete neutron dif-fraction experiment. The experimental setup to assess the performance of radiative capture detector for thermal neutron diffraction is schematically shown in figure 25. The radia-tive capture detector under investigation was made of a Cd sheet coupled to a YAP scintillator. The scintillator in turn was connected to a photomultiplier, using a lower level dis-crimination threshold (LLD) at a photon energy of 600 keV in order to optimize S/B. The Cd sheet acts as a (n,γ) con-verter following the nuclear reaction 113Cd ,(n γ)114Cd+7.6
MeV. The converter sheet was 1 mm thick, 10 cm long and 2 cm wide, the surface area being such to match that of the 3He
tubes used on INES. Diffraction patterns, recorded by the YAP and 3He detectors, from an ancient Japanese blade with a high
carbon content are reported in figure 26. This data, collected for an integrated proton current of 3350 μAh, shows Ferrite
and cementite diffraction peaks.
A further analysis was carried out on the diffraction pattern registered with both the 3He and YAP-Cd counters to extract
information on phase composition and lattice parameters of the sample. This analysis allows assessing the effectiveness of the YAP-Cd counting device using a direct comparison with a standard detection system. Figure 27 shows experimental data, Rietveld refinement based fit of the peaks and residuals for both 3He and YAP-Cd counters. The weight fraction (wt%) of
the cementite and ferrite phases determined with the 3He and
YAP-Cd counters are compatible within the exper imental uncer-tainties. Further details about this analysis can be found in [102].
7. Brief overview of the main issues of RDS
Most of the previously discussed experiments and results have been obtained with single detectors in proof of principle exper-iments. For resonance radiative capture detectors to be compet-itive in instruments that operate continuous user-programmes, a couple of issues have to be addressed: energy resolution improvement and gamma background reduction. Indeed, an epithermal neutron spectrometer utilizing neutron detectors
Figure 25. Schematic layout of the INES powder diffractometer at ISIS during the diffraction experiment. The instrument was equipped with a YAP-Cd detector for non-standard diffraction measurements. transmitted neutrons sample 3He tube incident neutrons transmission monitor scattered neutrons Cd sheet YAP
Figure 26. Time of flight diffraction patterns recorded by the YAP-Cd and 3He tube placed at a similar scattering angle in the full thermal neutron energy region. See [102] for more details.
provides a slightly better resolution than that achievable with a resonant detector spectrometer (RDS) operating in the setup shown in figure 7. As far as gamma background is concerned,
section 5 has highlighted that this is a very important issue to be addressed. Both the energy resolution and gamma background drawbacks of RDS can be effectively solved by using the foil
Figure 27. Rietveld analysis of the ancient Japanese blade diffraction pattern recorded by the 3He detector (a) placed at 2ϑ =90.565
and YAP-Cd at 2ϑ =90 . In the picture are shown the experimental data points (crosses), the Rietveld refinement fit (continuous line),
the reconstructed positions of the Bragg reflections (bars) and the residuals of the fit (lowest continuous line). Reproduced from [102]. Copyright 2011 with permission from Elsevier.
D - spacing. Å 0.8 1.0 1.2 1.4 1.6 1.8 2.0 2.2 -0.2 0.0 0.2 0.4 0.6 Counts/musec. X10E -1
(a)
D - spacing. Å 0.8 1.0 1.2 1.4 1.6 1.8 2.0 2.2 0.0 0.1 0.2 0.3 Counts/musec. X10E -1(b)
Figure 28. Schematic representation of the setup used in the foil cycling technique.
“Foil out”
“Foil in”
sample
analyser
detector
foil
cycling
foil
cycling technique, as described in the following. Crosstalk, likely to be present in a neutron scattering instrument equipped with an array of gamma detectors, will also be discussed. 7.1. Foil cycling technique
A novel signal recording technique named foil cycling technique (FCT) [78, 79] provides the possibility to enhance the overall resolution of the spectrometer and obtain a good subtraction of the gamma background. This allows a more reliable lineshape analysis of the recoil peaks. FCT introduces an additional foil, between the sample and detector, that can be cycled in and out of the flight path of the neutrons, see figure 28. The final signal is obtained by subtracting the signal recorded in the ‘foil in’ posi-tion from the signal recorded in the ‘foil out’ position. A more comprehensive description of the technique is given in [78].
The background arising from environmental gammas is a major issue for RDS signals, as will be obvious from fig-ure 29 and the figures in section 5. Most of this background is slowly varying as a function of TOF and might be removed to some extend by fitting a background function; see for example [90]. The background will be much harder to fit if the sam-ple is contaminated with impurities that have resonance peaks in the TOF region of interest. For radiative capture detectors to be used in routine operation, a simple and reliable back-ground subtraction algorithm is required. For that reason FCT was introduced. As an example of the background subtraction offered by FCT, figure 29 shows TOF spectra recorded with a ZrH2 calibration sample using a gold analyser. The plots on
the left show the DINS signals recorded in the ‘foil out’ and ‘foil in’ situations. The recoil peaks from Zr and H occur at a TOF of 374 μs and 262 μs, respectively. The peaks at other
TOFs are caused by hafnium contaminations in the ZrH2
sam-ple. The plot on the right of figure 29 shows the signal after taking the difference of the ‘foil out’ and ‘foil in’ signals. The large background as well as the peaks arising from the contam-inations have been almost completely removed. These peaks, due to resonance neutron absorption in the sample itself, are not affected by the presence of the fixed and cycling analyser
foil. Indeed the shielding effect due to Au foil thickness (about 20 μm) is almost negligible, so that in the subtraction
proce-dure these spurious peaks are almost completely cancelled. On the other hand, a small residual is sometimes visible in the sig-nal for very intense background peaks, such as the resonance peak at 285 μs. Hence a small TOF region might have to be
excluded from the analysis, but still FCT allows a much more reliable lineshape analysis than background fitting procedures.
The overall resolution is one of the key parameters of a spectrometer. The resolution is in first instance dependent on the width and shape of the resonance peak of the analyser, see table 1. Notwithstanding, techniques can be used to enhance the resolution function, such as the double difference method (DDM), see [30, 31, 54]. FCT provides a similar improvement in resolution as DDM, as it effectively squares the transfer func-tion T(E); where T E( )= −1 exp[−N E dσ( ) ] with N being the number density of nuclei in the analyser, σ( )E the radiative cap-ture cross section and d the thickness of analyser. A thorough description of the transfer function with FCT, and a comparison
Figure 29. DINS signals from a ZrH2 sample with an Au analyser for the ‘foil out’ and ‘foil in’ situations are shown on the left. The plot on the right shows the difference signal (‘foil out’–‘foil in’), illustrating the effective background subtraction obtained with FCT.
100 200 300 400 500 1.0x10⁴ 1.5x10⁴ 2.0x10⁴ 2.5x10⁴ 3.0x10⁴ 100 200 300 400 500 -1.0x10³ 0.0 1.0x10³ 2.0x10³ 3.0x10³ 4.0x10³ 5.0x10³ Count s Time of flight [µs] Foil out Foil in Count s Time of flight [µs] Difference
Figure 30. Transfer functions for a single Au analyser foil (continuous line) and for the foil cycling technique (dashed line). The dotted line represents the contribution of ‘foil in’. See [79] for details. 4.0 4.5 5.0 5.5 6.0 0.0 0.1 0.2 0.3 0.4 0.5 0.6 0.7 Probabil ity Energy (eV)