Projection Based Segmentation of Musical Sheets
S. Marinai
P. Nesi
DSI, Universit`a di Firenze. Via S. Marta, 3 - 50139 Firenze (Italy)
e-mail: [email protected], [email protected]
Abstract
The automatic recognition of music scores is a key pro-cess for the electronic treatment of music information. In this paper, we present the segmentation module of an OMR system. The proposed approach is based on the use of pro-jection profiles for the location of elementary symbols that constitute the music notation. An extensive experimentation was made with the help of a tool developed to this purpose. Reported results shown a high efficiency in the correct lo-cation of elementary symbols.
1
Introduction
Systems for music score recognition are traditionally called OMR (Optical Music Recognition); this term is tightly linked to OCR (Optical Character Recognition) that defines systems for automatic reading of textual documents. Strictly speaking, OCR refers to approaches based on the segmentation and recognition of single characters. How-ever, music notation has a two dimensional structure since in a staff the horizontal position denotes different execu-tion time for notes, whereas the vertical posiexecu-tion denotes the height of the note [1].
In papers concerning OMR (a complete survey from 1960s to 1990 is [2]), the definition of basic symbols is tightly related to the methods considered for symbol ex-traction and recognition. Basically, there are two main ap-proaches. We can consider the symbols to be recognized as (i) the connected components remaining after staff lines re-moval (chord, beam with notes, etc.), or (ii) the elementary symbols such as note heads, that can be composed to build music symbols [3]. With the first approach the symbols can be easier segmented, however, the number of different symbols is very high. A complete analysis of music sym-bols and related semantic has been conducted in MOODS project [4].
A problem addressed in music score segmentation is the presence of staff lines that touch the elementary symbols. The removal of overlapping lines requires a complex
pro-cess of reconstruction of touched symbols (e.g., [3]), with corresponding loss of information. As a consequence some authors preferred to recognize symbols without removing the portion of lines crossing them. For these purposes, the use of projection profiles is very common. The segmenta-tion method described in this paper is based on an extensive use of projection profiles, for locating elementary symbols without removing staff lines.
2. System Overview
The work reported in this paper is part of O3
MR project (Object Oriented Optical Music Recognition), that is an OMR system directly connected to the music editor of project MOODS (Music Object Oriented Distributed Sys-tem), an ESPRIT IV HPCN project [4]. The general archi-tecture of O3
MR is based on four main components : Segmentation – the music sheet is processed with the aim of extracting the basic symbols and their positions.
Basic Symbol Recognition – this module is based on a neu-ral network which takes in input the normalized image seg-ments of the basic symbols.
Music Notation Symbol Recognition – in this module the recognized basic symbols are mapped into the elementary components of music notation symbols.
Music Notation Model Refinement – once the elementary notation symbols are identified they are composed on the basis of a set of Music Notation Rules.
In this paper, only the module addressing the problems of segmentation is discussed.
3. Hierarchical Segmentation
The projection profiles are widely used for the segmen-tation of textual documents and musical scores. In particu-lar, the X-Y tree [5], [6] is a typical method using projection profiles in document analysis. An input image is recursively split into successively smaller blocks by alternating cuts in horizontal and vertical directions. Cuts are found by analyz-ing the thresholded projection profile. In the field of OMR
Figure 1. Level 0: a) the projection profile; b) low-pass filter; c) cut tolerance and merging.
the projection profiles are used for both segmentation and recognition of music symbols.
In our approach, the staff lines do not need to be re-moved. Due to the presence of staff lines and beams the segmentation of symbols cannot be based only on a thresh-olded projection profile. The staff lines give a constant background to the profile, but beams and other symbols give rise to more complex profiles. In order to allow the correct location of cutting points, the projection profile is consid-ered as a 1-D signal and processed by appropriate filters in order to remove the background due to staff lines and beams.
The segmentation approach defined is based on the alter-nate application of the same technique alongXandY axes.
This results in a hierarchical decomposition of the image. At level 0, the music sheet is segmented for extracting the single music lines (staffs) by using a profile alongY axis.
At level 1, each music staff is segmented in order to extract the main vertical image sections including the music sym-bols and their related components. In this case, we use an
X projection profile. At level 2, the image segments are
furtherly segmented in order to extract the basic graphical components of the music symbols. This last segmentation is performed alongY axis and results to be quite easy since
the image segments produced by level 1 do not present rel-evant changes alongY axis. The image segments, which
are sent to the second block of the O3
MR architecture, are extracted from level 1 (when the image segment cannot be furtherly decomposed) and level 2.
3.1. Segmentation: Level 0
The projection along Y axis presents several evident
peaks corresponding to the staffs. Typically, five peaks are observed for the presence of staff with five lines. However, when noise is present, or the image is rotated, the peaks related to staff lines are smeared. By thresholding the pro-jection profile, the single pentagrams can be detected and extracted.
Figure 2. Cut Tolerance.
In several cases, there are many symbols above or be-low the staff that belong to it. For example, words of songs, wedges, long slurs. If a low value of threshold is used, the presence of these components makes the separation of staffs very hard. On the other hand, if a relatively high threshold value is used, they are cut out of the staff subimage (Fig-ure 1a). In order to avoid this problem, a cut tolerance (that expands the cut region by a fixed amount) has been intro-duced. This mechanism, is also adopted in other levels to make the segmentation more robust (Figure 2). When the music sheet results to be very dense along theY axis,
suc-cessive image segments including staffs may be partially overlapped. In this case we adopted a merge approach that considers that two consecutive segments which are partially overlapped for the presence of a cut tolerance can be merged together when they are overlapped for more than a fixed value: the merging value (Figure 1c). This approach has to be carefully used since it can bring to merge all segments together making the segmentation phase unuseful.
Peaks followed by very deep holes along the profiles can generate incorrect segmentations if a simple thresholding approach is used. In general, filtering the projection profile with a low-pass filter can solve this problem (Figure 1b). For the projection profile smoothing, classical low-pass fil-ters can be applied such as the simple running mean or the Gaussian. The second solution is the most effective since it
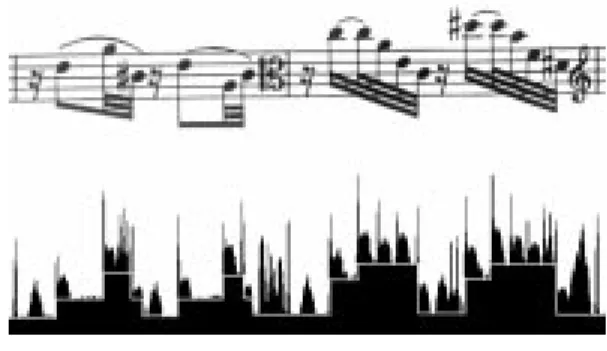
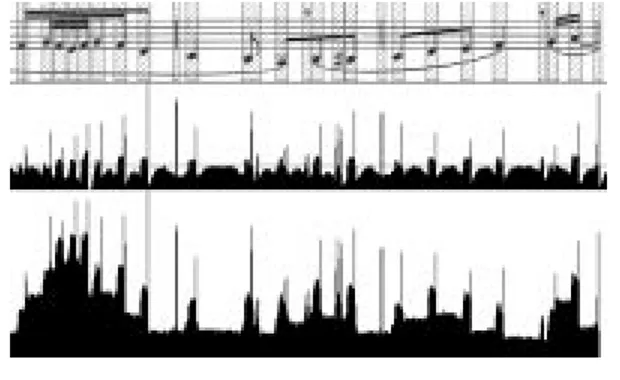
Figure 3. Level 1: the gray line reports differ-ent offset levels corresponding to the pres-ence of beams.
Figure 4. Level 1: the segmentation obtained with the Unsharp Gaussian filter (in the mid-dle). The original histogram is reported be-low.
maintains the most relevant features of the projection pro-file.
3.2. Segmentation: Level 1
Once the staffs are extracted the projection technique can be applied along theX axis (Figure 3). The segmentation
at this level is more complex since it includes all problems that can be found in the other levels. The projection profile shows an offset due to the presence of staff lines. More-over, the profile usually presents a set of different levels of offset corresponding to beams and other horizontal music symbols: wedges (diminuendo, crescendo), slurs, ties, text, etc. These symbols may also be nested each other and thus several offset levels are generated, producing strong discon-tinuities in the projection profile (Figure 3).
The projection profile is also characterized by a set of small hills due to the presence of noteheads and other mu-sic symbols. Most of these symbols are typically all of the same wide. Exception to these rules are the barlines (bars that mark the end of the measures) and the clefs. The goal of the segmentation at this level is to extract the single im-age segment containing only one symbol along theX axis.
This can be done with a unique threshold once removed the offset with a filtering of the profile. However, note that the offset cannot be automatically determined by using filter-ing or other mechanisms without smoothfilter-ing the projection profile and thus losing information.
The goal of filtering is to remove the peaks due to the presence of horizontal symbols leaving the information re-lated to small symbols: noteheads, alternations, accents, etc. In Figure4, the typical results obtainable with the solution chosen (a high-pass Gaussian Unsharp filter) are shown.
Figure 5. Level 2: two typical examples of segmentation.
3.3. Segmentation: Level 2
This level of segmentation is quite simple since the im-age segments do not contain information along the other axis (or this information is very low) as it can be observed in Figure5. In this case, the only information along theY
axis is due to the presence of the note stem. Even in this case, we decide to extract the single graphical components. For example, the notehead, the staff lines cut by stem, the lines due to the beams and due to the crescendo, etc.
4. Experimental Results
The experiments have been performed on several mu-sic sheets printed with different fonts and formats. Some high-pass filters are compared on the basis of their effect on three projection profiles particularly complex: a complete pentagram and two measures that are very interesting for the shape of the corresponding projection profiles. In Fig-ure 6, the filtered profiles together with extracted regions, are reported. The segmentation is evaluated by an Efficiency
Factor (EF), that is the ratio between the number of
elemen-tary regions correctly found by the system, and the number of regions identified by a human supervisor. In the com-plete pentagram we found 48 regions, whereas in the tests of Figure 6 we detected12and15elementary regions,
re-spectively. In the following, we briefly review the filters employed and the results obtained (Figure 6 and Table 1). Unsharp filtering. Unsharp filters are based on the sub-straction of the original signal with the output of a low-pass filter applied to the original signal. The resulting high-pass effect cuts out the regular parts of the profile. Unsharp Gaussian. The signal in correspondence of elementary re-gions maintains its pattern after the filtering. This filter pro-vided best results, among those tested. Note that in parts of the profile with constant trend some additional waves are in-troduced. However these artifacts have no effect since they remain below the level of discontinuities. Unsharp Lin-ear. The filtered projection profile is more noisy than that obtained with the Gaussian Unsharp, giving rise to some “bad” cuttings. In general, there is a greater sensibility to additional horizontal elements (e.g., horizontal text). Gradient filtering. Gradient filters are based on deriva-tive processing, and enhance the portions of the profile with 3
Example 1 Example 2 Test measures Profiles Unsharp Gaussian Unsharp Linear LoG Linear Gradient
Figure 6. Segmentations obtained by some high-pass filters applied on the original pro-jection profile.
rapid variations, corresponding to strips. With gradient fil-ters, we have both positive and negative peaks, and these filters cannot be profitably used since they allow to locate the position of discontinuities, but not their size.
Laplacian filtering. The LoG filter (Laplacian of
Gaus-sian), is based on the second derivative of Gaussian
func-tion. With respect to Gradient filters the variations of pro-file are also located in wider intervals. A limit of this filter is the high sensitiveness to noise. The main limitation is that some regions containing a note head are split in two parts.
5. Conclusions
In addition to the test cases reported in Section 4 we made an extensive experimentation for the segmentation of many music scores with various difficulties. The tests where supported by an appropriate tool that was developed to easily compare various approaches. High levels of confi-dence where reached, and in all these experiments best
re-Filter EF Width Score Ex 1 Ex 2 Unsharp Gaussian 0:95 0:77 1:00 101 Unsharp Linear 0:87 0:69 0:86 81 Gaussian Gradient 0:45 0:30 0:13 15 Sinusoidal Gradient 0:29 0:23 0:26 11 Linear Gradient 0:47 0:23 0:33 9 Stochastic Gradient 0:43 0:15 0:40 7 Laplacian of Gaussian 0:85 0:53 1:00 19
Table 1. Efficiency Factor for three test cases, and width of filters which gave best results.
sults where obtained with Gaussian Unsharp filter. The O3
MR project is being developed in all their parts. In particular, a connectionist architecture based on feed-forward neural networks has been implemented for the module of Basic Symbol Recognition, and interesting re-sults have been obtained.
Acknowledgment
The authors would like to thank all the members of the early project LIOO and the current projects MOODS and O3
MR, Hewlett Packard Italy which is partially supporting us in music projects. A special thanks to S. Macchi for im-plementing the early version of the segmentator.
References
[1] M. Roth, “An approch to recognition of printed music,” tech. rep., Swiss Federal Institute of Technology, ETH Zurich, Switzerland, 1994.
[2] D. Blostein and H. S. Baird, “A critical survey of music image analysis,” in In H. S. Baird, H. Bunke, and K.
Ya-mamoto, editors, Structured Document Image Analysis,
pp. 405–434, Springer, 1992.
[3] H. Kato and S. Inokuchi, “The recogntion system for printed piano music using musical knowledge and con-straints,” in Proc. Worskshop SSPR, pp. 231–248, 1990. [4] Moods (music object oriented distributed system)
http://www.dsi.unifi.it/˜hpcn/wwwmoods/wwwpag.html [5] G. Nagy and M. Viswanathan, “Dual representation of
segmented technical documents,” in Proc. of ICDAR
’91, pp. 141–151.
[6] F. Cesarini, M. Gori, S. Marinai, and G. Soda, “Struc-tured document segmentation and representation by the modified x-y tree,” in Proc. of ICDAR ’99.