ISTITUTO DI POLITICA ECONOMICA
VITA E PENSIERO
Why Italy’s saving rate became
(so) low?
Luigi Campiglio
Quaderno n. 63/febbraio 2013
ISBN 978-88-343-2500-1
Università Cattolica del Sacro Cuore
ISTITUTO DI POLITICA ECONOMICA
Why Italy’s saving rate became
(so) low?
Luigi Campiglio
Quaderno n. 63/febbraio 2013
Luigi Campiglio, Istituto di Politica Economica, Università Cattolica del Sacro Cuore, Milano
I quaderni possono essere richiesti a:
Istituto di Politica Economica, Università Cattolica del Sacro Cuore Largo Gemelli 1 – 20123 Milano – Tel. 02-7234.2921
www.vitaepensiero.it
All rights reserved. Photocopies for personal use of the reader, not exceeding 15% of each volume, may be made under the payment of a copying fee to the SIAE, in accordance with the provisions of the law n. 633 of 22 april 1941 (art. 68, par. 4 and 5). Reproductions which are not intended for personal use may be only made with the written permission of CLEARedi, Centro Licenze e Autorizzazioni per le Riproduzioni Editoriali, Corso di Porta Romana 108, 20122 Milano, e-mail: [email protected], web site www.clearedi.org.
Le fotocopie per uso personale del lettore possono essere effettuate nei limiti del 15% di ciascun volume dietro pagamento alla SIAE del compenso previsto dall’art. 68, commi 4 e 5, della legge 22 aprile 1941 n. 633.
Le fotocopie effettuate per finalità di carattere professionale, economico o commerciale o comunque per uso diverso da quello personale possono essere effettuate a seguito di specifica autorizzazione rilasciata da CLEARedi, Centro Licenze e Autorizzazioni per le Riproduzioni Editoriali, Corso di Porta Romana 108, 20122 Milano, e-mail: [email protected] e sito web www.clearedi.org
© 2013 Luigi Campiglio ISBN 978-88-343-2500-1
Content
Abstract 5 Introduction 7 1. The economics of low and declining saving rate 7
2. The households’ saving decline: a brief overview 12
2.1. The 1992’s currency crisis 15
2.2. The Euro run-up and the Euro “dividend” 19
2.3. The 2006’s turning point 26
2.4. The 2011’s European fiscal consolidation 31
3. Households’ negative saving 34
4. The big saving shift and the Great Recession 38
5. Saving rate and demography 43
6. Saving rate and quasi-fixed costs 49
Conclusion 52 References 54
Abstract
The aim of this paper is to explain why a low and declining saving rate should be a problem in a world of free capital flows and increas-ing wealth. In Italy consumer households’ savincreas-ing have been the main driver of economic stability and growth, funding investments and public debt, and despite international turbulences Italy was acknowl-edged as a high saving country until the early 1990’s. Ever since, however, households saving rate plunged, in spite of an increasing financial wealth, and our aim is to explain why: we suggest two main causes. The first is related to the economic policies implemented to deal with four major economic events, prompted by economic misa-lignments: a) the 1992’s currency crisis, b) the run-up to the Euro, c) the 2006’ turning point, preceding the 2008’s crisis, and d) the 2009’s public debt crisis and the following policy of fiscal consolida-tion. These four events were dealt with economic policies which overlooked the huge income and saving shifts from households to government and private sectors: rising tax burden, especially indirect taxes, freezing of nominal public expenditures and falling real wages were the main policy instruments, while a decreasing households’ income and saving was a primary consequences. Households have been struggling to smooth their standard of life drawing on their sav-ing and wealth, but the effort became all the more difficult as the saving rate was falling below a critical level, increasing the probabil-ity of negative saving and debt. Gross national saving turned less than aggregate investment, prompting an increasing borrowing from abroad and a corresponding negative current account. The second cause is structural and covers two crucial issues: the first is the deep economy impacts of a changing age structure, as a consequence of a sudden fertility drop. The second issue is related to the falling house-holds size composition jointly with the rising share of quasi-fixed costs necessary for a decent life. We show how and why a well de-signed Welfare State could help to restore income stability and sav-ing, tackling the widespread problem of changing age structure in most countries.
6
JEL: E21, D31, E32, H12, H53, N14
Key words: saving, personal income, distribution, welfare programs, crisis management, Italy
Introduction
1Until the early 1990’s Italian households were acknowledged for their high propensity to save, 23,7% of disposable income in 1991: afterward the rate of saving started to decline, falling down rapidly to 8,9% in 2011. Precautionary saving absorbed shocks and stabilized demand: after passing a critical country-specific threshold, around 10% of disposable income in Italy, income slumps in 2009 and 2012 were transmitted directly to the consumption level, while the low saving rate made public debt financing more vulnerable to capital markets volatility. We aim to highlight causes and consequences of this decline, asking to what extent it can be an early warning of what lies ahead for other mature European countries.
1. The economics of low and declining saving rate
The decline in national saving, particularly households’ saving, has been the subject of careful examination for many countries, especial-ly the US (Bosworth, 2012): the basic question is why a low and de-clining saving rate should be a problem in a world of free capital flows and increasing wealth. Saving and wealth are directly related, because saving is the main source of wealth accumulation: however the flow of saving, or bank deposit, is liquid, with low or even nega-tive real interest rate, while wealth, especially financial wealth, can provide yields - through rents, bond interests and stock dividends - and also capital gains or losses. Wealth, even more financial wealth, is risky, in a way that saving, in the form of cash and bank deposit, are not: Federal Deposit Insurance, created in 1933 in the US with the Banking Act, provides insurance up to $250.000 for each deposit ownership in each bank, while in Italy a similar insurance is provided up to € 100.000.
1 I thank Francesca Tartamella for her patience in following the trail of my intricate
thoughts, giving me help and opinions without which I could not complete this pa-per. Carlo Bellavite, colleague and friend, gave me a careful comment to a prelimi-nary draft and the final version absorbed all his suggestions. Of course the final re-sponsibility is, as usual, only mine.
8
Both wealth and saving are highly concentrated: in Italy, in 2010, the top 10% of households, ranked by income, owned the 44% of households saving and the top 10% of households, ranked by wealth, owned the 46% of total wealth, real and financial. Saving and wealth are related but not close substitute: in 2007, before the onset of the Great Recession, in the US the households’ saving rate was close to zero while the ratio of financial wealth to disposable income was very high (4,95 in the US and 3,41 in Italy), but this did not prevent the outbreak of the most severe recession since the Great Depression. The Great Recession shed light on some major reasons: a low saving rate, coupled with a credit crunch, exacerbates the house-holds’ and firms’ financial crisis and worsens their income and profit expectations; pushes the trade and current account balance into defi-cit; increases financial instability because of an excessive reliance on volatile foreign lending, especially with a high public debt; can de-creases suddenly consumption, while households deleverage and in-crease saving to pay debt, putting downward pressure on demand and employment; increases households’ economic hardship, especially for those with negative saving, i. e. income less than current con-sumption (excluding durables). Past or present savings are the main source of wealth accumulation, especially financial wealth, and this is the crucial reason for understanding why in Italy the households’ saving rate slumped over the last two decades.
Until the early 1990’s households’ saving rate in Italy was among the highest with respect to comparable countries, well beyond what could be explained by a life cycle model: indeed a careful analysis suggested that “capital markets imperfections are one of the likely explanations for the high Italian saving rate. Further, their interaction with growth can account for its recent decline” (Guiso, Jappelli and Terlizzese, 1994). A recent paper pointed to the wealth effect as another possible driving force behind the increasing propensity to consume and the symmetric saving rate decline: Bassanetti and Zol-lino (2006) use a VECM estimation on quarterly national account da-ta (1980-2006) to confirm the existence of a significant wealth effect, controlling for the 1992 crisis and the 1998 run-up to the EMU. It is obviously crucial to assess whether these two periods implied
per-manent or transitory effects: our analysis will provide a more de-tailed analysis supporting the view of a long-run effect. Households’ saving rate and financial wealth to disposable income relation is mildly inverse, which means that, at least until the Great Recession onset, a falling saving rate has been balanced by an increasing finan-cial wealth (figure 1): the crufinan-cial question is whether this pattern can be generalized to the whole economy, because empirical evi-dences do not confirm this assumption. Highly indebted households show a steep increase of the debt to disposable income ratio, over time and across income levels (Ehrmann, 2006) while the Bank of Italy Survey of Household Income and Wealth (SHIW) shows a very high concentration of the saving pool in the highest income deciles. This pattern makes difficult to interpret the saving rate dynamic and the wealth dynamic without acknowledging the wide heterogeneity between “rich”, “middle class” and “poor” households: wealth effect surely mirrors economic behavior for the top 10% but it is hardly re-levant for the bottom 10%, where indebted households are the great majority. Inequality of saving and wealth is therefore a central issue when addressing the goal of the economic recovery. Relying on rep-resentative agent models hides the distributional impact of fiscal (consolidation) policies which entail serious equity problems: the trade-off can be addressed only by a fiscal policy, and particularly a social protection system, designed to countervail economic shocks, stabilizing income expectation and the pattern of consumption and saving.
The saving rate dynamic of households’ disposable income (1995-2010) in Italy, Germany, France, Sweden and the UK (Euros-tat data) gives a preliminary insight on the beneficial impact of an effective social protection design. We draw attention to the stability of the households’ saving rates in Germany and France, hovering around 15% of the disposable income from 1995 to 2010: the com-parison with Italy is striking (figure 1). In 1995 the households’ sav-ing rate in Italy was the highest (21,8%) while in 2010 became - after the UK - the lowest (12%), along a steady path of decline. In fact the level of the saving rate in Italy is even lower if we select the more appropriate comparison with the consumer households, whose saving
10
rate was 19,3% in 1995 and dropped to 8,9% in 2010 (in the follow-ing we will refer only to the consumer households, unless otherwise specified). In the case of Sweden the households’ saving rate starts low and ends higher: it was 9,6% in 1995, slowed to 5,8% in 2000 and since then it began an increasing path up to 12,9% in 2010, sur-passing Italian saving rate. Households’ saving rate in the UK shows a pattern similar to the US: it declined from 9,4% in 1995 to the low-est level of 1,7% in 2007, at the onset of the Great Recession: since then it rebounded to 6% in 2011. In section 5, we will show that households’ saving rates for most European countries are also related with the share of social protection benefits: Welfare State effective-ness appears to be an overlooked explanation for this pattern. It is possible to show, for a sample of major European countries, that those with a better performing Welfare State are also good (France) or strong (Sweden and Germany) economic performers, both in terms of economic growth and public budget, coping better with the severe consequences of the Great Recession. Italy stands to the op-posite with an inadequate design of its Welfare system and worse economic performances: the UK stands much closer to Italy than to Germany and France, being hardly hit by the Great Recession, with-out a Welfare State as effective as in Germany, France and Sweden (Campiglio, 2013).
In the next section we focus on Italy with the purpose to show how its declining saving rate is the country-specific outcome of four deliberated major fiscal shocks, which squeezed households’ dispos-able income (as a ratio to the GDP) and produced a huge income share redistribution between institutional sectors: passed a critical threshold, a decrease of disposable income is no more absorbed by precautionary saving and, missing countervailing transfers, shrinks consumption levels.
Figure 1 - Saving rate and financial wealth in Italy
Source: Author’s calculation on Bank of Italy database
Figure 2 - Households’ saving rate in five major European countries
12
2. The households’ saving decline: a brief overview
The household disposable income, as a share of GDP from 1991 to 2011, recorded a slump of 7,5 point of GDP, which implies a striking transfer of resources between institutional sectors in the last 20 years: we find a close correlation between the disposable income of con-sumer households, as a share of GDP, and the saving rate, as a share of disposable income, which falls 14,8 point, from a high of 23,7% in 1991 to a low of 8,9% in 2011 (figure 3). The slump is closely re-lated to four major economic events, prompted by economic misa-lignments: a) the 1992 currency crisis, b) the run-up to the Euro in 1999, c) the 2006’s turning point followed by the sovereign debt cri-sis since 2009 and the d) fiscal consolidation of 2012.
These four events have in common the urgency of fiscal plans geared to pull through the two crisis or a hastened compliance with the Maastricht criteria: stiffer fiscal policies were the common thread through these four emergency events. Over two decades households income and consumption moved always in the same direction, while consumption and saving moved in opposite direction on 14 over 21 years, which points to a consumption smoothing behavior by the households (figure 4).
We find, indeed, a close relationship between the increase of the economy tax burden (direct + indirect taxes) and household’s saving rate over the last two decades (figure 5): the relationship is even stronger with indirect taxes, which are faster to be implemented in times of crisis but also more regressive. We note how each event had a different origin but brought about four distinct downward steps of the savings rate, without no resilience. We therefore analyze in greater detail each one of the four events, starting from the 1992’s crisis, which – it has been noted - resembles the 2009’s crisis, being the former “endogenous” and the latter “exogenous”2: the 2009’s
ex-ogeneity becomes however again endogenous in 2012. Our analysis
2 S. Rossi (2010) “Aspetti della politica economica italiana dalla crisi dalla crisi del
1992-93 a quella del 2008-09”, marzo, Università Roma Tre, mimeo e S. Rossi (2009) “Controtempo. L’Italia nella crisi mondiale”, Laterza.
is aggregate and relies mainly on data by Istat, Bank of Italy, Euros-tat and OECD.
Figure 3 - Households’ income and saving
14
Figure 4 - Households’ income and saving: rates of annual change
Figure 5 - Households’ saving rate and tax burden
(direct and indirect taxes)
Source: our calculation on Bank of Italy (Statistiche di finanza pubblica nei paesi europei) and Istat database
2.1. The 1992’s currency crisis
In September 1992, the European Monetary System (EMS) was dis-rupted by a severe currency crisis, which halted five years of ex-change rate stability and interrupted the path under way to the Euro-pean monetary union. While the causes of the break up are still mat-ter of debate,3 mainly because of the “contagion” effect, there is
some consensus on the case of Italy, whose crisis is closely related to misaligned “fundamentals”, namely a deterioration in competitive-ness and balance of payment4. The response to the 1992’s crisis was
an emergency fiscal package, with a sharp increase of direct and in-direct taxes, a collective agreement for a new wage indexation me-chanism and a public expenditures freeze. The lira’s devaluation,
3 Eichengreen (1993) gives a prompt analysis of the crisis.
16
following the exit from the EMS (until november 1996) prompted a spur in exports, while the price increase from imports was restrained by a wage agreement.
The economic consequences of fiscal policy and devaluation can be measured by the change – between 1992 and 1995 – of the share of GDP for some selected aggregates of the income and demand sides of the GDP. The income side shows a drop of employees’ compensations of 3,5 points of GDP – mainly of gross wages and salaries (table 1) - while indirect taxes increased 1,2 points and cor-porate saving soared 2,3 points (figure 6). The demand side shows a (corresponding) drop of domestic demand for consumption (-1,4 points) and investments (-2 points), while exports share of GDP jumped 6,8 points (figure 7). GDP’s (declining) share of exports was 16,6% in 1992 and abruptly increased to 23,4% in 1995, a level around which it hovered since, reaching its highest – 27% - in 2007.
The fiscal policies, prompted by the currency crisis, caused three long-run structural changes: a) a drop in the share of employees’ gross wage and salaries, which continued until the year 2000, fol-lowed by a slight increase thereafter, b) an upsurge of the tax burden, which also continued until the year 2000, and stabilized afterward, and c) a sharp increase of the export share level. Table 1 shows, in advance, the evolution of the main aggregates over the two decades, to argue that the recent economic quandaries are not that different from the early 1990’s. Now as then, indirect taxation has been the preferred instrument of economic policy because it is fast to get more tax revenues in period of emergency, while an increasingly open economy should have implied more social insurance against social risks, through Welfare State programs, but it did not (Rodrik, 1998; Campiglio 2011).
Figure 6 - Income distribution changes 1995-1992
Source: our calculation on Istat database
Figure 7 - Spending – changes 1992-1995
18
Table 1 -
Structural change
s – shares of GDP (current values and c
hanges) Em pl oy ee com pensation Em pl oy er social cont ribu tio n Gross wage s/ salaries In direct tax es Ex po rt C ons um pt io n In vest m ent 1992 4 4,8 13 ,1 31 ,8 9, 4 16 ,6 79 ,1 21 ,3 1995 4 1,3 12 ,4 29 ,0 10 ,6 23 ,4 77 ,7 19 ,3 2000 3 9,2 10 ,7 28 ,5 13 ,5 24 ,4 79 ,7 20 ,5 2007 4 0,7 10 ,9 29 ,9 13 ,5 27 ,0 79 ,2 21 ,5 2011 4 2,3 11 ,4 31 ,0 13 ,0 26 ,9 82 ,8 19 ,5 1995 -19 92 - 3, 5 -0 ,7 -2 ,8 + 1 ,2 + 6 ,8 - 1, 4 -2 ,0 2000 -19 95 - 2, 1 -1 ,7 -0 ,5 + 2 ,9 + 1 ,0 + 2,0 +1 ,2 2007 -20 00 + 1 ,5 + 0 ,2 +1 ,4 0 + 2 ,6 - 0, 5 +1 ,0 2011 -20 07 + 1 ,6 + 0 ,5 +1 ,1 - 0, 6 - 0, 1 + 3,6 -2 ,0 Source: our calculation on Istat database. Is ta t Rapporto Annuale 2012, tab. 39 an d i.S tat
2.2. The Euro run-up and the Euro “dividend”
In the years preceding the Euro’s inception, in 1999 and immediately after, a new emergency effort arose, in order to comply with the Maastricht criteria and joining the Euro currency from the beginning: demanding budget plans were approved, especially in 1996 and 1997, to comply with the required convergence criteria. The adjust-ment was achieved through a further tax increase (+2,9 points of GDP) and a decrease of employees’ compensation share (-2,1 point of GDP), split in –1,7 points of the social contributions and a -0,5 points of gross wages and salaries (a reversal of the 1992-1995).
The distinctive feature of this fiscal package was a further de-crease of the consumer households’ disposable income following the successful decline of the interest rate spread, being interest payment a notable share of their income. It is crucial to note that in the period 1996-1999 the gross saving slump (-29%) was more than balanced (figure 1) by a corresponding increase of the financial wealth (+44%): in the same period households divested Italy’s government bonds from 352,4 to 171,8 billions (-51%) and reduced bank deposits from 533,6 billions to 444,7 billions (-17%), while increasing stocks’ share in their portfolio, whose holding soared from 259,7 to 655,0 billions (+152%), while rising their financial debt from 279,1 to 379 billions (+36%).
The outcome of the households portfolio reallocation, in the pe-riod 1995-2000, was a 8 points decline of the saving rate on disposa-ble income, while the financial wealth to disposadisposa-ble income ratio in-creased from 2,5 in 1995 to a peak of 3,6 in 2000, a peak newly reached (3,7) only in 2007 (our computation taking as denominator consumer and producer households). The crucial point is that, given the high wealth concentration, household saving rate decreases and financial wealth increases were unevenly distributed and the wealth divide of the higher 10% held steady: these data suggest that a simi-lar aggregate rebalance by the wealthiest should be very unlikely af-ter the Great Recession.
20
Table 2 - Households disposable income and interests payment
(% GDP) Year Households disposable income/GDP of which: interest paid/GDP of which: interest paid/household disposable in-come Saving/ Households disposable income 1995 71,4 9,9 13,8 19,3 2000 66,5 5,2 7,9 11,4 2000-1995 - 4,9 - 4,7 - 5,9 - 7,9
Source: our calculation on Istat database
The economic benefit of the interest rate decline on the public budget was huge, aptly named the “Euro dividend”: the income distribution effects were also considerable and - to some extent – unintended5. Government was, not surprisingly, the main beneficiary with 4,6 points of GDP, exactly balancing the income reduction by the house-holds, while also firms took advantage and financial institutions lost (figure 8).
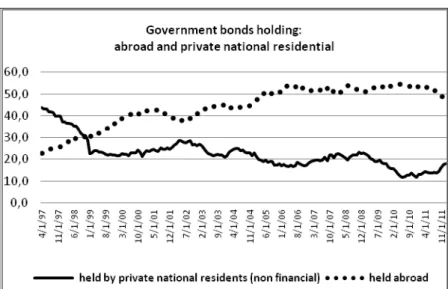
As hinted above, the interest rate drop brought about a radical change of households’ portfolio allocation, away from government bonds: while the share of government bonds held by Italian residents fell swiftly in 1997-1998, the share held by foreign investors – pri-vate and institutional - increased steadily, up to more than half the debt stock by 2005. The increasing exposure to the international cap-ital markets carried along more volatility, as it happened during the sovereign debt crisis (figure 9), while the increasing share of interest payments going abroad rose correspondingly.
5 The problem is currently debated in relation with the low interest rates prevailing
Figure 8 - Gainers and loser for interest payments
Source: our calculation on Istat database
The fiscal policy implemented carried on a further reduction of em-ployee’s compensation, social contribution and wages/salaries: since 1992 employees’ compensation was pushed down 5,6 points of GDP - split in -2,4 points of employers’ social contribution and -3,3 points of lower wage and salaries - while indirect taxes increased a further 2,9 points of GDP, for a total of 4,1 point of GDP (tab 1). House-holds’ saving declined four years in a row, between 1996 and 2000, reflecting a consumption smoothing: saving rebounded in 2001-2002, and so the saving rate, but on a lower level, remaining stable through 2000-2005 and started again to decline in 2006, down to a low of 8,9% – on disposable income – in 2011.
The constraint of the public budget balance eased, allowing an in-crease of government consumption expenditures, general and indivi-dualized: both increased, reaching a peak in 2001 which was howev-er symmetric to the through of the real phowev-er capita decrease in 1994.
22
Between 1992 and 2002 the real per capita consumption expendi-tures increased only slightly and so also the real households’ income adjusted for the public expenditures.
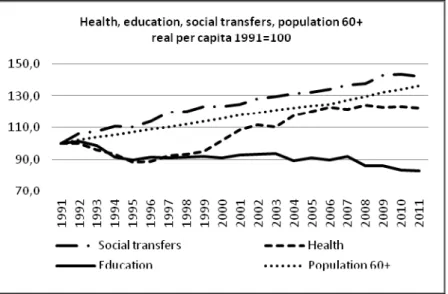
The question is whether fiscal policy, having achieved the goal of the EMU, gave back to the households what government levied with taxes and less expenditures during the previous decade. The answer is that from 2000 to 2005 direct and indirect tax burden (at national level) declined slightly and gradually, while government expenditure did not compensate for the ground lost (figure 11). Looking more closely to government expenditures we need to distinguish two main components: a) monetary transfers (like pensions, unemployment benefits, family allowances), and b) in-kind expenditures for health care provisions (hospitals, physicians, drugs) and education. For these categories we consider the per capita expenditures, adjusted for consumer inflation (monetary transfers) or GDP deflator (health and education), since 1991. Health and education expenditure – real per capita – jointly decrease until the end of the 1990’s: afterwards they diverge and while per capita education expenditure continues to de-crease (- 17% between 1991 and 2011), per capita health expendi-tures started to increase, recovering more than the previous decrease (+ 20% between 1991 and 2011). The monetary transfers show in-stead a in-steadily increase over the entire period (+ 15% over the same period).
The drastic demographic change which has been unfolding in Ita-ly over the last two decades is the driving force which can explain these different patterns, and much of what happened in the two last decades. The Italian population aged 60 years or more increased a staggering +36%, from 1991 to 2011, while the per capita health ex-penditure – whose demand grows steeply after 60 - increased less, +20%: the monetary transfers, for which pensions are the bigger share, increased instead a little more, +42%. The real per capita ex-penditure for education decreased -17%, which is partly accounted by a declining number of younger population: however there are at least two reasons which call for an increasing demand for education expenditure. The first is the growing share of young immigrants, of school age, which require an additional commitment to further their
citizenship, and the second is the poor outcome of the Italian school system, well below the OECD average for the PISA rankings (figure 12).
Figure 9 - Government bonds holding:
National residents and abroad
24
Figure 10 - Households and Government:
Income distribution changes 2000-1995
Figure 11 - Government collective and individual real
per capita consumption
26
Figure 12 - Health, education and social transfers expenditures
Source: our calculation on Istat database. General government accounts 1990-2001, table 30
2.3. The 2006’s turning point
In 2007 the gross general government debt to GDP ratio in Italy reached its lowest level since the early 1990’s - down to 103,3 – as a result of a new round of a tighter fiscal policy implemented to hasten public debt reduction. The sudden eruption of the Great Crisis stuck the country at the crossroad of the policy implementation, and as a consequence the public debt to GDP ratio soared to 120,7 in 2011, while the GDP plunged in 2009: sharp increases of unemployment and public debt have been sweeping South European countries ever since. The sudden economic shock unveiled the inadequacy of the social protection system in Italy - namely its lack of effectiveness in coping with increasing households’ economic strains and inadequate counter-cyclical behavior, given its low per capita benefits – and the
further decrease of real disposable income, as a consequence of the tax burden increase and the higher inflation.
Real disposable income per capita in 2011 went back to the level of 1991: the abrupt increase of immigrants – most of them individu-als – and the time lag for legalizing the unauthorized has probably biased the annual measure, but the real per capita value is neverthe-less correct over the two decades. The retracing of households’ dis-posable income is even more disturbing, because of a long standing downward trend which the economic crisis has only hastened. After the 2000’s through in saving (and the consumption peak), house-holds’ saving rate bounced back slowly until 2005, followed by a further turning point in 2006, when the saving rate on disposable in-come dipped again, and then went all the way down to the lowest level in the last two decades, less than 9% in 2011 (figure 13). The saving decline, related to the real income drop, was caused jointly by a higher tax burden and the consequences of the economic crisis (figure 14): the saving decline is also related to the increase of households’ loans, due to mortgages or consumer credit (figure 15). The loans’ increase is not, by itself, a signal of economic stress, be-cause loans – granted by financial institutions - are usually related to the wealth and income level: if however we combine the relationship with the dynamic of specific income strains, based on EU-Silc sur-vey, the signal of stress is strongly supported. The EU-Silc survey asks two questions which are closely related with households’ sav-ing: the first is whether the household can afford “to face unexpected financial expenses”, where the threshold of unexpected expenses is set to 800 euro, while the second asks whether the household has “ar-rears” (mortgage or rent, utility bills or hire purchase). The European comparison of households’ economic strains related to savings shows in Italy a sudden jump in 2011, which is noteworthy if compared with the stable or improving situations in Germany, France, Sweden and the UK (table 3).
28
Table 3
Inability to face unexpected financial expenses
% population 2006 2007 2008 2009 2010 2011 Germany 41,0 36,5 34,9 34,6 33,7 34,5 France 33,3 34,5 34,1 32,5 33,0 33,0 Italy 27,5 32,0 31,6 33,1 33,3 38,6 Sweden 13,9 18,0 19,5 18,5 15,8 16,6 United Kingdom 28,5 26,6 28,6 31,1 34,7 36,7
Arrears (mortgage or rent, utility bills or hire purchase)
% population 2006 2007 2008 2009 2010 2011 Germany 6,9 5,8 5,6 5,6 4,9 5,2 France 9,7 9,8 9,6 11,2 10,8 9,9 Italy 12,9 12,5 15,8 12,7 12,8 14,2 Sweden 8,0 5,8 6,2 7,0 6,4 5,9 United Kingdom 8,7 8,5 7,4 .. 9,6 8,9
Source: our calculation on Eurostat database
The comparison of the households’ saving rates in Italy, Germany, France, Sweden and the UK show that Italy’s saving rate was the highest in 1995, converges to the levels of Germany and France in 2005 and then departs downwards since 2006, becoming much lower with the economic crisis, while Sweden instead increased (figure 1). The question arises about what makes the difference between Italy, on one side, Germany, France, Sweden and the UK on the other: our answer is that Germany, France and Sweden benefited from a well designed countercyclical Welfare State which stabilized households’ income, monetary and in-kind, avoiding the shocks which instead destabilized Italian economy (Campiglio, 2013).
Figure 13 - Real disposable income per household and per capita
30
Figure 14 - Tax burden (domestic direct and indirect /GDP)
Figure 15 - Households’ saving rate and loans
(to disposable income)
Source: our computation on Bank of Italy and Istat database
2.4. The 2011’s European fiscal consolidation
In 2011 tighter budget rules aimed at fiscal consolidation have been approved by the European Union, calling for a reduction of deficit and the public debt and closer mechanism of surveillance. The main provisions are the following:
a) the six-pack, effective since December 2011, made of five regulations and one directive, which strengthen the Stability and Growth Pact in the fiscal field, and the Treaty on Stabil-ity, Coordination and Governance (TSCG), signed in March 2012, which includes the Fiscal Compact. The two provi-sions overlap but have also distinct features, in particular the
32
reverse qualified majority voting procedure. A two pack provision is added for the Euro countries.
b) More specifically the provisions regarding the economic pol-icy in Italy are:
- the commitment to reduce the public debt/GDP ratio “at an average rate of one twentieth per year as a bench-mark” when the ratio “exceeds the 60% reference value” (article 4, TSCG).
- the commitment to a budget balance, “deemed to be res-pected if the annual structural balance of the general government is at its country-specific medium term ob-jective [(MTO)] … with a lower limit of a structural def-icit of 0,5% of the gross domestic product at market prices” (article 3, TSGS). With the Parliamentary Ap-proval on April 2012, Italian Constitution was modified accordingly
- “annual structural balance of the general government” refers to the “annual cyclically-adjusted net of one-off and temporary measures” and an exceptional circums-tance refers to “unusual event outside control …or to pe-riod of severe economic downturn … provided that the temporary deviation … does not endanger fiscal sustai-nability in the medium term” (article 3, TSCG)
In November 2011 an emergency act, going by the name “Saving Ita-ly”, was enacted, with the target – jointly with the previous acts – to achieve a budget “close to balance” in 2013, one year earlier than what originally planned. The tax burden was planned to increase 2,6 points of GDP, from 42,5% in 2011 to 45,1% in 2012, and to an all time high of 45,4% in 2013.6 The decline of the saving rate on
households’ disposable income, while still falling down, seems to bottom out, which would imply a higher “propensity to consume” – as an accounting identity - while in fact masks a private consumption
6 “Documento di Economia e Finanza 2012”, Programma di Stabilità e Analisi e
Tendenze della Finanza Pubblica, Ministero dell’Economia e delle Finanze, p. 12 e seg.
slump: it could signal a restructuring of consumption patterns to make room for a process of gradual deleveraging. In Italy the in-crease of households’ indebtedness is still lower than in Germany and France, but converging to the similar increasing level in France and the decreasing ratio in Germany: Italian households are trying to deleverage and consolidate their financial position, facing however the constraint of falling disposable income7 (figure 15 and 16).
Selling assets, real or financial, could be a temporary buffer, giv-en the high wealth/disposable income ratio of Italian households: there are however two caveats. The first is the high wealth inequali-ty8: in 2010 the top 10% of households held 45,9% of total wealth,
with a still higher concentration for financial wealth, while the low-est 50% of households held 9,4% of total wealth. The second is that houses – the main item of real wealth – accounted for 58% of total net wealth: however their liquidity is much lower, especially when the owner lives in the house, or during a serious recession. Moreover, most of the net wealth increase between 1995 and 2011 is related to saving (65%), which bring back to the issue of households’ saving as an engine of well-being and growth. As a consequence a low level of saving becomes an economic and social problem when income and wealth inequality runs higher, which bring to the forefront the issue of negative savings, i,e. households whose income is lower than their consumption.
7 Household debt overhang can hold back consumption both as a consequence of
debt service (Dynan, 2012) and worsening expectations of future in-come.
8 The following data comes from Banca d’Italia (2012) “La ricchezza delle famiglie
34
Figure 16 - Households’ debts
Source: our calculation on Eurostat database
3. Households’ negative saving
As Katona pointed out (1949) during 1946 and 1947 “willingness to spend more than one’s income was provided by the relatively high income level and the optimistic expectations of most families”, which caused an unexpected shift of consumption-income relation-ship: a forecasting failure which prompted new theories and re-searches on consumer behavior. Negative saving is now interpreted as a rational process of borrowing, when young, and dissaving, when retired, in order to smooth consumption: however it is now well rec-ognized that capital markets are incomplete, but nevertheless nega-tive saving is still on overlooked issue. Neganega-tive saving can be, of course, also a signal of economic stress or a gloomy mood, but it can mean much more. For our purposes we use a stringent definition of negative saving, excluding imputed rents from the disposable income
and durable goods from the consumption: negative saving is there-fore the difference between monetary income and current expendi-tures, the former being less than the latter. How the gap is filled and how long the disequilibrium will persist is an open question for which more research is needed9. The following analysis, based on the
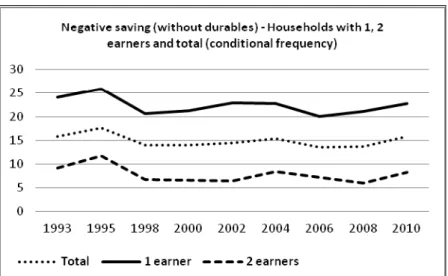
Bank of Italy’s Survey of Household Income and Wealth (SHIW) over the period 1993-2010, show some clear and interesting patterns, which we propose as frequencies conditioned by the type of charac-teristic considered, i.e. as a proxy of conditional probability, for ex-ample Probability (negative income| household with 1 earner).
In fact the saving rate for the households with 2 earners is consis-tently higher than the earning for the households with 1 earner: the average for the economy – hovering on the high level of 15% - turn out to be the simple average of the two types, with clear conse-quences on income inequality (figure 17). The higher saving rate for the households with 2 earners can be explained at least in two ways: first of all the quasi-fixed costs for a couple without children are sim-ilar for households with 1 and 2 earners, but the couple with 2 earn-ers will get a an almost double disposable income, with the opportu-nity of spending and saving more. The question arises of why there are couples with only 1 earner: we suggest two main reasons. A couple can have only 1 earner because there are children and for one member, typically the mother, it is too difficult to reconcile work and family life and/or the labor market does not offer enough job open-ings, as it happens in the South of Italy and during the Great Reces-sion.
Looking to the professional status we find three distinct patterns: households with blue-collar(s) as main earner(s) recorded an increas-ing negative savincreas-ing since 2000, which would seem to imply a wor-sening of their standard of life. To a less degree the same pattern ap-plies to the white collars, whose negative savings also increase since 2000. Retired people are instead the main social group whose nega-tive saving has been declining since the early 1990’s, converging with the white collars: there at least two possible reasons. This social group can rely more on higher past saving and given their limited
36
borrowing access they tend to decrease their negative saving and/or the consumption per capita or per household is, ceteris paribus, lower for older couples or individuals, for age-related reasons (figure 18). Negative savings are also higher in the South, and lower in the Cen-tre, while increasing steadily in the North since 200010: the increase
in the North can be explained by the higher burden of the economic crisis, the higher cost of living in the North and the shift to market of caring activities for children and the elder people (figure 19). These patterns are consistent with two other groups: the probability of negative saving increase for the households living in rented houses and also increasing for the households whose reference person is less than 40 years old (figure 20).
Figure 17 - Negative saving: by number of earners
Source: our calculation on Bank of Italy SHIW
10 These results are broadly in accordance with Jappelli and Padula (2007), who run
Figure 18 - Negative saving: professional status
Source: our calculation on Bank of Italy SHIW
Figure 19 - Negative saving: North, Centre and South
38
Figure 20 - Negative saving: age and rent
Source: our calculation on Bank of Italy SHIW
4. The big saving shift and the Great Recession
Households are a major contributor to the pool of Gross Domestic Saving: in 2011 consumer households contributed 36,1% to the total domestic saving, with an impressive slump with respect to the 62,2% in 1995. If we look at the nominal values of the gross saving the two main economic actors on the economic landscape were the non fi-nancial corporations and the consumer households: the former in-creased the value of saving while the latter acted as a shock absorber of all the main fiscal packages, especially those related to the run-up to the Euro and the sovereign debt crisis (figure 21). The perspective changes considerably if we look at the saving as a share of GDP: be-tween 2011 and 1995 the share of consumer households saving de-creased sharply (7,9 points of GDP), while the corporate saving share remained rather stable over the two decades. Government saving, i.e. the balance of current revenues less current expenditures, was
nega-tive from 1995 to 1997 and from 2003 to 2005, posinega-tive from 1998 to 2002 and from 2006 to 2008: the Great Recession pushed again gov-ernment saving in the negative zone from 2009 to 2011 (figure 22). The government negative saving was the consequence of the reces-sion rather than increasing government spending: from 2008 to 2011 the current public expenditures increased nominally +5% and +1% real, given a +4% price increase, while the GDP nominal growth was +2,9%, i.e. lower than public expenditures and negative in real terms.
We have already shown that for a sample of major European countries, countervailing social protection expenditures have been an effective counterbalance to the problems of unemployment and households hardship, putting temporarily on hold the goal of gov-ernment balance, or balancing the budget with one-off (temporary) expenditure cuts, allowed by a high level of social protection ex-penditure (Campiglio, 2013). Furthermore, if we consider that the countervailing role played (in the past) by the family is now wea-kened, the role of the Welfare State should strengthened accordingly, directly and through the family.
The big saving shift, siphoned by the households income, was not neutral: in fact the saving rate for the economy declined from 22,2% of the GDP in 1995 to 16,4% in 2011, reducing the flow of funds from households saving to finance government deficit and corporate investments (figure 22 and 23). The issue is crucial for financing domestic investment: if the gross domestic saving is less than the gross domestic investments the gap can be filled by the inflow of borrowed foreign saving and, symmetrically, a capital outflow is the outcome of saving exceeding investments. In an open economy posi-tive domestic net saving is the source of funding for investments abroad, while negative net saving need to be funded by foreign sav-ers: at the same time net lending or borrowing of an open country is the counterpart of the current account balance. Until 2001, Italian economy was a net lender, while afterwards it slowly became a net borrower, more than 3% of GDP in 2010 and 2011 (figure 24): the current account deficit call for an explanation which goes far beyond the economic crisis, retracing the roots of unsolved economic misa-lignments of the Italian economy in the last two decades.
40
Figure 21 - Saving by institutional sectors
Figure 22 - Saving by institutional sectors:
changes 2011-1995 (%GDP)
42
Figure 23 - Saving by institutional sector
Figure 24 - Saving and current account
Source: our calculation on Istat and OECD database
5. Saving rate and demography
Italy is one of the oldest major countries in the world, together with Germany and Japan, and therefore it seems appropriate to ask wheth-er the demographic shift, with an increasing share of oldwheth-er and re-tired population, is a primary long-run cause for the saving rate de-cline. In the Euro area (17) the share of population aged 65 and over has increased since 1995, while the household saving rate remained rather stable, however with different and divergent patterns across countries. Over the period 1995-2011 there is a clear negative corre-lation between households’ saving rate and the share of persons aged over 65 in the case of Italy, Belgium, Netherland and Poland, a posi-tive correlation for Germany and Sweden, and no clear relationship in the case of France and Norway. Figure 25 shows clearly the
di-44
verging ageing pattern between Italy and Germany in contrast with the younger population in France: however the common ageing tern between Italy and Germany is not associated with the same pat-tern in the saving rate, which is constant in Germany while dropping in Italy (figure 2). To shed light on the cause of the divergence we note how aging population in Italy pulled immigration of caregivers to a much greater extent than in Germany: the number of caregivers in Italy has rapidly increased, close to one million, mainly women who emigrate from their country to support their family and children. Because estimates of “out of pocket” money for health care by the households are between 28 to 30 billions11, creeping privatization of
health care is a major drain of parents’ and grandparents’ monetary resources.
To check whether this is a plausible explanation of demographic impact on the saving rate, we test for a relationship between the so-cial protection benefits, as a share of the GDP, and the saving rate: the hypothesis being that a well designed Welfare State could pro-vide for the needs of people with inadequate income, through cash transfers (like family allowance) and in-kind provisions (like health care). The test for a subset of European countries for which we can find comparable data seems to support this hypothesis (Figure 26), suggesting indeed a further stronger relationship between social ben-efits and potential output, which we proxy with the share of popula-tion of working age. Indeed, a cross-secpopula-tion for the European coun-tries shows a clear relationship between the share of population 15-64, a measure of potential workforce, and social protection benefits (associated with the level of household saving rate), while in turn the social protection benefits (share of GDP) is a clear explanatory vari-able of the tax revenues-to-GDP ratio (including social contributions) (figure 27-28). The relationship between social protection expendi-tures and potential workforce, as estimated for the European coun-tries, allows for some counterfactual exercises. An hypothetical US Welfare State, based on the European relationship with the work-force potential, is estimated 26% of the GDP in the US: in 2011 out-lays for health, Medicare, income security and social security already
accounted for 14,5% of the GDP. The US Census projection to 2050 for the population 14-64 years is 62,3%, down from 67,2% in 2015. The same exercise in the case of China implies a hypothetical Wel-fare State worth 15,9% of the GDP in 2011: the projection of the re-lationship to 2020, 2030, 2040, 2050 returns an increasing share of GDP of 21,4%, 25,2%, 34,6% and 38,2% (population 15-64 years: 71,8% in 2015 and 60,2% in 2050)12. The workforce potential is, not
surprisingly, closely monitored because it is a clear force behind the striking increase of the saving rate in China, from 36.3% of the GDP in 1982 to 52,7% in 2011 (World Bank), simultaneously to the in-crease of the potential workforce (15-64 years) from 61,1% in 1982 to 72,5% in 2011. The forecast show a potential advantage for the US, in the next decades, while the one-child policy in China, man-dated nationwide in 1979, could potentially produce a huge boom and bust in the next 20 to 30 years.
46
Figure 25 - Population 65 +
Figure 26 - Households’ saving and social benefits
48
Figure 27 - Welfare State and potential active population
Figure 28 - Social protection benefit, tax and social contributions
Source: our calculation on Eurostat database
6. Saving rate and quasi-fixed costs.
The real per capita household disposable income in 2011 is almost the same than twenty years earlier, in 1991: the question is whether, beyond the previous arguments, other economic forces are driving the saving rate lower in the long-run. The disposable income per household, deflated with the price index, is slowly decreasing since the early 1990’s and therefore also other forces are slowly changing the economy (figure 13).
The decreasing family size in Italy, as well in many other coun-tries, is the closer candidate calling for a closer scrutiny. For exam-ple, it is customary to adjust, with the equivalence scales, for the scale effect of increasing family’s size, but it should be acknowl-edged also the downside, i.e. the decreasing scale effect of a smaller
50
family size. The Italian average family size was 2,85 in 1991 and de-creased to 2,4 in 2011 (estimate), i.e. – 15,7% in 20 years: even more telling is the increasing share of one-person households, which ac-counted for 9,5% of total households in 1951 and increased up to 24,9% in 2001, while households with 6 persons and more dropped from 20,1% in 1951 to 1,7% in 2001 (figure 29). The diseconomies of scale should show up as especially relevant for the quasi-fixed ex-penditures, i.e. costs that each household would incur simply because it is an economic unit, meaning that the average household needs more income to get the same welfare level, which in turn should imply an increasing share of quasi-fixed costs and possibly a lower saving rate. Another way to deal with this issue is to figure out the effect of a consumption function shifting upward because of a higher subsistence level, which in the competitive market would correspond to a higher positive value for the initial endowment of each agent.
The absolute level of subsistence is time-varying over a long time span: goods and services which were considered luxury fifty years ago are now considered part of a normal and decent life, the mini-mum level of income necessary to be a citizen of a national commu-nity. Quasi-fixed costs for a family should represent an increasing share of total consumption (and income), simply because it becomes more expensive to make a decent living in a civilized society.
A (short-run) confirmation for this hypothesis can be obtained considering households’ total consumption (excluding imputed rents) ranked by deciles and the structure of consumption for each decile: for each decile we consider food consumption (at home and away from home) plus housing expenditures as a measure of quasi-fixed costs. A more complete measure would account for consumer du-rables and transport cost required for commuting. Figure 30 summar-ize the share of quasi-fixed costs (food plus housing) for the 1st, 5th and 10th decile, and the average, for each year from 1997 to 2010: it is possible to check that the share of quasi-fixed costs decreases sharply with the increase of households’ consumption level while during the period considered increased slightly but steadily. In par-ticular the share of quasi-fixed costs (as here defined) for the 5th de-cile equals 53,9% in 2010, up from 49,7% in 1997, while, at the
same time, the average family size increases monotonically with the increasing consumption level of each decile.
Figure 29 - Households per number of persons
52
Figure 30 - Households’ quasi-fixed costs
Source: our calculation on Istat database
Conclusion
The sharp decline of total and consumer saving in Italy can be ex-plained by the sequence of four severe fiscal packages implemented to face emergency crisis: policy instruments chosen made the eco-nomic burden of the adjustment falling entirely on consumer house-holds, whose real income fell sharply together with their saving rate. The falling real income of consumer households is therefore the ma-jor cause of the saving rate drop while the lack of economic equity is the main and recurring policy shortcoming from which it originated. Very low households’ saving rates propagated their impact to the en-tire economy: less funding for domestic investments and public debt, increasing foreign debt and current account deficit, increasing private debt and economic strain, tighter negative saving for one earner’s families and blue-collars, are the main consequences for which we
could provide evidences. The changing age structure, caused by a fertility drop, had widespread consequences in Italy as well as in oth-er European countries: the rapidly ageing economy has a detectable effect on saving rate while the role of the Welfare State increases with the decreasing share of the working age population, in turn a proxy of output potential. We make a counterfactual exercise for the U.S. and China and the results are a glimmer view of a global future scenario. Shrinking family’s size and the increasing share of quasi-fixed costs for a decent life are also a structural cause for declining saving rate. We suggest that a well designed Welfare State can smooth and balance the adjustment processes of a society, promoting innovations through equity, while allowing the transition to a sus-tainable development.
54
References
Banca d’Italia (2012) “La ricchezza delle famiglie italiane”, supple-mento al bollettino di Statistica, Indicatori monetari e finanziari, 13 dicembre, n. 65.
Bassanetti, A. and Zollino F. (2008) “The effect of housing and fi-nancial wealth on personal consumption: aggregate evidence for Ital-ian households”, in “Household wealth in Italy”, Banca d’Italia. Campiglio, L. (2013) “Welfare State, family and market’s SINS in the EU”. To be published in International Sociological Review, mi-meo.
De Grauwe, P. (1996) “International Money”, Oxford University Press.
“Documento di Economia e Finanza 2012” (2012) Programma di Stabilità e Analisi e Tendenze della Finanza Pubblica, Ministero dell’Economia e delle Finanze, 18 aprile.
Dynan, K. (2012) “Is a Household Debt Overhang Holding Back Consumption ?”, in Brookings Paper on Economic Activity, spring, p. 299-344.
Eichengreen, B. and Wyplosz C. (1993) “The unstable EMS”, in “Brookings Papers in Economic Activity”, p. 51-143.
Eurostat (2011) “Key figures on European business. With a special feature on SME”.
Ehrmann, M. (2008) “Discussion of the paper by A. Bassanetti and F. Zolino”, in “Household wealth in Italy”, Banca d’Italia.
Guiso, L., Jappelli, T. and Terlizzese, D: (1994) “Why is Italy’s sav-ing rate so high?”, in “Savsav-ing and the Accumulation of Wealth. Es-says on Italian Household and Government Behavior”, edited by Al-berto Ando, Luigi Guiso, & Ignazio Visco, Cambridge University Press.
Katona, G. (1949) “Analysis of Dissaving”, The American Economic Review, vol. 39, n. 3, p. 673-688.
Jappelli, T. and Padula, M. (2007) “Households’ Saving and Debt in Italy”, CSEF, Centre for Studies in Economics and Finance, Univer-sity of Salerno.
Rodrik, D. (1998) “Why Do More Open Economies Have Bigger Governments ?”, in “Journal of Political Economy”, vol. 106, no. 5, p. 997-1032.
Rossi, S. (2010) “Aspetti della politica economica italiana dalla crisi del 1992-93 a quella del 2008-09”, 5 marzo 2010, Università Roma Tre, mimeo.
Rossi, S. (2009), “Controtempo. L’Italia nella crisi mondiale”, Ro-ma-Bari, Laterza.
The Economist (2012) “Savers’ lament”, december 1.
Wei, C. and Jinju, L. (2009) “Future Population Trends in China: 2005-2050”, Centre of Policy Studies and the Impact Project, Mo-nash University, General Paper No. G-191, September.
56
Elenco
Quaderni già pubblicati
1. Capitalismo senza capitale. Il capitalismo italiano delle
diversità. L. Campiglio, luglio 1993.
2. Credibility and Populism in the Management of a Public
Social Security System. L. Bonatti, luglio 1993.
3. Il ruolo delle Nonprofit Organizations nella produzione di
servizi sanitari. R. Creatini, dicembre 1993.
4. Technological Change, Diffusion and Output Growth. M.
Baussola, dicembre 1993.
5. Europe: the Trademark is Still on the Mark. L.
Campig-lio, gennaio 1994.
6. A Cointegration Approach to the Monetary Model of the
Exchange Rate. M. Arnone, febbraio 1994.
7. Gli effetti del debito pubblico quando la ricchezza è un
fi-ne e non solo un mezzo. V. Moramarco, maggio 1994.
8. Emissioni inquinanti, asimmetria informativa ed efficacia
delle imposte correttive. R. Creatini, settembre 1994.
9. La disoccupazione in Europa. L. Campiglio, novembre
1994.
10. The Economics of Voting and Non-Voting: Democracy and
Economic Efficiency. L. Campiglio, gennaio 1995.
11. The Banking Law and its Influence on the Evolution of the
Italian Financial System. C. Bellavite Pellegrini, maggio
1995.
12. Monetary Authorities, Economic Policy and Influences in
the Capital Market in Italy 1960-1982. C. Bellavite
Pelle-grini, giugno 1995.
13. A General Model to Study Alternative Approaches to
Eco-nomywide Models in a Transaction Values (TV) Context.
F. Timpano, giugno 1995.
14. Economia legale ed economia illegale: schemi
interpreta-tivi della coesistenza. D. Marino, F. Timpano, luglio 1995.
15. Il problema del cambiamento dei coefficienti nel contesto
di una matrice di contabilità sociale regionalizzata. F.
Timpano, settembre 1995.
16. La dimensione transnazionale dell’inquinamento marino:
le convenzioni internazionali tra teoria e pratica. G.
Ma-lerba, giugno 1996.
17. Efficienza, stabilità degli intermediari e crescita del
reddi-to: un modello teorico. C. Bellavite Pellegrini, novembre
1996.
18. Innovation and the World Economy: How will our (Grand)
Children Earn a Living?, L. Campiglio, P. J. Hammond,
gennaio 1997.
19. Evaluating Private Intergenerational Transfers between
Households. The Case of Italy. F. Tartamella, febbraio
1997.
20. Qualità e regolamentazione. R. Creatini, maggio 1997.
21. Wage Differentials, the Profit-Wage Relationship and the
Minimum Wage. G. Quintini, giugno 1997.
22. Potere e rappresentatività nel Parlamento Italiano: una
prospettiva economica. L. Campiglio, luglio 1997.
23. Exchange Rate, Herd Behaviour and Multiple Equilibria.
M. Arnone, settembre 1997.
24. Rank, Stock, Order and Epidemic Effects in the Diffusion
of New Technologies in Italian Manufacturing Industries.
E. Bartoloni, M. Baussola, dicembre 1997.
25. Stabilità ed Efficienza del Sistema Finanziario Italiano:
una Verifica Empirica. M. Manera, C. Bellavite Pellegrini,
gennaio 1998.
58
26. Endogenous Uncertainty and Market Volatility. M. Kurz,
M. Motolese, aprile 1999.
27. Famiglia, distribuzione del reddito e politiche familiari:
una survey della letteratura degli anni Novanta. Parte
prima: I nuovi fenomeni e i vecchi squilibri delle politiche
sociali. G. Malerba, aprile 2000.
28. Modelli di Agenzie di sviluppo regionale: analisi teorica
ed evidenza empirica. M. Arnone, C. Bellavite Pellegrini,
F. Timpano, aprile 2000.
29. Endogenous Uncertainty and the Non-neutrality of Money.
M. Motolese, maggio 2000.
30. Growth, Persistent Regional Disparities and Monetary
Policy in a Model with Imperfect Labor Markets. L.
Bon-atti, maggio 2001.
31. Two Arguments against the Effectiveness of Mandatory
Reductions in the Workweek as a Job Creation Policy. L.
Bonatti, maggio 2001.
32. Growth and Employment Differentials under Alternative
Wage-Setting Institutions and Integrated Capital Markets.
L. Bonatti, maggio 2001.
33. Attività innovativa e spillovers tecnologici: una rassegna
dell'analisi teorica. A. Guarino, maggio 2001.
34. Famiglia, distribuzione del reddito e politiche familiari:
una survey della letteratura italiana degli anni Novanta.
Parte seconda: La riforma del Welfare e le sue
contraddi-zioni. G. Malerba, giugno 2001.
35. Changeover e inflazione a Milano. L. Campiglio, V.
Ne-gri, giugno 2002.
36. Prezzi e inflazione nel mercato dell’auto in Italia. L.
Cam-piglio, A. Longhi, ottobre 2002.
37. Interessi economici, potere politico e rappresentanza
par-lamentare in Italia nel periodo 1948-2002. L. Campiglio,
F. Lipari, maggio 2003.
38. Dai consumi interni a quelli dei residenti: una stima
pre-liminare a livello regionale. C. Corea, giugno 2003.
39. Studio delle relazioni tra spesa familiare e caratteri
socia-li, demografici ed economici delle famiglie italiane:
un’analisi a livello sub-nazionale. A. Coli, giugno 2003.
40. L’utilizzo delle indagini su redditi e consumi nella
deriva-zione di indicatori per scomporre i dati di Contabilità
Na-zionale. Un caso riferito all’analisi regionale. F.
Tartamel-la, giugno 2003.
41. Segnali di disagio economico nel tenore di vita delle
fami-glie italiane: un confronto tra regioni. G. Malerba, S.
Pla-toni, luglio 2003.
42. Rational Overconfidence and Excess Volatility in General
Equilibrium. C.K. Nielsen, febbraio 2004.
43. How Ethnic Fragmentation And Cultural Distance Affect
Moral Hazard in Developing Countries: a Theoretical
Analysis. T. Gabrieli, febbraio 2004.
44. Industrial Agglomeration: Economic Geography,
Techno-logical Spillover, and Policy incentives. E. Bracco, ottobre
2005.
45. An Introduction to the Economics of Conflict, a Survey of
Theoretical Economic Models of Conflict. R. Caruso,
otto-bre 2005.
46. A Model of Conflict with Institutional Constraint in a
two-period Setting. What is a Credible Grant?, R. Caruso,
ot-tobre 2005.
47. On the Concept of Administered Prices. L. Gattini,
dicem-bre 2005.
48. Architecture of Financial Supervisory Authorities and the
Basel Core Principles. M. Arnone, A. Gambini, marzo
2006.
49. Optimal Economic Institutions Under Rational
60
Regime and the Design of Social Security. C.K. Nielsen,
aprile 2006.
50. Indicatori di vulnerabilità economica nelle regioni
italia-ne: un’analisi dei bilanci familiari. G. Malerba, giugno
2006.
51. Risk Premia, Diverse Beliefs and Beauty Contests. M.
Kurz, M. Motolese, gennaio 2007.
52. Le disuguaglianze regionali nella distribuzione del
reddto. Parte prima: Un’analisi della povertà delle famiglie
i-taliane. G. Malerba, dicembre 2009.
53. What do we know about the link between growth and
insti-tutions?, M. Spreafico, maggio 2010.
54. Economic Institutions and Economic Growth in the
For-mer Soviet Union Economies. M. Spreafico, maggio 2010.
55. Famiglia, figli e sviluppo sostenibile. L. Campiglio,
set-tembre 2011.
56. Le determinanti politico-economiche della distribuzione
interregionale della spesa pubblica. V. Moramarco,
otto-bre 2011.
57. Le disuguaglianze regionali nella distribuzione del
reddi-to. Parte seconda: Un’analisi delle famiglie italiane a
ri-schio di povertà. G. Malerba, ottobre 2011.
58. Libertà del vivere una vita civile e deprivazione
economi-ca. L. Campiglio, ottobre 2011.
59. Europa, crescita e sostenibilità: “E Pluribus Unum”. L.
Campiglio, Vita e Pensiero, febbraio 2012 (ISBN
978-88-343-2215-4).
60. Market’s SINS and the European Welfare State: theory
and empirical evidences. L. Campiglio, Vita e Pensiero,
settembre 2012 (ISBN 978-88-343-2323-6).
61. Brutality of Jihadist Terrorism. A contest theory
Caruso, F. Schneider, Vita e Pensiero, ottobre 2012 (ISBN
978-88-343-2360-1).
62. Hooliganism and demand for football in Italy
.Evidence
for the period 1962-2011. R. Caruso, M. di Domizio, Vita
e Pensiero, novembre 2012 (ISBN 978-88-343-2368-7).
63. Why Italy’s saving rate became (so) low?, L. Campiglio,
62
Printed by Gi&Gi srl - Triuggio (MB)
ISTITUTO DI POLITICA ECONOMICA
VITA E PENSIERO
Why Italy’s saving rate became
(so) low?
Luigi Campiglio
Quaderno n. 63/febbraio 2013
ISBN 978-88-343-2500-1