Table of contents
Abstract (English) ... 12
Abstract (Italiano) ... 13
1 Introduction ... 15
2 Background & State of the Art ... 18
2.1 The current context: the Industry 4.0 ... 18
From Industry 1.0 to Industry 4.0 ... 18
The Industry 4.0 key enabling technologies ... 21
Safety and training requirements in complex 4.0 industrial systems ... 23
2.2 Major Accident Hazards Industrial Sites ... 25
Trend and examples ... 25
An overview of the current legislation and reach in the European Union and Italy ... 30
The ‘human factor’ as a source of major accident hazards ... 35
2.3 Advances in Education & Training in Industry: Virtual Reality and Serious Games ... 40
Computer-based training: Modeling & Simulation ... 41
Virtual Reality and Serious Games ... 42
Distributed Simulation ... 43
3 Research rationale and proposal ... 47
4 Materials and Methods ... 51
4.1 A training strategy for industrial emergency preparedness and response training ... 51
4.2 Contextual analysis: the industrial accident response protocol ... 56
4.3 Development of a training environment ... 60
A fire dynamics model based on stochastic cellular automata and particle systems ... 61
External agents: integrating a multi-agent and discrete-event based serious game logic ... 70
Internal agents: integrating a multi-agent paradigm with social force modeling ... 77
4.4 Design of a System of Systems architecture for the training system ... 88
Selection of software tools ... 88
Choosing the best standard for the distributed simulation ... 89
A Java-based Unity-AnyLogic middleware for HLA connection ... 89
Integrating fast-time and real-time simulation ... 91
A system of systems general architecture ... 92
4.5 The System Implementation ... 96
The training session facilitator interfaces ... 96
Players being introduced to the training scenario ... 101
The emergency team member: run-time interfaces and virtual experience ... 107
Training session report ... 109
4.6 The human factors assessment methodologies ... 109
The heart beat as a measure of stress ... 109
The X-NASA-TLX as a measure of the workload ... 110
Linking the stress and workload ratings to the emergency response KPIs ... 112
5 Experimental setup and case study ... 114
5.1 Participants ... 114
5.2 Selection of hardware ... 115
5.3 Experimental campaign setup ... 115
5.4 Experimental campaign conduct ... 116
5.5 Training environment configuration ... 118
6 Results and discussion ... 122
6.1 Emergency manager: mission fulfillment KPI results ... 125
6.2 Emergency manager: procedural compliance KPI results ... 135
6.3 Emergency manager: psychological stress KPI results ... 142
6.4 Emergency response team member: mission fulfillment KPI results ... 144
6.5 Emergency team member: psychological stress KPI results ... 149
6.6 Cross-sectional correlation analysis of workload, stress and KPIs ... 151
7 Final remarks ... 165
8 Related research ... 170
List of the figures
Figure 1: Industrial revolution timeline ... 19
Figure 2: Industry 4.0 key enabling technologies ... 23
Figure 3: Heatmap (a) and number (b) of MIAs in the century 1916-2016 ... 26
Figure 4: Examples of Major Industrial Accidents worldwide ... 26
Figure 5: Buncefield fire: aerial view of the disaster zone during the ongoing emergency procedures ... 27
Figure 6: Ajka disaster: aerial view of the disaster zone during the ongoing emergency procedures ... 28
Figure 7: Rana Plaza disaster: an aerial view of the disaster zone after the building collapse ... 28
Figure 8: Qingdao disaster: Chinese Army during the rescue operations ... 29
Figure 9: Prato garment factory disaster: building collapse and rescue operations ... 29
Figure 10: Map of Major Accident Hazards Industrial Sites on July 2013 (based on Decree 238/05) .... 32
Figure 11: Regional heatmap of Major Accident Hazards Industrial Sites (D.lgs.105/2015) ... 35
Figure 12: Emergency preparedness: (a) discussion sessions, (b) functional drills, (c) evacuation drills, (d) tabletop exercises, (e) full-scale exercises ... 39
Figure 13: Training Methodologies Taxonomy ... 40
Figure 14: Research study roadmap ... 49
Figure 15: Training strategy based on a Deming’s cycle ... 55
Figure 16: Industrial accident management lifecycle ... 56
Figure 17: The emergency team and the cooperation patterns ... 57
Figure 18: Industrial fire accident response protocol ... 59
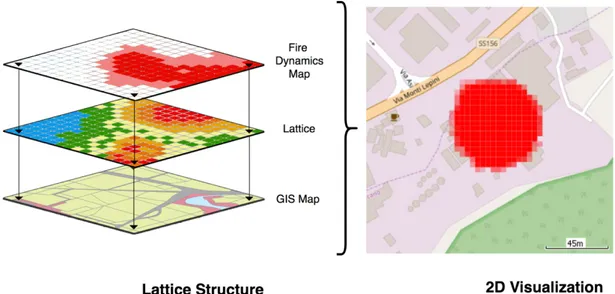
Figure 19. The layered structure of the stochastic cellular automata model ... 62
Figure 20: Example of the combustible map ... 63
Figure 21. Example of energy distribution percentages due to the wind direction ... 65
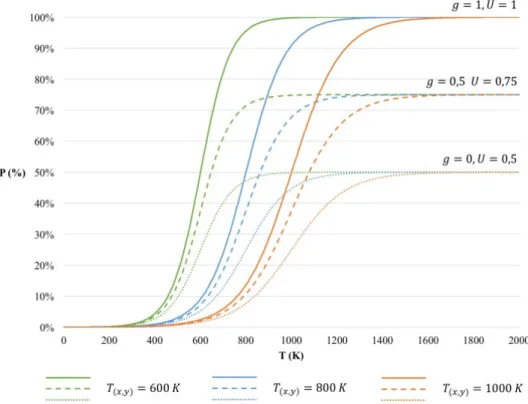
Figure 22. Ignition probability for materials with different temperatures and with different disaster's severity ... 67
Figure 23: Modeling the cell dynamics as a statechart ... 68
Figure 24: Example of flame particle system in Unity 3D ... 68
Figure 25: Using particle system technology for the fire extinguishing fluid ... 69
Figure 26: Example of flame particle system in an industrial environment ... 69
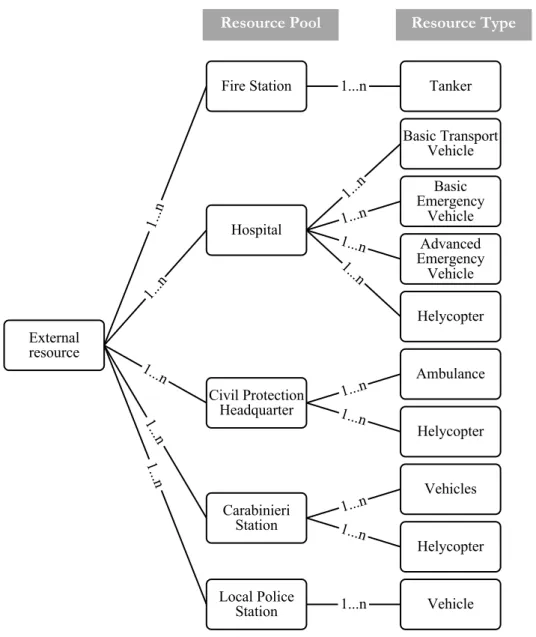
Figure 27: External resource pools and types in the training environment ... 70
Figure 28: Fire station’s resources: swim lane diagram ... 72
Figure 29: Local Police station’s resources: swim lane diagram ... 72
Figure 31: Civil Protection headquarter’s resources: swim lane diagram ... 74
Figure 32: Hospitals’ resources: swim lane diagram ... 75
Figure 33: Placing agents in the GIS environment ... 76
Figure 34: Disaster area’s zone by level of lethality ... 78
Figure 35: Distances of accident zones and potential harms of agents’ health ... 78
Figure 36: Employees and emergency response team members evacuating the facility in the virtual environment ... 82
Figure 37: How the time to execute a task changes according to the nervousness level ... 83
Figure 38: Task assignment diagram ... 84
Figure 39: Main duties of the telephone operator: a high-level flowchart ... 85
Figure 40: Main duties of the internal fire brigade member: a high-level flowchart ... 86
Figure 41: Main duties of the systems officer: a high-level flowchart ... 87
Figure 42. Unity3d-HLA middleware ... 90
Figure 43. AnyLogic-HLA middleware ... 91
Figure 44: System of systems architecture of the training solution ... 94
Figure 45: How to run the HLA-based architecture ... 95
Figure 46: The system home interface ... 98
Figure 47: Scenario Configuration: plants and external resources information and GIS Connectivity ... 99
Figure 48: Scenario configuration: disaster scenario ... 100
Figure 49. Scenario configuration: user experience and other settings ... 101
Figure 50. Warming-up the training scenario ... 102
Figure 51. Storytelling: introduction to the training scenario ... 103
Figure 52. Storytelling: training session details ... 103
Figure 53. Emergency manager’s control panel ... 106
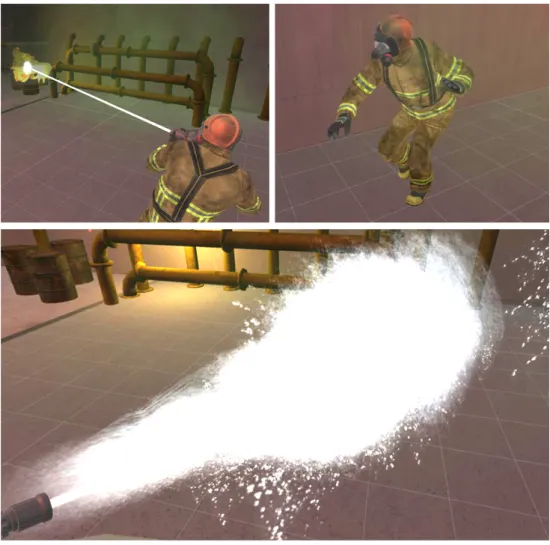
Figure 54: Immersive training sessions with gesture recognition ... 107
Figure 55. A selection of six tasks performed by the emergency team members ... 108
Figure 56: Training session final report ... 109
Figure 57: Relationships under investigation ... 112
Figure 58: Cooperation pattern among four participants over four replications of the training session ... 115
Figure 59: Players in a training session ... 116
Figure 60: Experimental campaign – pictures of the emergency managers ... 117
Figure 61: Experimental campaign – pictures of the emergency team members ... 118
Figure 63: Real-world oil tanks, pipelines and pressurized valves ... 119
Figure 64: The Buncefield conflagration ... 120
Figure 65: The Virtual Training Environment ... 120
Figure 66. Success rate of the emergency response staff over the 4 replications ... 123
Figure 67: Overall Mean Training Performance and Games-Howell Test ... 123
Figure 68: Games-Howell Test for the Emergency Managers over the 4 replications ... 125
Figure 69: Games-Howell Test for the Firefighting Officers over the 4 replications ... 125
Figure 70: Games-Howell Test for the Evacuation Officers over the 4 replications ... 125
Figure 71: Games-Howell Test for the First Aid Officers over the 4 replications ... 125
Figure 72: Games-Howell Test for the Prevention and Protection Officers over the 4 replications ... 125
Figure 73: KPI-EM1 - Interval Plot and Games-Howell Tests ... 129
Figure 74: KPI-EM2 - Interval Plot and Games-Howell Tests ... 129
Figure 75: KPI-EM3 - Interval Plot and Games-Howell Tests ... 129
Figure 76: KPI-EM4 - Interval Plot and Games-Howell Tests ... 130
Figure 77: KPI-EM5 - Interval Plot and Games-Howell Tests ... 130
Figure 78: KPI-EM6 - Interval Plot and Games-Howell Tests ... 130
Figure 79: KPI-EM7 - Interval Plot and Games-Howell Tests ... 131
Figure 80: KPI-EM8 - Interval Plot and Games-Howell Tests ... 131
Figure 81: KPI-EM9 - Interval Plot and Games-Howell Tests ... 131
Figure 82: KPI-EM10 - Interval Plot and Games-Howell Tests ... 132
Figure 83: KPI-EM11 - Interval Plot and Games-Howell Tests ... 132
Figure 84: KPI-EM12 - Interval Plot and Games-Howell Tests ... 132
Figure 85: KPI-EM13 - Interval Plot and Games-Howell Tests ... 133
Figure 86: KPI-EM14 - Interval Plot and Games-Howell Tests ... 133
Figure 87: KPI-EM15 - Interval Plot and Games-Howell Tests ... 133
Figure 88: KPI-EM16 - Interval Plot and Games-Howell Tests ... 134
Figure 89: KPI-EM17 - Interval Plot and Games-Howell Tests ... 134
Figure 90: KPI-EM18 - Interval Plot and Games-Howell Tests ... 134
Figure 91: Five most executed actions ... 135
Figure 92: Ten most assigned tasks ... 135
Figure 93: KPI-EM19 - Interval Plot and Games-Howell Tests ... 138
Figure 94: KPI-EM20 - Interval Plot and Games-Howell Tests ... 138
Figure 96: KPI-EM22 - Interval Plot and Games-Howell Tests ... 139
Figure 97: KPI-EM23 - Interval Plot and Games-Howell Tests ... 139
Figure 98: KPI-EM24 - Interval Plot and Games-Howell Tests ... 139
Figure 99: KPI-EM25 - Interval Plot and Games-Howell Tests ... 140
Figure 100: KPI-EM26 - Interval Plot and Games-Howell Tests ... 140
Figure 101: KPI-EM27 - Interval Plot and Games-Howell Tests ... 140
Figure 102: KPI-EM28 - Interval Plot and Games-Howell Tests ... 141
Figure 103: KPI-EM29 - Interval Plot and Games-Howell Tests ... 141
Figure 104: KPI-EM30 - Interval Plot and Games-Howell Tests ... 141
Figure 105: KPI-EM31 – mean and confidence intervals every 5 seconds ... 143
Figure 106: KPI-EM31 – Interval Plot and Games-Howell Tests ... 143
Figure 107: KPI-ETM0 - Interval Plot and Games-Howell Tests ... 145
Figure 108: KPI-ETM1 - Interval Plot and Games-Howell Tests ... 145
Figure 109: KPI-ETM2 - Interval Plot and Games-Howell Tests ... 145
Figure 110: KPI-ETM3 - Interval Plot and Games-Howell Tests ... 146
Figure 111: KPI-ETM4 - Interval Plot and Games-Howell Tests ... 146
Figure 112: KPI-ETM5 - Interval Plot and Games-Howell Tests ... 146
Figure 113: KPI-ETM6 - Interval Plot and Games-Howell Tests ... 147
Figure 114: KPI-ETM7 - Interval Plot and Games-Howell Tests ... 147
Figure 115: KPI-ETM8 - Interval Plot and Games-Howell Tests ... 147
Figure 116: KPI-ETM9 - Interval Plot and Games-Howell Tests ... 148
Figure 117: KPI-ETM10 – mean and confidence intervals every 5 seconds ... 150
Figure 118: KPI-ETM10 – Interval Plot and Games-Howell Tests ... 150
Figure 119: Correlation between the heart rate mean and the heart rate standard deviation with the OWJ ... 153
Figure 120: Correlation between KPI-EM0 with the OWJ ... 153
Figure 121: Correlation between KPI-EM1 with the OWJ ... 153
Figure 122: Correlation between KPI-EM3 with the OWJ ... 154
Figure 123: Correlation between KPI-EM21 with the OWJ ... 154
Figure 124: Correlation between KPI-EM6 with the OWJ ... 154
Figure 125: Correlation between KPI-EM7 with the OWJ ... 155
Figure 126: Correlation between KPI-EM25 with the OWJ ... 155
Figure 128: Correlation between KPI-EM12 with the OWJ ... 156 Figure 129: Correlation between KPI-EM15 with the OWJ ... 156 Figure 130: Correlation between KPI-EM0 and Heart Rate Mean/ Heart Rate Standard Deviation ... 157 Figure 131: Correlation between KPI-EM1 and Heart Rate Mean/ Heart Rate Standard Deviation ... 158 Figure 132: Correlation between KPI-EM3 and Heart Rate Mean/ Heart Rate Standard Deviation ... 158 Figure 133: Correlation between KPI-EM21 and Heart Rate Mean/ Heart Rate Standard Deviation . 158 Figure 134: Correlation between KPI-EM6 and Heart Rate Mean/ Heart Rate Standard Deviation ... 159 Figure 135: Correlation between KPI-EM7 and Heart Rate Mean/ Heart Rate Standard Deviation ... 159 Figure 136: Correlation between KPI-EM25 and Heart Rate Mean/ Heart Rate Standard Deviation . 159 Figure 137: Correlation between KPI-EM27 and Heart Rate Mean/ Heart Rate Standard Deviation . 160 Figure 138: Correlation between KPI-EM12 and Heart Rate Mean/ Heart Rate Standard Deviation . 160 Figure 139: Correlation between KPI-EM15 and Heart Rate Mean/ Heart Rate Standard Deviation . 160 Figure 140: Heart rate variability for an average study subject ... 161
List of the tables
Table 1: Accident databases ... 25
Table 2: Type of Major Accident Hazards Industrial Sites in Italy (D.lgs.238/05) ... 31
Table 3: Italian reported occupational accidents (source: INAIL open data) ... 33
Table 4: Italian regional distribution of Major Accident Hazards Industrial Sites (D.lgs.238/05) ... 34
Table 5: Main roles and responsibilities of emergency response team members ... 57
Table 6: Emergency response team’s training needs and objectives ... 59
Table 7. A selection of tasks of the emergency manager and expected durations ... 84
Table 8: Linguistic preference judgements ... 111
Table 9: Average Procedural Compliance Results ... 124
Table 10: KPI-EM31 – Descriptive statistics and difference of the means ... 142
Table 11: KPI-ETM10 – Descriptive statistics and difference of the means ... 149
Table 12: Correlation between Heart Rate Mean/ Heart Rate Standard Deviation and OWJ: Goodness-of-Fit of a second order polynomial regression ... 152
Table 13: Correlation between KPIs and OWJ: Goodness-of-Fit of a second order polynomial regression ... 152
Table 14: Correlation between KPIs and Heart Rate Mean/ Heart Rate Standard Deviation: Goodness-of-Fit of a second order polynomial regression ... 157
Abstract (English)
Major accident hazards industrial sites or high-risk industries lack of a dedicated training methodology and environment to enhance significantly the personnel rate of retention as well as emergency preparedness and response skills (both technical and non-technical, e.g. leadership, decision-making, team-working, stress management). The need for effective industrial emergency preparedness and response training systems is widely acknowledged also from academic communities that have invested a great deal of time and effort to detect methodologies to enhance emergency response staff performance (emergency manager and emergency team members). This study takes a step forward in current practice proposing a multiplayer industrial emergency preparedness and response training system, which leverages on Industry 4.0 enabling technologies – namely Simulation, Virtual Reality & Serious Games – and on a cooperative, experiential and differentiated training strategy. It also pushes for an increased attention on human factors in the Occupational Health and Safety 4.0 and proposes an approach to analyze the effects of human factors with the ultimate aim to include them in the design of industrial safety protocols and regulations and in the assessment of hazards. This way, after an experimental campaign and statistical analysis of the results, the proposed training system has been critically investigated to ascertain:
§ how the emergency response staff performance evolves along repeated training sessions;
§ to which extent the proposed solution is effective in delivering procedural knowledge to the emergency response staff;
§ whether it is realistic enough to think that the training experience produces psychological stress in those people that are trained with it and how they cope with stress over the repeated replications
§ whether and to which extent human factors, such as stress and perceived workload, are correlated to the capability of the emergency manager to coordinate and monitor the execution of all the measures and actions intended to deal with an industrial accident and its effects.
Abstract (Italiano)
Gli impianti industriali e, in generale, i settori industriali a rischio di incidente rilevante sono generalmente privi di un sistema per l’addestramento del personale dedicato alla gestione delle emergenze (il manager dell’emergenza e l’intero team) capace di migliorare significativamente le competenze tecniche, procedurali e trasversali (es. capacità di leadership, di decision-making, di lavorare in team e di gestire lo stress) in preparazione alle potenziali situazioni di emergenza. La necessità di sistemi efficaci a supporto dell’addestramento del suddetto staff è riconosciuta ampiamente anche dalla comunità accademica che sta investendo tempo e sforzi per definire delle metodologie efficaci. Il presente lavoro di ricerca propone un sistema multiplayer per addestrare il personale ad essere preparato e gestire un’emergenza in un sito industriale. Il sistema si basa sulle moderne tecnologie a supporto dell’Industria 4.0, come la Simulazione, la Realtà Virtuale e i Serious Games, e su una strategia di addestramento definita esperienziale, cooperativa e differenziata. Una maggiore attenzione ad aspetti legati ai fattori umani è fondamentale nell’ambito della Salute e Sicurezza sul Lavoro 4.0 ed un approccio per l’analisi degli effetti dei fattori umani è stato applicato allo scopo di includerli all’interno della fase di progettazione e definizione dei protocolli e regolamenti di sicurezza industriale o nella valutazione dei rischi. A valle dello sviluppo di tale sistema, è stata condotta una campagna di sessioni di addestramento i cui risultati sono stati analizzati statisticamente al fine di valutare:
§ come la performance dello staff sottoposto all’addestramento evolve in seguito a ripetute sessioni di training;
§ in che misura e rapidità, la soluzione proposta è capace di incrementare la conoscenza delle procedure e protocolli di emergenza da parte dello staff;
§ se un’esperienza di addestramento di questo tipo possa produrre stress psicologico (così come nella realtà) ed in che modo lo staff sottoposto alle sessioni di addestramento affronta tale stress, generato dal disastro industriale in corso, dopo ripetute sessioni;
§ se (e quanto) fattori umani come stress e carico di lavoro percepito sono correlati alla capacità del manager dell’emergenza di coordinare e monitorare l’esecuzione di tutte le azioni volte alla gestione del disastro industriale e dei suoi potenziali effetti.
1 Introduction
When dealing with complex industrial systems and organizations, what immediately emerges is that they cannot be described and modeled mathematically and their behavior is unpredictable to some extent (Dekker, 2016) mainly because (among other causes) of the dynamic interactions among a large number of elements (including systems’ reliability, human factors, environmental conditions). The industrial and societal world is also experiencing obvious and increasing conditions of risk due to major natural and man-made disasters (Liu et al., 2016) that compel to redesign the way industrial organizations prepare to cope with them. Of paramount importance to emergency response staff (managers and members of the different teams) is the question of how to prepare for as yet unseen disasters and major accidents in industrial sites. Major accident hazard industrial plants or high-risk industries typically lack a dedicated training methodology and environment to enhance significantly the personnel rate of retention and emergency preparedness technical (i.e. procedural) and non-technical (e.g. leadership, decision-making, team-working, stress management) skills during training sessions. With this in mind, the proposed research work recognizes the crucial role of training activities in implementing an effective multi-player industrial emergency preparedness and response training system, which leverages on Industry 4.0 enabling technologies – namely Simulation, Virtual Reality & Serious Games – and on a cooperative, experiential and differentiated training strategy. The system will be eventually used to ascertain (i) whether it is capable to enhance the technical and procedural emergency staff performance along repeated training sessions; (ii) whether it is realistic enough to think that the training experience produces psychological stress in those people that are trained with it and how they cope with stress over the repeated replications, and (iii) whether and to which extent human factors, such as stress and perceived workload, are correlated to the capability of the emergency manager to coordinate and monitor the execution of all the measures and actions intended to deal with an industrial accident and its effects. This study pushes therefore for an increased attention on human factors, such as stress and perceived workload, in the Occupational Health and Safety 4.0 and proposes an approach to train industrial operators and analyze the effects of human factors with the ultimate aim to include them in the design of industrial safety protocols and regulations and in the assessment of hazards.
This research has been conducted in the context of the DIEM-SSP (Disasters and Emergencies Management for Safety and Security in industrial Plants) PRIN research project (CUP: B88C13002040001), sponsored by the Italian Ministry of University and Research, whose aim is to propose new approaches to deal with and analyze the complexity resulting from emergency management in industrial plants and critical infrastructures.
The body of the present thesis is organized as follows:
• Section 2 is entitled ‘Background & State of the Art’ and provides an analysis of the current safety context in complex 4.0 industrial systems, the major accident hazards in industrial sites based on laws and regulations in force, and the latest advances in the field of education & training in industry;
• Section 3 presents the ‘Research rationale and proposal’, with details on the problem, the study aims and the roadmap of the study in the light of the analysis of the state of the art;
• Section 4 describes in detail the different methodological and implementation aspects of the proposed industrial emergency preparedness and response training system as well as the underlying mathematical models;
• Section 5 presents the case study and the setup of the experiments (i.e. training sessions) carried out with the system;
• Section 6 shows and discuss the findings related to the performance of the emergency response staff;
• final remarks, including limitations and recommendations for future works, are given in Section 7.
This thesis concludes with a brief description of some related research work carried out in parallel to the main work described in this dissertation, the reference list and the acknowledgments.
2 Background & State of the Art
This chapter provides an overview of the background and of the state of the art related to the subject of this thesis. It is structured in three main sections as follows:
§ the first section, entitled ‘The current context: the Industry 4.0‘, identifies the general application context of the thesis and current trends in the industrial domain;
§ the second section, entitled ‘Major Accident Hazards Industrial Sites‘, describes the specific application domain, highlights the reason why further research is needed in this topic and provides an overview of the current legislation;
§ the third section, entitled ‘Advances in Education & Training in Industry: Virtual Reality and Serious Games‘, provides an introduction and description of the technologies and methodologies that will be applied in the identified application domain.
The review of the state of the art and analysis of the background works has been done by using the following approach. Academic, popular and non-academic sources have been explored. More than 200 relevant papers in the field identified through title, abstracts, and keywords from interdisciplinary search engines such as SCOPUS, ISI and Google Scholar have been analyzed. Major attention has been devoted to conference papers and journal articles published in the last 10 years. Public reports from consulting companies have been also retrieved from the Internet and examined in order to identify current and future research issues as well as trends in Industry. The gaps where this research fits are generally described throughout this chapter.
2.1 The current context: the Industry 4.0
Industries are on the edge of a new revolution. The vision of a ubiquitous factory (Yoon et al., 2012) characterized by a computing technology that ‘recedes into the background of our lives’ (Weiser, 1991) is unquestionably on the forefront of technological advancements. Powerful, autonomous microcomputers (embedded systems) are increasingly being wirelessly networked with each other and with the Internet. In the industrial realm, this phenomenon can be described as the 4th Industrial
Revolution, or Industrie 4.0.
From Industry 1.0 to Industry 4.0
The first three industrial revolutions came about as a result of mechanization, electricity and Information Technology (IT) and are spanned almost 200 years (Figure 1). Industrialization began with the introduction of mechanical manufacturing equipment at the end of the 18th century, when machines like
the mechanical looms driven by steam engines revolutionized the way goods were made. Fabric production left private homes in favor of central factories followed by an extreme increase in productivity. The second industrial revolution began about 100 years later in the slaughterhouses in Cincinnati, Ohio, and found its climax with the production of the Ford Model T in the United States. The development of continuous production lines based on both division of labor and the introduction of conveyor belts resulted in another productivity explosion. Third, in 1969, Modicon presented the first programmable logic controller that enabled digital programming of automation systems. The programming paradigm still governs today’s modern automation system engineering and leads to highly flexible and efficient automation systems.
Figure 1: Industrial revolution timeline1
Nowadays, industries are on the edge of a new radical change, widely referred to as Industry 4.0. The term Industry 4.0 is today prevalent in every industry-related fair, conference or call for projects. First used under the name of Industrie 4.0 at the Hanover Fair that was held in Germany in 2011, it refers to a national strategic initiative of the German government that was adopted as part of the High-Tech Strategy 2020 Action Plan in November 2011. Its initial implementation recommendations were formulated by the Industrie 4.0 Working Group between January and October 2012 under the coordination of acatech – National Academy of Science and Engineering. The recommendations were submitted as a report (Acatech Study, 2013) to the German government at the Industry-Science Research Alliance’s Implementation Forum on 2 October 2012. The Industrie 4.0 Working Group identified 8 areas for action:
1. Standardization and reference architectures; 2. Managing complex systems;
3. A comprehensive broadband infrastructure for industry; 4. Safety and security;
5. Work organization and design;
6. Training and continuing professional development; 7. Regulatory framework;
8. Resource efficiency.
Going forward, further implementation measures will be progressed under the joint initiative Industrie 4.0 Platform, which was established by the industry’s professional associations BITKOM, VDMA and ZVEI. The report delivered by the Industrie 4.0 Platform on January 2016 (Platform Industrie 4.0, 2016) aimed at proposing an implementation plan over 20 years (from 2015 to 2035) for the actions identified by the Industrie 4.0 Working Group. This report highlights that, despite some overeager marketing messages, the 4th Industrial Revolution is still ongoing and the Industry 4.0 is still in the future as also
confirmed by Drath & Horch (2014). Most of the technical ingredients are indeed already available but they are not yet used in practice in an Industry 4.0 perspective.
Despite the variety of terms (Thoben et al., 2017), the Industry 4.0 wave identifies the same phenomenon. The current excitement for the 4th Industrial Revolution can be deemed to be the idolization of a
manufacturing intelligence embedded into physical systems, machinery, equipment, warehousing systems and production facilities spread out and networked within an industrial environment. Smart products are uniquely identifiable, may be located at all times and are aware of their own history, current status, the environment and alternative routes to achieving their target state. Autonomous machines, equipment, storage systems and production facilities able of autonomously exchanging information, triggering actions and controlling each other independently gave birth to Cyber-Physical Systems (CPS), well described in different research works (Lee et al., 2015). The embedded manufacturing systems are vertically networked with business processes within factories and enterprises and horizontally connected to dispersed value networks that can be managed in real time – from the moment an order is placed right through to outbound logistics. This way, individual customer requirements can be met and even one-off items can be manufactured profitably. The resulting Smart Factory (also called Factory of the Future) that is already beginning to appear employ this completely new approach to production.
Some clarity in a plethora of terms
Germany is not the only country to have identified the Industry 4.0 trend in manufacturing and industrial processes as strategic challenge. A variety of different terms is used around the world to describe this phenomenon, which has caused confusion rather than increasing transparency:
§ Smart Manufacturing
In response to the German government, the United States promoted an initiative known as the Smart Manufacturing Leadership Coalition (SMLC). The SMLC is comprised of 25 large global companies, 8 manufacturing consortia, 6 universities, 1 government lab and 4 high-performance computing centers. It has built on earlier National Science Foundation (NSF) funded work by 20 companies and 20 universities to develop a roadmap for Smart Manufacturing, which identifies three objectives: plant-wide optimization, sustainable production, agile supply chains. Therefore, it can be considered as a synonym of Industry 4.0.
§ Industrial Internet
At the end of 2012, US-based company General Electric (GE) publicly launched an initiative focused on the Internet of Things (IoT). GE’s Industrial Internet strategy has applications in a huge variety of different areas to realign and embed their information technology capabilities into physical equipment to offer value added services and obtain economic benefits (Agarwal & Brem, 2015). Later, an open membership organization, called Industrial Internet Consortium (IIC), founded by AT&T, Cisco, General Electric, IBM and Intel in 2014, catalyzed all the efforts to establish priorities and roadmaps regarding the development, adoption and widespread use of Industrial Internet technologies. Some argue that the main
difference between Industrial Internet, Smart Manufacturing and Industry 4.0 is the fact that the first one has a more focused scope, mainly looking at the machine and maybe the shop-floor level instead of the overall supply network (Rüßmann et al., 2015).
§ Intelligent Manufacturing
Intelligent Manufacturing is sometimes used synonymously with Smart Manufacturing. While the close collaboration of the Intelligent Manufacturing Systems organization (https://www.ims.org/) with several smart manufacturing funding agencies and research institutions support this, there is a notion that intelligent manufacturing may focus more on technological aspects and less on organizational ones. Intelligent manufacturing is a broad concept of manufacturing with the purpose of optimizing production and product transactions by making full use of advanced information and manufacturing technologies (Zhong et al., 2017). § Smart Factory
Smart Factory is a term that is focused more on the individual entity, the plant level, rather than the broader enterprise and supply network scope of Smart Manufacturing and Industry 4.0 (Lucke et al., 2008; Zuehlke, 2008; Wang et al., 2016). In this case, the smart factory paradigm relates strongly to the Industrial Internet of things (IIoT) and Cyber-Physical Systems (CPS). However, other sources refer specifically to the South Korean Smart Factory initiative, sponsored by the Korea’s Ministry of Trade, Industry and Energy (MOTIE).
§ Internet of Things/Industrial Internet of Things
While Intelligent Manufacturing and Smart Factory paradigms may be argued to be similar to Smart Manufacturing and Industry 4.0, the Internet of Things (IoT) paradigm is more ICT-oriented (Atzori et al., 2010). IoT’s vision of ubiquitous computing (Tan & Wang, 2010) is to connect the physical world with the virtual world and facilitate communication between all connected entities (Gubbi et al., 2013). In recent years, a subparadigm, the Industrial Internet of Things (IIoT) emerged, focusing on the interconnectivity of industrial assets, such as manufacturing machines, tools, and logistics operations (Da Xu et al., 2013). Overall, IoT/IIoT can be understood as an Industry 4.0 enabling technology (Mittal et al., 2016).
The Industry 4.0 key enabling technologies
In order to fully accomplish the 4th Industrial Revolution, the mutual integration of different technologies
is required (Wan et al., 2015). Kang et al. (2016) started to analyze the major key technologies related to the Industry 4.0 in the policies and technology roadmaps of Germany, United States and Korea. These technologies enabling the Industry 4.0 are being widely investigated by several reviews (Mittal et al., 2016; Oztemel & Gursev, 2018) but most of them agree on nine key enabling technologies (Figure 2):
• Big data and analytics: the collection and comprehensive evaluation of huge amount of data from many different sources – production equipment and systems as well as enterprise and
customer management systems – will become standard to support real-time decision making and explain uncertainties (Lee et al., 2014);
• Autonomous robots: more affordable robots with a greater range of capabilities will interact with one another, work safely side-by-side with humans and learn from them (Robla-Gómez et al., 2017);
• Simulation: using simulations based on real-time data and mirroring the physical world in a virtual model (like a digital twin) will allow operators to test and optimize the virtual world before the physical changeover as well as to predict the evolution of complex systems (Uhlemann et al., 2017);
• Horizontal and vertical system integration: companies, departments, systems, functions, and capabilities will become much more cohesive as data-integration networks evolve and enable automated value chains (Zhou et al., 2015);
• Cybersecurity: the increased connectivity and use of standard communications protocols that come with Industry 4.0 require secure, reliable networks as well as sophisticated identity and access management technologies to protect critical industrial systems and manufacturing lines from cybersecurity threats (Rubio et al., 2017);
• Cloud: cloud technologies can be widely used for increased data sharing across company boundaries, improved system performance and reduced costs through bringing systems online (Liu & Xu, 2017);
• Additive manufacturing: companies have just begun to adopt additive manufacturing, such as 3D printing, which they use mostly to prototype and produce small batches of customized products that offer construction advantages, such as complex, lightweight designs (Dilberoglu et al., 2017).
• Augmented reality: Augmented reality based systems support a variety of services, such as providing spatially registered information on the task directly in the user´s field of view to guide the user through unfamiliar tasks (e.g. assembly of new products), thus improving decision making and work procedures (Paelke, 2014).
The present study will pick up some of these technologies, namely simulation, virtual reality and serious games, that will be used to mirror the real world system and let workers experience a rare scenario, represented by a major industrial accident in an industrial site.
Figure 2: Industry 4.0 key enabling technologies2
Safety and training requirements in complex 4.0 industrial systems
The industrial transformation associated with the smart manufacturing revolution creates numerous challenges for organizations, technologies, and employees. Three areas for actions identified by the Industrie 4.0 Working Group will be covered by the present thesis, namely:
§ managing complex systems, § safety and security,
§ training and continuing professional development.
As illustrated in Figure 1, the complexity in production and processes has increased with each industrial revolution. Nowadays, Industry 4.0 production systems are increasing even more in complexity (Waschneck et al., 2017; Block et al., 2015). As the fourth industrial revolution or Industry 4.0 becomes the predominant reality, it will bring new paradigm shifts, which will also have an impact on the management of occupational health and safety (as highlighted in a thorough analysis by Badri et al., 2018). In the Italian Industry 4.0 framework, INAIL (Italian Institute for Insurance against Accidents at Work), and in particular DIT Laboratory 2 Machine and Work Equipment, executed research activities on machines and work equipment to analyze new technologies, such as Augmented Reality (AR) and Artificial Intelligence (AI), as well as additive technologies and collaborative robots, from a safety perspective (Di Donato, 2018). Despite safety is widely recognized as a crucial strategic organizational objective (Nenonen et al., 2015) and more restrictive safety regulations and technological innovations have been introduced (e.g. the Seveso III Directive), the nature of Smart Factories pose significant safety assurance challenges (Jaradat et al., 2017). Some of the guarantees provided by the ‘things’ (e.g. machinery, equipment, systems) are deemed as necessary in order to ensure the safety of the manufacturing processes and the resulting products. However, designers or operators of factories do not have much control over the design and evolution of the ‘things’ or cloud-based services that are increasingly being used in
2 Source: BCG Analysis. Retrieved at:
manufacturing processes. This potentially weakens confidence in the safety of the factory and can undermine the overall safety case, i.e. due to high degrees of uncertainty about the actual performance, reliability or behavior of these ‘things’. Furthermore, huge concerns can be related to potential cyber threats that can cause failure of the systems. Different management frameworks at international level have been developed to guide occupational health & safety practices as well as emergency preparedness and response in the industrial sector, including:
§ the ISO 45001:2018 specifies the requirements for management systems of occupational health and safety, whose goal is to give guidance for its use, to enable organizations to provide safe and healthy workplaces by preventing work-related injury and ill health, as well as by proactively improving its OH&S performance;
§ the ISO 14001:2015 specifies the requirements for an environmental management system that an organization can use to enhance its environmental performance. It also includes a section related to the management of the environmental impacts in case of emergencies;
§ the ISO 11320:2011 provides criteria for emergency preparedness and response to minimize consequences due to a nuclear criticality accident;
§ the ISO 15544:2000 describes objectives, functional requirements and guidelines for emergency response (ER) measures on installations used for the development of offshore hydrocarbon resources;
§ the ISO 22315:2014 provides guidelines for mass evacuation planning in terms of establishing, implementing, monitoring, evaluating, reviewing and improving preparedness. It establishes a framework for each activity in mass evacuation planning for all identified hazards. It will help organizations to develop plans that are evidence-based and that can be evaluated for their effectiveness;
§ the ISO 15544:2000 describes objectives, functional requirements and guidelines for emergency response (ER) measures on installations used for the development of offshore hydrocarbon resources.
These frameworks propose a general guide for managing accident prevention, training, emergencies and regulatory requirements specific for industrial activities. However, following the changes brought by Industry 4.0, they should be more flexible and hence better suited. For example, industry currently lacks fully standardized platforms for personnel safety training (Reniers, 2017) as well as for enhancing emergency preparedness and response capabilities. An excellent emergency preparedness and response strategies should begin with the mindset that workers are the customers of safety efforts and need to acquire knowledge – in the perspective of a continuing professional development – so that employees are confident in what they are doing.
2.2 Major Accident Hazards Industrial Sites
The industrial and societal world is experiencing obvious and increasing conditions of risk due to major natural and man-made disasters (Liu et al., 2016) that compel to redesign the way industrial organizations and communities respond and recover. In order to reduce risks, several countries have launched a number of laws and regulations for industries dealing with dangerous materials and substances or with hazardous processes. Nevertheless, accident causation analysis revealed that human errors and low preparedness are the main sources of industrial hazards. This section investigates the trend of Major Industrial Accidents (MIAs) over the last years and current European and Italian legislation on the topic for Major Accident Hazards Industrial Sites. The role of the ‘human factor’ in determining MIAs or influencing the post-disaster response and recovery is finally analyzed.
Trend and examples
A recent article by Blanton & Peksen (2017) states that one of the costs of the economic globalization starting from the World War I was an increased number of MIAs. The ‘exponential’ growth of the number of reported MIAs is confirmed by an extensive cross-analysis carried out as a preliminary step to this doctoral thesis from different accident databases (e.g. eMARS3 and FACTS4) and media reports,
reported in Table 1.
Table 1: Accident databases
Database Period Number of Incidents Geographical Area
MARS Dal 1980 ad oggi 450 EU-OECD
FACTS Dalla fine del 1970 24000 Worldwide
MHIDAS Dal 1964 ad oggi 11000 Worldwide
ERNS Dal 1987 ad oggi 275000 USA
RISCAD 1949–2006 4796 Giappone
RMP*Info Dal 1990 ad oggi 15430 USA
IRIS Dal 1990 ad oggi 605400 USA
Figure 1.a shows a heatmap where the opacity of the filling red color represents the percentage of reported MIAs occurred in the last century (1916-2016) in a given country. Figure 1.b shows instead the trend worldwide in the number of reported MIAs in the period of interest. Starting from the ‘60s, the growth of the number of reported MIAs involved mainly countries with a traditionally high industrial activity (United States, United Kingdom, China, Germany and Japan) and emerging industrial powers (e.g. India, Bangladesh). Notwithstanding, significant improvements have been made in hazard assessment and disaster prevention – even resulting from natural disasters or terrorist attacks (Lovreglio et al., 2016) – which explains the latest decreasing trend in the number of reported MIAs depicted in Figure 1.b. The number of near miss and major industrial accidents per year is however still very high in different sectors, such as in chemical plants, as confirmed by Pariyani et al. (2010).
A survey of some examples of MIAs occurred worldwide in industrial plants and facilities was useful to understand the most important commonalities and critical issues in disasters management. For a complex
3 eMARS, Major Accident Reporting System, https://emars.jrc.ec.europa.eu/en/emars/content 4 FACTS, Failure and ACcidents Technical information System, http://www.factsonline.nl/
industrial system, the incident frequency is low but consequences are serious (Venkatasubramanian, 2011). Figure 4 reports the locations of a group of MIAs occurred along the last years. It is possible to observe that disasters have occurred in almost all the five continents showing that disasters management has to be regarded as a common problem worldwide.
(a) (b)
Figure 3: Heatmap (a) and number (b) of MIAs in the century 1916-2016
Causes, consequences and characteristics of some of these MIAs are hereunder described: § Oil Storage Terminal Fire, Buncefield, England – December 11, 2005
The Buncefiled disaster is a major conflagration caused by a series of explosions at the Hertfordshire Oil Storage Terminal, an oil storage facility located in Hertfordshire, England. The terminal was the fifth largest oil-products storage depot in the United Kingdom, with a capacity of about 60 million imperial gallons (270 Ml) of fuel and was owned by TOTAL UK Limited and Chevron. The disaster caused 43 injuries and 2 serious injuries. As far as the main rescue units are concerned, the Fire department of Hertfordshire was fully involved in rescue and firefighting operation with more than 150 people. Additionally, also the United Kingdom Fire Service Search and Rescue Teams (UKFSSART) as well as the Urban Search and Rescue Teams (USAR) provided a strong help for rescue and emergency management operations. The major hospitals (Hemel Hempstead Hospital and Watford General Hospital) were involved to host the injured people coming from the disaster zone. Moreover, hundreds of homes in the Hemel Hempstead area were evacuated and about 2.000 people had to find alternative accommodation due to the large fire developed from the disaster area as showed in Figure 5.
Figure 5: Buncefield fire: aerial view of the disaster zone during the ongoing emergency procedures § Aluminum Factory Disaster, Ajka, Hungary – October 4, 2010
The Ajka alumina sludge spill was an industrial accident at a caustic waste reservoir chain of the Ajkai Timföldgyár alumina plant in Ajka, Veszprém County, in western Hungary. The plant suddenly released a huge mass of water and red mud, which stepped in the surrounding countryside as it is showed in Figure 6. It was not initially clear how the containment at the reservoir had been breached. The red mud was dangerous because of its high pH: it caused an alkaline reaction in contact with the skin, which resulted in 90 people that have been taken to the hospital with chemical burns and 4 people deceased. During the operations, the Mal (Magyar Aluminum) S.A, the National Directorate General for Disaster Management (NDGDM), Hungarian Civil Protection and Hungarian army were involved. The main involved hospitals were the Magyar Imre Hospital and the Tapolcai Hospital.
Figure 6: Ajka disaster: aerial view of the disaster zone during the ongoing emergency procedures § Savar Building Collapse, Dhaka, Bangladesh – April 24, 2013
The 2013 Savar building collapse or Rana Plaza collapse was a structural failure that occurred in the Savar Upazila of Dhaka District, Bangladesh, where an eight-story commercial building named Rana Plaza collapsed (as showed in Figure 7). The structure housed several textile factories in Bangladesh, who built clothes for Western companies. Multiple causes were identified: the building have been built on a filled in pond, which compromised structural integrity; it was converted from commercial use to industrial use; 3 floors above the original permit were added; substandard construction materials were used. The Bangladesh Garment Manufacturers and Exporters Association confirmed that 3122 workers were in the building at the time of the collapse. The disaster caused 233 victims and 700 serious injured. Rescuers immediately have saved about 2,500 people, but there were many missing. Many hours were needed to extinguish the flames and despite the fatigue and the sickening odor of decomposing bodies, rescuers continued to work for days. The hospitals involved include the Enam Medical College & Hospital, the Monorom Hospital and the Prime Hospital.
Figure 7: Rana Plaza disaster: an aerial view of the disaster zone after the building collapse § Oil pipeline explosion, Qingdao, China – November 23, 2013
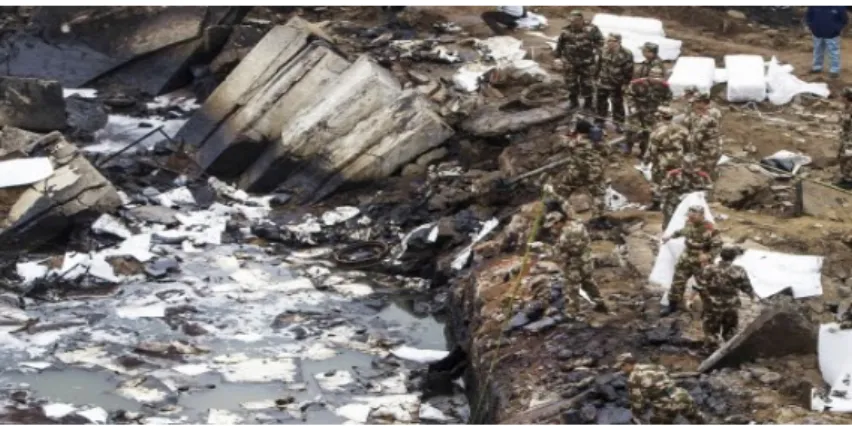
The 2013 Qingdao oil pipeline explosion occurred when several workers were trying to repair a leak in the pipes owned by Sinopec, the largest Chinese oil company, in the city of Qingdao, Shandong Province, China. The serious damage in this incident has highlighted major problems, including the location of the pipelines and the sewerage grid, and the negligent maintenance of the oil pipeline that caused the oil leak. The blast killed at least 62 people but more than 150 were injured. The emergency management was led by Firefighters Huangdao oil hub of Sinopec with an additional aid from the Chinese Army as showed in Figure 8. About 18.000 people were
evacuated from Qingdao. The following hospitals were involved to help people from disaster area: Qingdao west coast Medical Center, International Clinic of Qingdao Municipal Hospital (ICQD), ChengYang People's Hospital.
Figure 8: Qingdao disaster: Chinese Army during the rescue operations § Garment Factory Fire, Prato, Italy – December 2, 2013
A fire in December 2013 in a Chinese-owned clothing factory in the Italian town of Prato broke out in a loft of an industrial facility that was used as a dormitory. The estimated victims were 17, 7 dead and 10 seriously injured. The disaster underlined the unsafe conditions in which the workers are employed although the causes of the fire are unclear. The entities involved in the disaster management were the National Firefighters, the Health Emergency departments, the Civil Protection and Prato Gold Cross and Red Cross. The firefighters and ambulances arrived almost immediately and the rescue operations (see Figure 9) began.
Figure 9: Prato garment factory disaster: building collapse and rescue operations
The survey of the MIAs occurred in the last years was relevant to highlight the common aspects (e.g. causes, consequences, entities involved) among different accidents in different industrial areas and sectors. In general, MIAs pose a significant threat to humans and the environment, cause huge economic losses and disrupt sustainable growth. Accident causation analysis has proved to be a good way to trace industrial accident causes and, ultimately, to prevent similar accidents from happening again (Li et al, 2017). The increasing complexity of engineered social-technical systems driven by the Industry 4.0 paradigm brings greater risks that can potentially contribute to an accident. To minimize the associated risks, measures and regulations are necessary to prevent major accidents and to ensure appropriate preparedness and response.
An overview of the current legislation and reach in the European Union and Italy
In Europe, the catastrophic accident in the Italian town of Seveso in 1976 prompted the adoption of legislation on the prevention and control of major accidents. The Seveso disaster was an industrial accident that occurred on July 10, 1976, in a small chemical manufacturing plant approximately 20 kilometers north of Milan in the Lombardy region of Italy. It resulted in the highest known exposure to 2,3,7,8-tetrachlorodibenzo-p-dioxin (TCDD), a persistent environmental contaminant and carcinogen substance, in residential populations. Although several thousand people were exposed to the released chemicals, there were no human fatalities. The aftermath included the culling of animals to prevent the toxins from entering the food chain, removal and incineration of topsoil and the prohibition of farming over a wide area, which represented a significant economic impact.
The so-called Seveso Directive was adopted in 1982 as European Union Directive 82/501/EC, which aimed to harmonize the Member States' legislation on serious chemical accidents. Its primary objectives were to prevent major accidents involving dangerous substances and limit the possible consequences of such accidents for human health and the environment.
Subsequent incidents (e.g. Bhopal disaster in India and Sandoz warehouse fire in Switzerland) led to amendments to the original Seveso Directive, which was replaced in 1996 by the Seveso II Directive 96/82/EC. Whilst Seveso I targeted specific activities and included a list of dangerous substances, Seveso II introduced a classification system for dangerous substances (toxic, flammable/explosive, and dangerous for the environment) and specified threshold quantities for certain types, categories and group of categories of such substances. Based on whether the upper or lower threshold is exceeded, Seveso establishments are classified as lower tier or upper tier, with corresponding obligations.
The Seveso II Directive was adopted in Italy following the Legislative Decree No. 334 issued on August 17th,1999.
On December 2003, following lessons learned in the adoption of the Seveso I/II Directive by the Member States and further industrial accidents (e.g. fertilizer plant explosion at Toulouse, France), the scope of the Seveso II Directive was itself extended by the new Directive 2003/105/CE (c.d. Seveso II bis).
The Seveso II-bis Directive was adopted in Italy following the Legislative Decree No. 238 issued on September 21st,2005,
which modified, without major differences, the Legislative Decree No. 334/99.
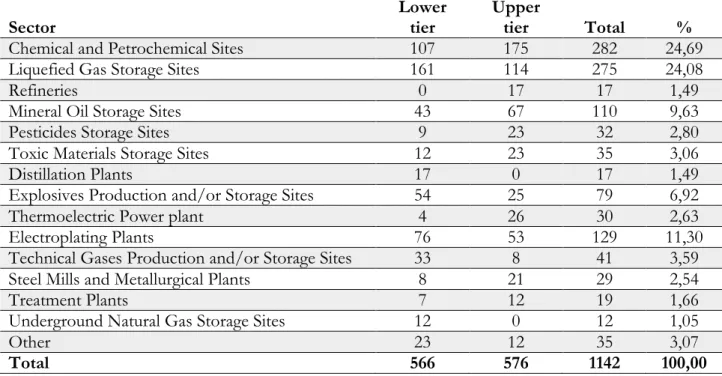
In Italy, the Italian Institute for Environmental Protection and Research, ISPRA (Istituto Superiore per la Protezione e la Ricerca Ambientale) has issued a report on July 2013, which analyzes the types of industrial sites that are included in the Legislative Decree 238/2005 (Table 2). A total amount of 1142 high-risk industrial sites have been identified, 576 of them overcoming the upper safety threshold for harmful substances. Based on this list, a map representing the distribution over the Italian territory of Major Accident Hazards Industrial Sites has been created (Figure 10), which shows a roughly uniform distribution.
Table 2: Type of Major Accident Hazards Industrial Sites in Italy (D.lgs.238/05) Sector Lower tier Upper tier Total %
Chemical and Petrochemical Sites 107 175 282 24,69
Liquefied Gas Storage Sites 161 114 275 24,08
Refineries 0 17 17 1,49
Mineral Oil Storage Sites 43 67 110 9,63
Pesticides Storage Sites 9 23 32 2,80
Toxic Materials Storage Sites 12 23 35 3,06
Distillation Plants 17 0 17 1,49
Explosives Production and/or Storage Sites 54 25 79 6,92
Thermoelectric Power plant 4 26 30 2,63
Electroplating Plants 76 53 129 11,30
Technical Gases Production and/or Storage Sites 33 8 41 3,59
Steel Mills and Metallurgical Plants 8 21 29 2,54
Treatment Plants 7 12 19 1,66
Underground Natural Gas Storage Sites 12 0 12 1,05
Other 23 12 35 3,07
Total 566 576 1142 100,00
The data analysis from the UE’s e-MARS accident database revealed a significant turnaround of the number of MIAs (although at a slower pace than expected). In addition, a new European Regulation 1272/2008 for the Globally Harmonised System for the classification, labelling and packaging of chemical substances and mixtures (CLP) has been issued on June 2015. The Seveso II Directive was based on a previous classification (the Dangerous Substances Directive 67/548/EEC), hence the requirement for change.
The Seveso III Directive 2012/18/EU aims to align Seveso legislation with the new classification scheme for chemical substances provided for by the CLP Regulation. Seveso III must be implemented by the Member States by 31 May 2015, in order to coincide with the entry into force of the CLP on June 2015.
The Seveso III Directive was adopted in Italy following the Legislative Decree No. 105 issued on June 26th,2015,
which fully repealed the previous Legislative Decrees No. 334/1999 and 238/2005.
According to the Seveso Directives, an industrial site is subjected to major accident hazards because of the presence of a certain amount (over a given threshold) of harmful substances (toxic substances, combustible materials, explosive materials, oxidizing substances, environmentally hazardous materials).
Figure 10: Map of Major Accident Hazards Industrial Sites on July 2013 (based on Decree 238/05) A Major Industrial Accident (MIA) has been then defined as an unexpected, usually sudden occurrence including, in particular, a major emission, fire or explosion, resulting from abnormal developments in the course of an industrial activity, leading to a serious danger to workers, the public or the environment, whether immediate or delayed, inside or outside the installation and involving one or more hazardous substances (Occupational Safety and Health Service, 1994). Major accidents involve the release –
instantaneous or over a relatively short period – of significant amounts of energy or of one or more hazardous materials. These accidents can affect people, property, and the environment. Human consequences can be physical (fatalities or injuries) or psychological and can affect both the employees of the establishment in which the accident occurs and the external population. The consequences on property are usually the destruction of equipment or buildings. Environmental consequences can be immediate or delayed and include the release of a hazardous material into the atmosphere, into the soil or into water. In addition, major accidents usually cause indirect losses such as loss of profits by the company involved or interruption of the business continuity (Casal, 2017). Conversely, a near miss is defined as an unplanned event that did not result in injury, illness, or damage – but had the potential to do so.
In order to prove the importance and potential reach of this thesis, the number of Major Accident Hazards industrial sites in Italy (in Italian ‘RIR – Rischio di Incidente Rilevante’) are reported. For the purpose of this analysis, the Seveso National Database5 updated at June 30th, 2018 has been used. Table
4 reports the number of plants affected by the Legislative Decree 238/2005 (updated at July 2013) and by the Legislative Decree 105/2015 (updated at June 2018), the Seveso II and Seveso III respectively. It can be noticed that the number of Major Accident Hazards Industrial Sites decreased from 1142 to 1000 but it is still relevant. Lombardia is the region with the highest percentage of interested sites (26,0%), while Valle d’Aosta, Molise and Basilicata are the regions with the lowest percentages (0,6%, 0,8% and 1,0% respectively). A complete map of the regional distribution of the Major Accident Hazards Industrial Sites according to the Legislative Decree 105/2015 is illustrated in Figure 11. According to the INAIL open data6, reported occupational accidents in the Italian industrial context are slightly increasing as
shown in Table 3.
Table 3: Italian reported occupational accidents (source: INAIL open data)
Period 2013 2014 2015 2016 2017 Gen-Nov ‘17 Gen-Nov ‘18
All 137.107 129.320 125.608 126.989 130.566 116.176 128.457
-5,68% -2,87% 1,10% 2,82% 10,57%
Fatal 369 313 408 329 369 302 325
-15,18% 30,35% -19,36% 12,16% 7,62%
The Directive is widely considered as a benchmark for industrial accident policy and has been a role model for legislation in many countries worldwide. The European Union in general counts more than 12.000 industrial establishments where dangerous substances are used or stored in large quantities, mainly in the chemical and petrochemical industry, as well as in fuel wholesale and storage (including LPG and LNG) sectors. Germany being very densely populated has, at the same time, the highest number of Seveso establishments in the EU (3,264 in 2015) followed by France, Italy and the UK.
Despite the analysis has been done only for Member States of the European Union, this paragraph gives an idea of the potential reach that this study may have also in non-European Countries (e.g. United States, South America, Japan, China) where the number of Major Accident Hazards Industrial Sites is similarly high or even higher.
5http://www.minambiente.it/pagina/inventario-nazionale-degli-stabilimenti-rischio-di-incidente-rilevante-0 6https://www.inail.it/cs/internet/attivita/dati-e-statistiche/open-data.html
Table 4: Italian regional distribution of Major Accident Hazards Industrial Sites (D.lgs.238/05)
Region/Province
D.lgs.238/2005 D.lgs.105/2015
Updated: July 2013 Updated: June 2018
Lower tier Upper tier Total Lower tier Upper tier Total Abruzzo 16 10 26 12 10 22 Basilicata 4 5 9 3 7 10 Calabria 10 7 17 10 7 17 Campania 52 18 70 53 21 74 Emilia Romagna 36 63 99 32 52 84
Friuli Venezia Giulia 14 20 34 11 15 26
Lazio 33 36 69 28 31 59 Liguria 10 24 34 10 21 31 Lombardia 131 156 287 122 138 260 Marche 9 7 16 7 7 14 Molise 3 5 8 2 6 8 Piemonte 50 53 103 36 43 79 Puglia 23 20 43 16 16 32 Sardegna 14 28 42 10 28 38 Sicilia 37 34 71 31 33 64 Toscana 32 30 62 29 26 55
Trentino Alto Adige -
Bolzano 5 2 7 5 1 6
Trentino Alto Adige - Trento 6 4 10 5 3 8
Umbria 12 5 17 11 5 16
Valle d’Aosta 5 1 6 5 1 6
Veneto 52 60 112 42 49 91
Figure 11: Regional heatmap of Major Accident Hazards Industrial Sites (D.lgs.105/2015)
The ‘human factor’ as a source of major accident hazards
Living with the risk in industry is as of today unavoidable (Ale, 2005). Despite the quickening pace of technological advances and the greater emphasis on the design of safe systems have drastically reduced the risks (Woods et al., 2010), the corporate quest for zero accidents in highly automated industrial sites
is still plainly utopian (Twaalfhoven & Kortleven, 2016). In recent years, considerable effort has been devoted to tackle the technological aspects of intervention strategies and plans for preventing and/or handling high-risk emergencies in complex industrial systems, such as nuclear and petrochemical industries. Besides the systems failure in itself, recent literature on accident causation analysis also recognizes the ‘human factor’ as one of the main sources (or even the most important) of industrial hazards (Li et al., 2017). Despite some authors think that ‘human error’ is only a factor eclipsing real causes (Alonso & Broadribb, 2018), the uncertainty and unpredictability of the scenario evolution mainly affect emotivity/stress and perceived workload, which are among the major human factors influencing performance (Di Domenico & Nussbaum, 2011) and safety behaviour (Wang et al., 2018). It is undeniable that accidents such as the Macondo Well Blowout are due to complete human errors, such as poor leadership abilities (Pranesh et al., 2017). In their observation of MIAs, Moura et al. (2017) also show that seemingly unforeseen scenarios involving complex interactions between human factors, technologies and organizations, are capable of triggering major catastrophes. Vinnem (2011) provides instead an overview of human and organizational errors and technical faults in some well-known offshore major accidents. Since the concepts of man-machine-media (environment) model was first proposed by Wright, the human factor has had a profound effect on accident analysis and prevention (Miller, 1991). Some researchers proposed variations of this model, such as the ‘‘5M’ (i.e. Man, Machine, Method, Material, and Money) model, to evaluate the impact of human, process and technology factors on system failure (Irani et al., 2001). Other authors have noticed that the human factor, rather than existing plans, the management of resources, or the uncertainty of the situation, is often a major source of vulnerability in the decision-making process (Pearson et al., 1997; Smith & Dowell, 2000, Weisæth et al., 2002). Nevertheless, little attention has been generally devoted to the development of decision support aids and training programs to enable the human operator to perform effectively.
Hazard assessments in industry generally neglect the impact of human behavior (Lovreglio et al., 2016). Human factors can no longer be disregarded in the light of the rise of Industry 4.0 paradigm, which is turning technology-driven plants into human-centered industrial systems. The role of ergonomics and human factors research is gaining more and more relevance in the field of Occupational Health & Safety for the Industry 4.0 (Siemieniuch et al., 2015). This is especially true in critical and challenging operations, such as an industrial emergency due to a major accident. Engineers and designers of advanced manufacturing systems often overlook human factors, which conversely may help to reduce risks of major accidents (Ciavarelli, 2016). Some industries, such as aviation, have started to use crew resource management (CRM) tools to reduce human error and, consequently, major accident hazards. They focus on non-technical skills, which deal with psychological and organizational conditions rather than technical knowledge. The interactions among major assets in modern industry 4.0 (real-time communication, Big Data, human–machine cooperation, remote sensing, monitoring and process control, autonomous equipment and interconnectivity) underlie several types of workplace hazards, in particular those in the psychosocial category (Leka & Jain, 2010). This more central role of the human worker requires a deeper understanding of which are the cognitive, physical and psychological aspects, mostly neglected in the literature, that affect the staff behavior and performance in case of an industrial emergency.
Despite awareness and concern about the human factor in industrial disasters had grown considerably over the past years (Granot, 1998), attention has been mainly focused on the human factor in causing such industrial disasters rather than analyzing which outcomes of an MIA are affected by human factors and people’s behavior during a disaster. Depending on the role and capability of every individual to cope with a stressful and complex emergency scenario, the consequences and outcomes of an industrial accident can change.