POLITECNICO DI MILANO
Scuola di Ingegneria Industriale e dell’Informazione
Corso di Laurea Magistrale in Ingegneria Energetica
Anno Accademico 2015/2016
ACCESS TO ENERGY IN RURAL TANZANIA: ELECTRICAL LOAD CURVES EVALUATION AND ENERGY DEMAND ASSESSMENT OF 13 VILLAGES IN NJOMBE
REGION
Relatore:
Prof. Emanuela COLOMBO
Co-relatori: Ing. Fabio RIVA
Dott. Jacopo PENDEZZA
Tesi di Laurea di:
III
Acknowledgements
Il primo pensiero va ai miei genitori che mi hanno appoggiato nella scelta di frequentare gli ultimi anni di studio a Milano.
Ringrazio poi Emanuela per avermi avvicinato al mondo della cooperazione e dato la possibilità di vivere un’esperienza unica in Tanzania.
Grazie Fabio per il prezioso tempo che mi hai dedicato con grande pazienza e impegno durante tutto il lavoro.
Grazie Fabrizio per il fondamentale aiuto nel lavoro e per la compagnia durante l'esperienza vissuta assieme in Africa.
Un ringraziamento a tutto il gruppo CEFA e in particolare a Jacopo per la collaborazione e la sua disponibilità e per averci accolto con grande ospitalità. Grazie Stefano e Matteo per avermi aiutato ad ambientarmi in una realtà completamente diversa e per avermi fatto conoscere e scoprire molto della cultura Tanzaniana.
Grazie Flavian e Evanton per il vostro importante aiuto durante le interviste nei villaggi, senza di voi sarebbe stato impossibile.
Infine un grazie a Stela e Prisca per avermi fatto scoprire ed apprezzare la cucina tipica Tanzaniana. Asante sana!
IV
Table of Contents
Acknowledgements ... III Table of Contents ... IV List of figures ... VII List of tables ...IX Abbreviation Index ...XI Nomenclature ... XII Abstract ... XIII Sommario ... XV Introduction ... XVII
1 Access to energy ... 20
1.1 Overview of access to modern energy in the world ...20
1.2 The problem of access to modern energy...21
1.3 Access to modern energy in Sub Saharan Africa ...23
1.4 Access to energy in rural areas in Tanzania ...26
1.4.1 General description ... 26
1.4.2 Energy situation of Tanzania ... 28
1.4.3 Problem of overuse of biomass in Tanzania ... 29
1.4.4 Problem of access to electricity in Tanzania ... 31
1.4.5 Rural areas in Tanzania ... 32
1.4.6 Providing access to electricity in rural area in Tanzania ... 34
V
2 Background ... 38
2.1 CEFA Onlus ...38
2.1.1 CEFA NGO general description ... 38
2.1.2 CEFA’s rural electrification projects in Tanzania ... 40
2.2 Ninga SHPP: CEFA’s last electrification project ...46
2.2.1 Location of the plant... 46
2.2.2 Climate and rainfall trend in Njombe Region ... 48
2.2.3 Technical features and energy production evaluation ... 49
3 Load Curve Estimation and Primary Energy Assessment ... 53
3.1 Purposes of the thesis ...53
3.2 Summary of activities ...54
3.3 Study area...55
3.4 Surveys ...56
3.4.1 Questionnaires addressed to Electrified Villages ... 56
3.4.2 Questionnaires addressed to Not Electrified Villages ... 57
3.4.3 Open Data Kit ... 58
3.4.4 Fieldwork 1: interviews in Electrified Villages ... 61
3.4.5 Fieldwork 2: interviews in Not Electrified Villages ... 64
3.5 Future Load Demand Estimation ...68
3.5.1 Novel methodology for Load Demand Estimation ... 68
3.5.2 LoadProGen input data... 69
3.6 Energy Demand Assessment ...72
3.6.1 Questionnaire for energy sources assessment in Non-Electrified Villages . 72 3.6.2 Electricity consumption ... 73
VI 3.6.4 Charcoal consumption ... 79 3.6.5 Kerosene consumption ... 81 3.6.6 Diesel consumption ... 82 3.6.7 Petrol consumption ... 83 4 Results... 85
4.1 Future Load Demand Estimation results ...85
4.1.1 Scenario 50% ... 85
4.1.2 Scenario30% and Scenario70% ... 88
4.1.3 Comparison between ENCO and LoadProGen load curve estimation ... 89
4.2 Energy demand assessment results ...94
4.2.1 Households primary energy consumption ... 95
4.2.2 Public Services energy consumption ... 98
4.2.3 Productive Uses energy consumptions ... 102
4.2.4 Total energy consumption in the 13 Villages ... 108
Conclusions ... 110
Appendix A ... 113
Appendix B ... 117
Appendix C ... 122
VII
List of figures
Figure 1-1 Population and share of population without access to electricity by
country [5] ... 24
Figure 1-2 Three stone stoves in Ninga village ... 25
Figure 1-3 Tanzania flag and location ... 27
Figure 1-4 - Share of total final energy Consumption in Tanzania ... 28
Figure 1-5 Women and children sitting around an open fire in a wooden kitchen ... 30
Figure 1-6 Access to electricity to national grid by region (Source [12])... 32
Figure 1-7 Photo of Ikondo village in Njombe region ... 33
Figure 1-8 Share of power generation by fuel in Tanzania (Source [9])... 36
Figure 2-1 Photo with CEFA’s electrification projects team... 39
Figure 2-2 Reservoir micro hydropower plant of Matembwe ... 40
Figure 2-3 Reservoir micro hydro plant of Bomalang’ombe ... 42
Figure 2-4 Run-of-the-river micro hydro plant of Ikondo... 43
Figure 2-5 Run-of-the-river micro hydro plant upgraded in Ikondo ... 45
Figure 2-6 River basins of Tanzania (left); project site (right) ... 46
Figure 2-7 Kilombero River tributary basin and South Ruaha River ... 47
Figure 2-8 Mean monthly rainfall in the study area [mm] ... 48
Figure 2-9 Location of the 13 villages (colour blue) and Ninga S.H.P.P. [19] 51 Figure 3-1 View from satellite of the study area where the villages are located [20] ... 55
Figure 3-2 ODK-Build online form screen view ... 58
Figure 3-3 ODK-Aggregate online desktop screen view ... 60
Figure 3-4 Google Earth view of the 13 villages of the study area ... 62
VIII Figure 3-6 The amount of wood-stock consumed per week in a house in Lole
village (left); a typical mud stove used by some households in Ninga (right) .... 77
Figure 3-7 Typical charcoal stove for cooking or water heating purposes ... 80
Figure 3-8 Typical Kerosene lamp for lighting purpose ... 81
Figure 3-9 Cutting Wood machine fueled by Diesel engine (left); Diesel Engine technical features (right) ... 82
Figure 3-10 Motorbike seldom own by HH (left); Air compressor used by garage (right) ... 84
Figure 4-1 Load curve of the thirteen villages: Scenario_50% ... 86
Figure 4-2 Load curves for the three different Scenarios ... 88
Figure 4-3 Comparison between ENCO and LoadProGen load curve ... 90
Figure 4-4 ENCO load curve estimation method (source[19]) ... 92
Figure 4-5 Monthly electric capacity of SHPP [kW] ... 93
Figure 4-6 Typical house in rural villages ... 96
Figure 4-7 Share of daily energy consumption for Households... 97
Figure 4-8 Share of Total energy consumption for “PB” of the villages ... 101
Figure 4-9 Share of total energy consumption for “Productive Usages” ... 107
IX
List of tables
Table 1-1 Access to electricity in the world ... 21
Table 1-2 Population relying on traditional use of biomass ... 22
Table 1-3 Power generation capacity in Tanzania in 2015 (Source[9]) ... 29
Table 1-4 Access to electricity in Africa and Tanzania in 2015 ... 31
Table 1-5 Off Grid Systems Matrix for rural electrification systems in DCs (Source[13]) ... 34
Table 2-1 Characteristics of Small Hydro plant in Matembwe (Source [16],[17]) ... 41
Table 2-2 Characteristics of the small hydro power plant in Bomalang’ombe [16], [17] ... 42
Table 2-3 Characteristics of Small Hydro plant in Ikondo [16] ... 44
Table 2-4 Characteristics of the upgraded Small Hydro plant in Ikondo [16] ... 45
Table 2-5 Technical features of the proposed power plant ... 49
Table 2-6 Technical characteristics of Francis turbines [18] ... 50
Table 2-7 SHPP monthly energy production [18]... 52
Table 3-1 Number of interviewed in Electrified Villages ... 62
Table 3-2 Number of interviewed in Not Electrified Villages ... 65
Table 3-3 Population and number of Household in the villages ... 66
Table 3-4 Number of Users within each User Class for Public Services ... 66
Table 3-5 Number of Users within each User Class for Productive Usages ... 67
Table 3-6 Example of Input Data for the User Class “Carpentry” ... 71
Table 3-7 Example of calculation of mean values within the User Class “Hair Cutter” ... 73
Table 3-8 Data collected for the Electricity consumption calculation for the User Class “Hair Cutter” ... 74
X Table 3-10 The four size of Wooden Logs chosen for Wood consumption
estimation method ... 78
Table 3-11 Example of Wood consumption assessment of Household ... 78
Table 3-12 Charcoal use and consumption ... 80
Table 3-13 Kerosene use and consumption ... 81
Table 3-14 Diesel use and consumption ... 83
Table 3-15 Petrol use and consumption ... 84
Table 4-1 Monthly and yearly energy produced and excess of energy [MWh] for the two conducted studies. ... 91
Table 4-2 Number of Users interviewed in selected villages ... 94
Table 4-3 Lower heating value and density of primary energy sources [25] .... 95
Table 4-4 Households primary energy consumption ... 96
Table 4-5 Secondary School in Ikondo village ... 98
Table 4-6 Public office in the village Mahongole... 99
Table 4-7 Dispensary in the village of Ninga ... 100
Table 4-8 Church in Matembwe village ... 100
Table 4-9 Milling machine and its owner in Mahongole ... 102
Table 4-10 Circular saw powered by a diesel engine ... 103
Table 4-11 Shop in the village of Lole ... 104
Table 4-12 Hair cutter with home-based solar panel system ... 104
Table 4-13 Guest House in the village of Mahongole ... 105
Table 4-14 Air compressor fuelled by Petrol ... 105
XI
Abbreviation Index
DIT Dar Es Salaam Institute of Technology
HH Households
PB Public Services
ADC Average Daily Consumption
DIT Dar Es Salaam Institute of Technology
HH Households
PB Public Services
US Productive Usages
EE Electrified
NonEE Non Electrified
NGO Non-Government Organization LPG Liquefied Petroleum Gas
LHV Lower Heating Value
ODK Open Data Kit TSH Tanzanian Shillings
XII
Nomenclature
δ Density W Watt P Power Ec ElectricityXIII
Abstract
This study arises from a request for collaboration with CEFA to the Department of Energy of Politecnico di Milano. CEFA is a Non-Government Organization who is working on its latest rural electrification project for the installation of a small hydro power plant in order to bring access to electricity to 13 rural villages in Njombe region, in Tanzania.
The purpose of this work, which included a mission of one month and half, consisted in carrying out an assessment of energy needs and consumptions of the 13 non electrified villages.
The first goal of this thesis was to estimate the future electrical energy demand of the villages when CEFA electrification project will be completed. The goal was achieved by using a novel methodology implemented in a software for estimating electrical load curve in rural contexts developed by the Department of Energy at Politecnico di Milano. The second goal consisted in evaluating primary energy consumptions of the villages. After collecting data about energy consumption for each source used, data collected was reorganized and processed and final energy consumptions for each source were calculated.
Results of the future load curve estimations show that a study based on collecting data on site and using a software for the load profiles generation in rural contexts may lead to considerably different results than an estimation based on hypothesis and information from literature studies of similar rural contexts.
Results of the energy demand assessment demonstrate that the energy balance of the villages is characterized by a strong dependence on biomass source, typical of rural areas in developing countries. Indeed, results show that more than 80% of primary energy demand of the villages is met by firewood and charcoal. The overuse of biomass inevitably leads to the problems of smoke inhalation and deforestation.
XIV In conclusion, results of this thesis may be useful for CEFA to achieve an optimal technical-economical design and implementation of its electrification project and for possible future interventions aimed at reducing the dependence on traditional and fossil primary fuels within the study area.
keywords: access to energy; rural electrification; load curve estimation; primary
XV
Sommario
Questo studio nasce dalla collaborazione tra il dipartimento di energia del politecnico di Milano e CEFA, Organizzazione Non-Governativa che sta lavorando ad un progetto di elettrificazione rurale (chiamato progetto Ninga-SHPP) per la realizzazione di un impianto mini idroelettrico con lo scopo di portare accesso all’energia elettrica in 13 villaggi rurali nella regione di Njombe in Tanzania.
Lo scopo di questo lavoro, che ha previsto una missione nella regione di Njombe della durata di un mese e mezzo, è stato quello di effettuare uno studio su consumi e bisogni energetici dei 13 villaggi non elettrificati
Il primo obiettivo è stato quello di stimare la domanda futura di energia elettrica dei villaggi nel momento in cui il progetto di elettrificazione di CEFA sarà completato ed è stato raggiunto utilizzando una metodologia implementata in un software per la stima di curve di carico in contesti rurali sviluppato dal Dipartimento di Energia del Politecnico di Milano. Il secondo obiettivo è stato la valutazione dei consumi energetici attuali nei suddetti villaggi. Dopo una raccolta dati sui consumi di ciascuna fonte di energia primaria utilizzata, i dati raccolti sono stati organizzati e elaborati e i consumi finali per ciascuna fonte primaria di energia sono stati calcolati.
I risultati della stima della domanda elettrica futura dei villaggi mostrano come uno studio basato su una raccolta dati in loco e l’utilizzo di un software apposito per la stima di curve di carico in contesti rurali possa portare a risultati molto differenti rispetto ad una stima effettuata sulla base di ipotesi e informazioni dalla letteratura corrente di contesti simili. I risultati della valutazione della domanda di energia primaria dei villaggi confermano la condizione di forte dipendenza da biomassa tipica dei villaggi rurali dei paesi in via di sviluppo. I risultati mostrano infatti che più dell’80% della domanda di energia primaria dei villaggi viene
XVI soddisfatta dal legname e da carbonella. Il sovra consumo di biomassa in queste aree porta inevitabilmente a problemi di intossicazione da fumi colpendo soprattutto donne e bambini e al problema della deforestazione.
In conclusione i risultati di questa tesi saranno utilizzati da CEFA per una realizzazione ottimale del suo progetto e per futuri interventi volti a ridurre la dipendenza da combustibili fossili e tradizionali nell’area di studio.
parole chiave: accesso all’energia; elettrificazione rurale; stima curva di carico;
XVII
Introduction
In recent years the problem of access to energy and in particular access to electricity has become more and more relevant in the eyes of the international community. The nexus between access to energy and sustainable development is now obvious, but the problem is still far to be solved. Due to the importance and urgency of the problem, in the last few years the number of local and international agencies operating to bring access to modern energy in developing countries is quickly increasing. One of these agencies is CEFA, an Italian Non-Government Organization operating for sustainable development in poor countries. In recent years it has successfully carried out important projects in the rural electrification sector by the realization of small hydropower plants in Tanzania.
In particular CEFA has recently carried out a feasibility study for a possible small hydro power plant situated in the region of Njombe, Tanzania. This new important project is called “Ninga-SHPP” and consists of a 6 MW small hydro power plant that will provide access to electricity to 13 rural villages and will produce an excess of electricity that can be sold to the national electric grid operator TANESCO. The need for a detailed in-depth study on the energy situation of the villages has led CEFA to request a collaboration with the Energy Department of Politecnico di Milano. The final goal of the Mission in Tanzania is carried out a study about energy usages and consumptions in the 13 villages of the Ninga project so that the results obtained will be useful for CEFA in order to carried out an optimum technical-economic system design of the power plant and to understand the possible future interventions in the energetic field in the area. The first goal of this thesis consists of estimating the future load curve profile of the 13 non electrified villages that will be electrified by the connection to a mini grid powered by the NINGA hydro power plant. In other words, the purpose is to evaluate how much electricity the 13 villages are going to demand on a daily basis
XVIII when they will have access to affordable and reliable electricity. The second goal of this thesis consists of assessing the primary energy demand of the villages in order to provide a snapshot of the current primary energy consumptions.
In order to achieve the first goal, surveys about use and usage habits of electric appliances are administered in selected villages and a novel methodology for load curve estimation implemented in a software called LoadProGen is used. In order to achieve the second goal, surveys about primary energy consumptions of the 13 villages are administered, data collected are organized, arranged and results briefly analyzed.
In Chapter 1, an overview of access to energy is carried out, with a particular attention to the theme of access to electricity in rural areas. Then the energy situation in Tanzania is described and the possible solution to bring electricity in rural contexts are briefly shown. Finally, the hydro power source and potential in Tanzania is described. In Chapter 2, the NGO CEFA is described and its successfully completed electrification projects in Tanzania are shown. Then the technical analysis of the SHPP project of Ninga is described in detail. In Chapter 3, the two goals of the mission are introduced. Firstly, a brief summary of the activities carried out during the entire period spent in Tanzania are listed and the study area is described. Then questionnaires administered during the period spent in the villages are described and the tool used to administer them and to collected data is briefly presented. Finally, the novel methodology and the software used to evaluate the future load curve and the methodology used to carry out the primary energy demand assessment of the village are explained in detail. In Chapter 4, results are shown and a brief analysis of them is carried out.
20
1 Access to energy
1.1 Overview of access to modern energy in the world
Access to modern energy is a fundamental prerequisite to trigger and ensure a sustainable development and to fight poverty in developing country. Modern forms of energy are essential for the provision of clean water, sanitation and healthcare and provide great benefits to development through the supply of reliable and efficient lighting, heating, cooking, mechanical power, transport and telecommunication services [1]. Indeed, sustainable energy is a basic condition to allow access to services, resources and public goods and it is indispensable for human and social progress, along with environment conservation.
At the United Nations Sustainable Development Summit on 25 September 2015, world leaders adopted the 2030 Agenda for Sustainable Development, which includes a set of 17 Sustainable Development Goals (SDGs) to end poverty, fight inequality and injustice, tackle climate change and ensure a sustainable development and global prosperity by 2030 [2].The 7th Development Goal set, “Affordable and clean energy for all”, underlines the importance of energy access as pre-requisite for meeting the challenges posed by the other SDGs and demonstrates a three-dimensional power of sustainable energy in enabling economic, social and environmental sectors. From the economic point of view an adequate energy provision has become essential for economic development since the time of industrial revolution. Indeed, reliable energy services are essential to allow and attract investments in the industry, transport, services and all economy sectors. The second dimension concerns the environment: the production, distribution and consumption of energy have severe environmental implications. Therefore, a wide spread use of modern and renewable energy sources can open a path towards the reduction of pollutant emission, land degradation and massive deforestation. Finally, the social dimension: energy is vital for alleviating poverty,
21 improving human welfare and raising living standards. Modern services allow major enhancements in education and health otherwise impossible, ensuring social inclusion and supporting gender equity.
1.2
The problem of access to modern energy
There are two main problems concerning energy access in the world today: access to electric energy along with energy affordability and reliability and inefficient use of traditional biomass for cooking and space heating.
The increasing attention given by the international community during the last years, has led to a number of activities and projects for fighting against these problems but despite of this as indicated in the World Energy Outlook 2015 by the International Energy Agency (IEA) [3], problem in access to energy in the world has still a very big size.
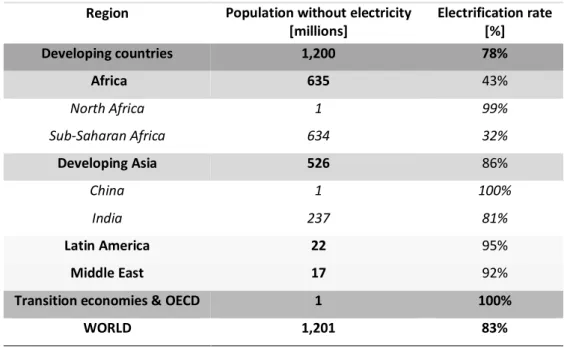
Table 1-1 Access to electricity in the world Region Population without electricity
[millions] Electrification rate [%] Developing countries 1,200 78% Africa 635 43% North Africa 1 99% Sub-Saharan Africa 634 32% Developing Asia 526 86% China 1 100% India 237 81% Latin America 22 95% Middle East 17 92%
Transition economies & OECD 1 100%
WORLD 1,201 83%
22 As shown in Table 1-1 about 1.2 billion people - 17% of the global population – did not have access to electricity in 2013, 84 million fewer than in the previous year. Still, 1.0 billion people are connected with unreliable electric grid and suffer from poor quality electricity supply. More than 95% of those living without electricity live in sub-Saharan Africa and developing Asia, predominantly in rural areas (around 80% of the world total). While still far from complete, progress in providing electrification in urban areas has outpaced that in rural areas two to one since 2000. [3]
Table 1-2 Population relying on traditional use of biomass Region Population
relying on traditional use of biomass
[millions]
Percentage of population relying on traditional use
of biomass [%] Developing countries 2,722 50% Africa 754 68% North Africa 1 0% Sub-Saharan Africa 753 80% Developing Asia 1,895 51% China 450 33% India 841 67% Latin America 65 14% Brazil 8 4% Middle East 8 4% WORLD 2,722 38%
(SOURCE: IEA, World Energy Outlook 2015)
Regarding access to modern energy for cooking and space heating as shown in Table 1-2 in 2015, more than 2.7 billion people – 38% of the world’s population – are estimated to have relied on the traditional use of solid biomass for cooking, typically using inefficient stoves in poorly ventilated spaces. It increases indoor
23 air pollution and growth of premature deaths. Developing Asia and sub-Saharan Africa once again dominate the global totals. While the number of people relying on biomass is larger in developing Asia than in sub-Saharan Africa, their share of the population is lower: 50% in developing Asia, compared with 80% in sub-Saharan Africa. Overall, nearly three-quarters of the global population living without clean cooking facilities (around 2 billion people) live in just ten countries.
1.3 Access to modern energy in Sub Saharan Africa
Africa’s energy sector is fundamental for the future development of the continent and yet remains one of the most poorly understood regions within the global energy system. Despite the fact the continent has energy resources more than sufficient to meet domestic needs, more than two-thirds of its population does not have access to modern energy [4].
Regarding access to electricity Africa accounts for about 915 million people and has more people living without access to electricity than any other world region – more than 620 million people, and nearly half of the global total -.
Thanks to efforts to promote electrification in the last years many people got access to electricity in Africa: about 145 million people gained access to electricity since 2000, led by Nigeria, Ethiopia, South Africa, Ghana, Cameroon and Mozambique.
Overall, the electricity access rate in Sub-Saharan Africa has improved from 23% in 1990 to 32% in 2015 [3]. But as African population is growing really fast, the energy sector of Sub-Saharan Africa is not yet able to meet the needs and aspirations of its citizens so that the total number without access is growing up. In addition those who do have access to modern energy face very high prices for a supply that is both insufficient and unreliable because of an under-developed system that is not able to meet their needs [4].
24 Figure 1-1 Population and share of population without access to electricity by
country [5]
Insufficient and unreliable power supply has a large impact on the productivity of African businesses. On average, around 5% of annual sales are estimated to be lost due to electrical outages [6]. Poor quality grid-based supply reduces utility revenues (non-payment) and makes it more difficult to increase tariffs, thereby constraining the availability of finance for investment. In addition, the use of back-up power generation to mitigate poor grid-based supply increases strongly costs for businesses.
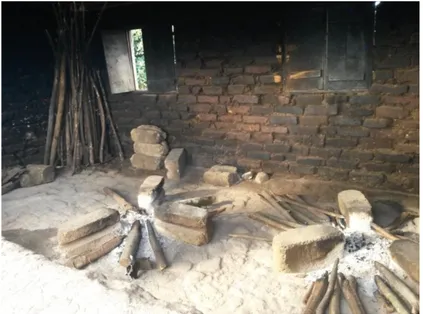
25 Regarding the second problem concerning access to modern energy in Africa, nearly 730 million people rely on the traditional use of solid biomass for cooking typically with inefficient stoves (Figure 1-2) in poorly ventilated spaces. This reliance affects women and children severely: 4.3 million children in the world die prematurely each year, of which nearly 600000 live in Africa. It can be attributed to household air pollution resulting from the traditional use of solid fuels, such as firewood and charcoal and traditional cooking stoves.
Figure 1-2 Three stone stoves in Ninga village
Around 80% of residential energy demand in sub-Saharan Africa is for cooking compared with around 5% in Organization for Economic Co-operation and Development countries (OECD). This is due, mainly, to households prioritizing energy for cooking and lighting and the low efficient of the cook-stoves used (typically 10-15% efficiency for a three-stone fire, compared to 55% for an LPG cook-stove).
Five countries – Nigeria, Ethiopia, DR Congo, Tanzania and Kenya – account for around half of the Sub-Saharan population using solid biomass for cooking.
26 Although this seem to suggest that this situation is concentrated in just a few countries, the reality is very different. In 42 countries, more than half of the population relies on solid biomass for cooking needs and in 23 of these the share is above 90%. Nearly three-quarters of those dependent on solid biomass for cooking live in rural areas and often devote hours of each day to collect firewood [1]. While this issue is often given les attention that that of electricity access, several countries have implemented programs to promote clean cooking fuels and stoves. Unfortunately, a transition to cleaner cooking fuels and appliances is not straightforward, as people who have access to modern fuels, such as LPG, natural gas, biogas or electricity, may also continue to use solid biomass for cultural or affordability reasons, a phenomenon also known as “fuel stacking”.
1.4 Access to energy in rural areas in Tanzania
1.4.1 General description
The United Republic of Tanzania was created as the union between Tanganyika and Zanzibar on 26 April 1964. It has 30 administrative regions, of which 25 are on mainland (Tanganyika) and 5 on the Island (Zanzibar). Tanzania is one of the most peaceful and politically stable countries in Africa. Indeed, the country has never experienced a civil war since independence in 1961. The Tanzanian population continues to live in peace with a sense of a common national identity.
27 Figure 1-3 Tanzania flag and location
Tanzania is located in East Africa and borders Kenya and Uganda in the north; the Democratic Republic of Congo, Burundi and Rwanda in the west; Zambia, Malawi and Mozambique in the south and the Indian Ocean in the east. It has a total area of 945,749 Km2 with a population of 44.9 million people, and a population growth rate of 3,2% per annum [6]. The literacy rate is about 74% and 84% for female and male, respectively, while life expectancy is 63.5 years for males and 66.4 years for females. Since 1996, the official capital of Tanzania has been Dodoma but the biggest and most important city of the country is Dar-Es-Salaam, and the official languages are Swahili and English. The economy of the country heavily depends on agriculture, which accounts for 42.5% of GDP, provides 70% of exports, and employs about 75% of the workforce. Industry accounts for 18.9% of GDP and is mainly limited to processing agricultural products and light consumer goods [6]. The services sector (tourism, transport, energy and mining) accounts for 38.6%. The real GDP growth rate is about 7% (2015), current GDP is about US $44.895 billion and annual GDP per capita is 865 USD.
28
1.4.2 Energy situation of Tanzania
At the present, the energy balance in Tanzania is dominated by traditional use of biomass – about 86% of total energy consumption is Biomass in the form of firewood and charcoal for cooking. Commercial energy sources such as Oil, Gas, Electricity, and Coal, as well as Non-Biomass Renewable energy, account for the remaining 14%. Petroleum (Oil) and Electricity account for about 11% and 2%, respectively, for primary energy use. Coal, Gas, Wind and Solar account for about 1% of the energy used as shown in Figure 1-4 below [7].
Figure 1-4 - Share of total final energy Consumption in Tanzania
Tanzania’s power supply consists of the national interconnected system and several mini-grids serving areas located far from the national grid. The total installed electricity generation capacity is 1,564 MW. It is composed of Hydro 553 MW (or 35%), Small Hydro 13 MW (or 1%), Natural Gas 501 MW (or 32% percent), Liquid Fuels 456 MW (or 29%), Biomass 27 MW. Independent and Emergency Power Producers (IPPs and EPPs) own and operate power plants with a total installed capacity of about 417 MW. Tanzania also imports electricity from Uganda 8 MW, Zambia 5 MW, and Kenya 0.85MW. [8] The country suffers from low coverage of the electric grid and an increasing shortage of electric power
86,4% 10,6% 2,1% 0,7% 0,3% Biofuels Oil products EE Gas Coal
29 production capacity in relation to demand, which roughly grows with the economic growth. In addition, as everywhere in Sub Saharan Africa, the reliability of the electric grid power is low, with frequent brownouts and blackouts.
Table 1-3 Power generation capacity in Tanzania in 2015 (Source[9]) Power generation capacity [MW]
Hydro 553 Small Hydro 13 Oil 456 Biofuel 27 Gas 501 import 14 TOT 1564
(USAID, power for Africa)
1.4.3 Problem of overuse of biomass in Tanzania
More than 80% of Tanzanians depend on biomass as a source of energy by burning firewood, dung, and other traditional fuels. [10]
As shown in Figure 1-4 biomass use in Tanzania accounts for around 86% of total energy consumption and its use is growing in absolute terms due to the increase in population. The major biomass energy consumers include charcoal and firewood for domestic use, tobacco production, brick making, and tea drying. The first important consequence of increasing use of firewood and charcoal in Tanzania concerns health. The indoor use of open fires or inefficient stoves in households (Figure 1-5) releases large amounts of smoke from incomplete combustion of solid fuels (carbon monoxide and small particles and many other health damaging chemicals). Breathing this smoke affect the health of all
30 members of the family, especially children and women who suffer every day with difficulty in breathing, chronic respiratory diseases and stinging eyes.
Figure 1-5 Women and children sitting around an open fire in a wooden kitchen
Second consequence of increasing use of biomass in Tanzania concerns impact on the environment. Recently biomass energy consumption (mainly firewood and charcoal) has increased dramatically and the rapid population growth of both urban and rural areas has placed severe strain on the biomass resources, which has led to deforestation and desertification of some areas. Indeed, need for traditional biomass energy causes over exploitation of forests leading to deforestation and consequently severe soil and land degradation through firewood extraction and cutting down of trees for charcoal production.
31
1.4.4 Problem of access to electricity in Tanzania
Access to electricity is one of the most important problems in Tanzania. Tanzania is growing up in number of people and in GDP so energy demand since 2000 has strongly increased and in order to sustain country’s development growth, access to electric energy is a fundamental prerequisite.
Access to electricity measures the share of population which has a domestic electricity connection. This connection could vary in quantity (availability of electrical energy during the day) or quality (stability in voltage and frequency of electrical power during the day). Overall Electricity access rate in Tanzania was 15,3% , and today is 24% [6].
Access to electricity in urban areas accounts for 71%. It significantly decreases when considering rural areas to 4% (on average only 2% is connected to the national grid). As only less than 30% of population live in urban centres the overall electricity access rate in Tanzania is 24% [3].
Table 1-4 Access to electricity in Africa and Tanzania in 2015 Region Population without electricity millions National electrification rate % Urban electrification rate % Rural electrification rate % Africa 635 43% 68% 26% Sub-Saharan Africa 634 32% 59% 17% Tanzania 37 24% 71% 4% North Africa 1 99% 100% 99%
(SOURCE: IEA, World Energy Outlook 2015(
The annual per capita electricity consumption is about 90 kWh (225 kWh is the average annual per capita electricity consumption in Sub Saharan Africa excluding South Africa), which is very low compared with the world average of around 3000 kWh. Consumption per capita is significantly lower in rural areas,
32 typically in the range of 50 to 100 kWh per year [11]. For a five person’s household, annual consumption of 50 kWh per person could, for instance, allow the use of a mobile phone, two compact fluorescent light bulbs and a fan or radio for few hours a day. In urban areas, households generally own more appliances, such as televisions, refrigerators or an electric water heater.
Figure 1-6 Access to electricity to national grid by region (Source [12])
Despite of the fact that the recent phenomenon of urbanisation has often facilitated increasing access to modern energy, as more than 70% of those lacking access to electricity in Tanzania live in rural areas, rural electrification will be fundamental in order to reach universal access to electricity in the country.
1.4.5 Rural areas in Tanzania
As already underlined around 70% of total population in Tanzania live in remote areas. The main sources of income for rural households are agriculture, pastoralism, livestock, cattle raising and forestry. Rural areas in developing countries are characterised by scattered population and are generally difficult to reach due to their geographical isolation and very bad road conditions. The road conditions and long distances from urban settlements make these places
33 accessibility limited, and hence service suppliers cannot guarantee regular visits, thus preventing local populations from participating in national or regional markets. Moreover, high educated people (i.e. teachers, doctors, technicians, etc.) are despondent to work in such areas. Rural areas are also affected by high illiteracy rate, gender inequality, lack of access to health care, infrastructure and clean water supply.
Therefore, bringing access to electricity in rural area is a fundamental prerequisite to trigger and ensure a sustainable development. However, as a result of several factors, the progress of rural electrification in Tanzania are meagre: scattered population, bad road conditions, rural-urban demographic shifts, poor conditions for investment credits, absence of financial institute, presence of fairly few actors dealing with rural electrification, are all factors that make slow and complex the progress in rural electrification.
34
1.4.6 Providing access to electricity in rural area in Tanzania
There are to possible approaches to bring electricity to non-electrified region: the centralized electrification and the decentralized/distributed electrification. The first one consists in the extension of the national grid and is undertaken by national governmental entities such as the state-owned national utility (TANESCO), the Rural Electrification Agency (REA), or the ministry of energy, acting alone or together. Connection to the national centralized grid is generally limited to those towns and villages along main roads and to nearby areas. When it is available, often only the high income households, few enterprises and community services can afford connections since electricity may cost as much as 10 times more than in urban areas.When cost for extending national grid to rural areas is unsustainable, Off-grid power systems are the only solution to bring Electricity in remote areas. Depending on number of energy sources used, the off-grid systems can be divided into Decentralised and Distributed systems as shown briefly in Table 1-5 [13]
Table 1-5 Off Grid Systems Matrix for rural electrification systems in DCs (Source[13])
OFF-GRID SYSTEMS MATRIX
DECENTRALIZED DISTRIBUTED
Rural Energy Uses Stand-alone Systems Micro-Grid
Systems
Hybrid Micro-Grid Systems
Households Home-based Systems
Systems including a distribution grid
Systems including a distribution grid Community services Community-based
Systems
Productive uses Productive-based Systems
Consumer number Single Multiple Single or Multiple
35 The decentralized/distributed electrification is generally carried out through nongovernmental entities such as cooperatives, community user groups, or private entrepreneurs. These entities usually construct and operate isolated mini-grid, small-scale distribution networks typically operating below 11 kilovolts (kV) that provide power to one or more local communities and produce electricity from small generators using fossil fuels, renewable sources, or a combination of the two.
Therefore, in order to achieve universal access to electricity Off-grid small-scale electricity generation represents the most appropriate option to spread access to electricity in remote areas in Tanzania. It can be seen both as a first step in the electrification process and as building-block for a possible future national grid connection development. The forecasts drawn by the International Energy Agency reports that about 60% of the additional electricity generation requested to provide universal access to energy, is expected to be generated through off-grid systems and about 90% of them are supposed to rely on renewable-based sources systems and mini grid.
The best source to be used in rural context in Tanzania to produce electricity is Micro and Mini Hydropower source because the country has a huge hydropower potential still untapped.
1.4.7 Hydropower source for rural electrification
Thanks to his numerous basins draining towards the three oceans in the east, west and north of the African continent Tanzania has the largest hydropower potential of East Africa (Kenya, Tanzania, Uganda, Rwanda and Burundi), estimated to be up to 4700 MW. Only about 10% of hydropower potential is tapped. The country’s installed electricity generation capacity is 1564 MW [9]: about 61% of grid generation capacity is from thermal (32% from natural gas and 29% from
36 oil), whilst 35% is from large hydropower and 1% is from small hydropower. The rest 3% comes from biofuel energy power and imports (Figure 1-8).
Figure 1-8 Share of power generation by fuel in Tanzania (Source [9])
Small Hydropower typical capacity range from few kW (micro-hydro) to few MW (mini-hydro), depending on various factors as hydrology, load demand and geographical constraints. The assessed potential of Small Hydropower resources up to 10 MW (micro and mini Hydropower power sources) in Tanzania is 480 MW. The installed grid-connected, small-hydro projects contribute for only 13 MW. Most of the developed small-hydro projects are owned by private entities and are not connected to the national electricity grid.
Hydropower is the most popular and the oldest renewable energy source used to produce electricity for rural mini-grids and SHPP ( Small Hydro Power
Hydro 35% Small Hydro 1% Oil 29% Biofuel 2% Gas 32% Import 1%
37 Plant) are the most attractive solutions to bring electricity in remote areas due to several factors: Tanzania rural areas have big potential assessed that is still untapped; the powerhouse is pretty standard hosting one or more turbines, alternators and control system; the technology is quite simple and well mature, allowing local repairing; there are several examples of local manufacturing or assembling companies in Africa dealing with Cross-flow or Pelton turbines for rural applications; investment costs for micro-mini hydropower plant ( SHPP) are generally claimed to be low and average costs of electricity generated is lower than any other technology, renewable or otherwise. On the other hand, the infrastructure and civil works can be rather complex and costly depending on the water collection system (pond, weir, channel, fore bay, and penstock, the long preparation (studies, permits) and lead times are other hurdles)[14].
In order to bring electricity in rural areas Tanzanian government policy on small hydropower is to develop small sites in areas which are not supplied with power from the national grid or to replace diesel generation in isolated areas. Based on this policy, several small scale hydropower development activities have been initiated by the government in cooperation with local and foreign agencies. One of these agencies operating in rural electrification in Tanzania is CEFA Onlus, an Italian Non-Government Organization. CEFA in recent years has successfully carried out important projects in the rural electrification sector by the realization of small hydropower plants in the regions of Ninga e Iringa.
38
2 Background
2.1 CEFA Onlus
2.1.1 CEFA NGO general description
CEFA (European Committee for Training and Agriculture) is an Italian NGO, founded in 1972 by a group of agricultural cooperatives based in Bologna that promotes initiatives of development, cooperation and international volunteer service. CEFA supports projects in rural regions of the Mediterranean, East Africa and Latin America to promote integrated self-development which means to support and accompany local communities in establishing a sustainable and durable development process. [15]
Since 1976 in Tanzania CEFA promotes interventions in the fields of water supply, agriculture, agro-processing and rural electrification. CEFA's aim is to support community and local institution in the poorest countries of the world through family and community, economy improvement, valorization of human resources and training and recognition of fundamental human rights. CEFA works in cooperation in the field of humanitarian aid, through projects that combine productive activities with a commitment to achieving social growth and development of democratic and ethical organizations. CEFA's international cooperation actions are related to the following sector of intervention:
Rural economy with production, transformation and commercialization of agricultural products
39
Crafting products;
Basic infrastructures to guarantee water access, requalification and environment protection of the territory and the use of renewable energies;
Technical and Management training;
Promotion of local communities;
Re-integration in the community of underprivileged people;
Help to local school institutions and promotion of a real education right for everybody
Electrification or rural areas with no access to electricity
40
2.1.2 CEFA’s rural electrification projects in Tanzania
CEFA’s commitment to rural electrification in Tanzania lasts for 25 years and in this period the NGO has realised three mini hydro-electric power plants in the rural areas of Iringa and Njombe regions, which currently serve 5 villages (about 1070 households, public services and private enterprises) connected to the mini-grids.
Matembwe
The first power plant was realised in the village of Matembwe, in the District of Njombe, in 1984. The hydropower plant has a nominal power of 120 kW and supply electricity to 2 villages serving about 700 connections. At present, the power plant and the distribution network are owned and managed by the Matembwe Village Company (MVC Ltd), a local entity established by CEFA together with the other partners of the original project (Catholic Dioceses of Njombe, District of Njombe and Village of Matembwe).
41 Table 2-1 Characteristics of Small Hydro plant in Matembwe (Source [16],[17])
MATEMBWE
Type of facility Reservoir micro hydropower plant
Commissioning year 1984
Funded by Italian Ministry of Foreign Affairs, Belgian Ministry of Foreign Affairs, European Union, CEFA
Ownership Matembwe Village Company - MVC Ltd (CEFA, Chatolic Diocess of Njombe, District of Njombe)
Output power 120kW
Villages served Matmbwe and Image
Distribution network 19km of MV
Households connected 556
PS and US connected 64
Acqueducts powered 4
Connection with TANESCO Yes (in 2015)
Bomalang’ombe
The second power plant was realized in the village of Bomalang’ombe, in the District of Kilolo. The hydropower plant has a nominal power of 250 kW and supply electricity to 3 villages serving about 400 connections. The availability of electric power determined a rapid development of the village of Bomalang’ombe, that in these years has seen its population grow from 5.000 to more than 12.500 inhabitants. At present the power plant and the distribution network are owned and managed by the Bomalang’ombe Village Company – BVC Ltd, a local entity established by CEFA together with the other partners of the original project (Catholic Dioceses of Iringa, District of Kilolo and Village of Bomalang’ombe).
42 Figure 2-3 Reservoir micro hydro plant of Bomalang’ombe
Table 2-2 Characteristics of the small hydro power plant in Bomalang’ombe [16], [17]
BOMALANG'OMBE
Type of facility Reservoir micro hydro plant
Commissioning year 2001
Funded by Italian Ministry of Foerign Affairs, Belgian Ministry of Foreign Affairs, European Union, CEFA
Ownership Bomalang'ombe Village Company - BVC Ltd (CEFA, Chatolic Diocess of Iringa, District of Kilolo and Village of Bomalang'ombe)
Output power 120kW
Villages served Bomalang'ombe and Lyamko
Distribution network 17,3km of MV
Households connected 252
PS and US connected 76
Acqueducts powered 3
43
Ikondo
The third power plant was realized in the village of Ikondo, in the District of Njombe. The hydropower plant has a nominal power of 80 kW and supply electricity to the village of Ikondo. Unlike the previous two sites, Ikondo is a run-of-river plant, which uses the water provided by the river Kyepa. The project intended to help start-off the development to the village of Ikondo, a very isolated settlement in the District of Njombe. At present the power plant and the distribution network are still owned and managed by CEFA.
44 Table 2-3 Characteristics of Small Hydro plant in Ikondo [16]
IKONDO
Type of facility Run-of-the-river micro hydro plant
Commissioning year 2004
Funded by Italian Ministry of Foreign Affairs, Belgian Ministry of Foreign Affairs, European Union, CEFA
Ownership CEFA (to be handed over to MVC Ltd)
Output power 83kW
Villages served Ikondo
Distribution network 8km of MV
Households connected 130
PS and 46
Acqueducts powered 1
Connection with TANESCO Yes (in 2015)
Ikondo II
CEFA is going to finalize soon its more recent electrification project consisting in an upgrade of the previous project in Ikondo. The project, called “Ikondo2” co-funded by the European Union, started in September 2011 and has been concluded at the end of the 2015 with an upgrade of the output of the power plant up to 480 kW. The final step is to increase the actual distribution grid in order to reach new villages and connect the mini-grid to the Matembwe micro-grid and to TANESCO’s national grid in order to sell the excess of production. At the end of the project the power plant and the distribution network will be owned and managed by the Matembwe Village Company – MVC Ltd. [17]
45 Figure 2-5 Run-of-the-river micro hydro plant upgraded in Ikondo
Table 2-4 Characteristics of the upgraded Small Hydro plant in Ikondo [16] IKONDO II
Type of facility Run-of-the-river micro hydro plant
Commissioning year 2015
Funded by European Union, CEFA
Ownership CEFA (to be handed over to MVC Ltd)
Output power 430kW
Villages served Ikondo, Nyave, Ukalawa, Isoliwaya, Kanikele
Distribution network 47km of MV (in 2016)
Households connected 280
PS and US connected 75
Acqueducts powered 1
46
2.2 Ninga SHPP: CEFA’s last electrification project
Moreover, CEFA has recently been awarded by Rural Electrification Agency a matching grant for the realization of a feasibility study for a possible 6 MW SHPP situated in Ninga – Njombe. This feasibility study was finalized in March 2015 by ENSCO, an Italian engineer consulting company located in Belluno and CEFA is currently looking for the financial closure. [17] The goal of the proposed Hydro Power Plant is to give electricity to 13 non electrified villages through mini-grid connected to the main grid, and the excess of energy will be sold to TANESCO.
2.2.1 Location of the plant
The territory of Tanzania is divided into 9 drainage basins, 5 draining into the internal lakes and 4 draining into the Indian Ocean. The proposed 6 MW capacity SSHP lies in the Rufiji Basin, a big river in the South East of Tanzania, flowing into the Indian Indian Ocean. [18]
47 Figure 2-7 Kilombero River tributary basin and South Ruaha River The project makes use of the water of South Ruaha River, affluent of the Mnyera and part of Kilombero River tributary basin. South Ruaha River is located in Njombe Region, not far from Matembwe, in the ward of Ninga.
The area, situated approximately 55 km north-east from Njombe township, has an average altitude of 1800 meter above-sea-level and is characterised by undulating hills and plateaus. The soils are volcanic and mostly covered with planted and natural forest trees, scattered shrubs and grasslands. Crop framing includes maize widely cultivated, bananas, green peas, tea, coffee, wheat, pyrethrum, temperate fruits. Livestock keeping includes dairy cattle, pigs and sheep. The possible site of the intake on the river can be reached partly by an unpaved road, about 12 km from Ninga. A substantial repair of the road is needed and the construction of about 3 km new road have to be executed in order to reach the intake area.
48
2.2.2 Climate and rainfall trend in Njombe Region
In order to best evaluate the hydropower potential of the propose power plant a good knowledge of climate and rainfall trend of the study area is required. Tanzania’s climate conditions are characterised by enormous variability in terms of rainfall, temperature and stream flow or levels. Furthermore, the climate is closely associated with the topography and ranges from tropical to subtropical, and the annual rainfall ranges between 500 mm and 2000 mm. Most of the rain is derived from the South-eastern Monsoon winds originating from the Indian Ocean. In the study area of Njombe Region the climate is humid and the average temperature lies below 15° C. The amount of rainfall in the area lies around 1100 mm per annum or more, falling mostly in a single season from November through May. The dry and cold season occurs after the rain season, from June to October. The climate trends in the relevant zone were investigated with reference to rainfall data. Figure 2-8 [18] shows the rainfall records of the last 20 years at the Itambo met station, Kibena tea Limited positioned about 23 km from the project.
Figure 2-8 Mean monthly rainfall in the study area [mm] 0 50 100 150 200 250
49
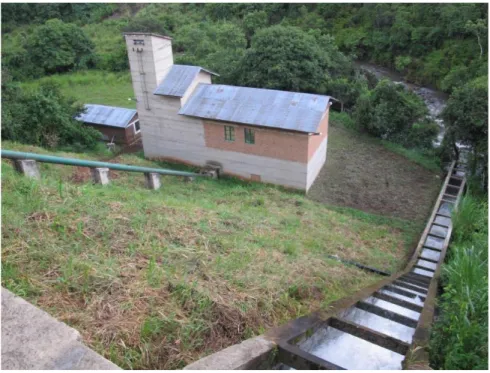
2.2.3 Technical features and energy production evaluation
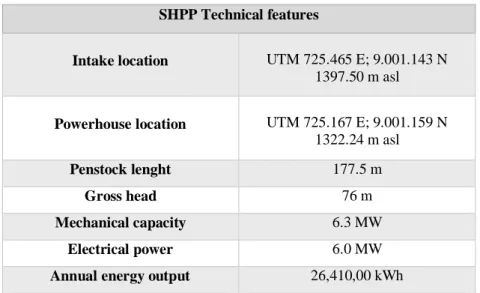
The Small Scale Hydropower Plant will be a "Run of River" plant, a type of hydroelectric generation plant whereby little or no water storage is provided. Run-of-the-river power plants may have no water storage at all or a limited amount of storage, in which case the storage reservoir is referred to as poundage. The plant to be built has no water storage and is, therefore, subject to seasonal river flows. Indeed, turbines generate electricity as and when the water is available and provided by the river. When the river dries up and the flow falls below some predetermined amount or the minimum technical flow for the turbine, generation ceases. More in details, the project consists of a diversion dam on the river South Ruaha, a relevant water course with a huge flow rate. The intake will be positioned upstream a waterfall so that an optimal hydropower potential can be developed. It works with a gravel sluice and two sand traps on the left bank of the river. There is a weir to divert water to the intake. A diversion channel and a penstock leads the diverted flow to the powerhouse where two Francis turbines produce electricity, and there is a tailrace to return the flow to the river [18]. The main technical features of the proposed power plant are shown in ( Table 2-5).Table 2-5 Technical features of the proposed power plant SHPP Technical features
Intake location UTM 725.465 E; 9.001.143 N 1397.50 m asl Powerhouse location UTM 725.167 E; 9.001.159 N 1322.24 m asl Penstock lenght 177.5 m Gross head 76 m Mechanical capacity 6.3 MW Electrical power 6.0 MW
50 As few data of South Ruaha river flow are available, data on the near Ruhudji river have been utilised for a preliminary evaluation. On the basis of the hydrological studies and the available head, two vertical-shaft Francis turbines with a straight conical diffuser, will be installed. The two Francis turbines characteristics are shown in Table 2-6.
Table 2-6 Technical characteristics of Francis turbines [18]
Unit of measure T1 T2
Flow rate m^3/s 2.9 6.73
Net head m 75.67 75.29
Efficiency of the turbine - 89% 89%
Frequency of the network Hz 50 50
Mechanical power kW 1916 4424
Electical power kW 1820 4203
The electric line (33kV) is 82 km long and will connect 13 villages. It also will connect to the national grid nearby the villages of Ikuna and Lole, some kilometers north of Nyombo. The villages served by electricity within the project are shown in Figure 2-9.
51 Figure 2-9 Location of the 13 villages (colour blue) and Ninga S.H.P.P. [19]
On the base of annual data, the flow evaluation and the net of electricity production can be evaluated. The Table 2-7 shows the monthly energy produced by the power plant.
52 Table 2-7 SHPP monthly energy production [18]
mean river flow [m3/s] utilised flow [m3/s] Electric Capacity [kW] Energy Produced [kWh] Jan 6.49 5.88 3679 2737163 Feb 10.23 9.63 5975 4015167 Mar 12.78 9.63 5975 4445363 Apr 12.59 9.63 5975 4301964 May 7.51 6.91 4316 3210428 June 5.13 4.53 2836 2042083 July 4.1 3.5 2194 1632647 Aug 3.48 2.88 1807 1345090 Sept 2.42 1.82 1142 822592 Oct 2.01 1.4 882 656034 Nov 1.87 1,26 793 571421 Dec 3.71 3.1 1948 1449574
Mean annual 6.03 5.02 losses = 3% 27229526 Net Energy 26,412,640
In order to realize this project, CEFA has decided to adopt the Non-Profit/For-Profit Partnerships approach: the NP/FPP is one of the best mechanisms to supplement and overcome budgetary constraints for widening access to energy services, especially to the local communities, as they can allocate project-risks between the public/non-profit and private sector. This innovative approach, both financially and operationally, based on a partnership with a private actor is an opportunity for increasing the action’s impact on the beneficiaries granting the future sustainability of the project.[17]
In this context, as the energy produced by the SHPP will exceed the local energy demand if the mini grid will be connected to the national grid the output could be sold to the TANESCO making the project commercially attractive.
So in order to calculate the excess of energy produced by the plant an accurate load demand evaluation of the 13 villages is required.
53
3 Load Curve Estimation and Primary
Energy Assessment
The purpose of the internship at CEFA Onlus in Njombe region is to carry out a deep study about energy needs and usages in the thirteen villages of the Ninga’s SHPP project.
In the first paragraph the two goals of the thesis are explained. The next paragraphs show the activities carried out during the mission, the surveys administered in the villages and the tool used to collect data. Subsequently the procedure and the software used in order to obtain the first goal and the method used to achieve the second goal are explained. Finally, in the last chapter results are shown and a brief analysis is carried out.
3.1 Purposes of the thesis
The objectives of the internship at CEFA Rural Energy Program in Njombe region in Tanzania are the followings:
1. Future load curve estimation of 13 non electrified rural villages 2. Energy demand assessment of 13 non electrified rural villages
Goal number 1 consists of estimating the future load curve profile of 13 non electrified villages that are going to be electrified soon by the connection to a mini grid powered by a Small Hydro Power Plant (SHPP). In other words, the purpose is to evaluate how much electricity the 13 villages are going to on daily basis when they will have access to affordable and reliable electricity (with a short term perspective - 1 year) through mini-grid connected to the main grid. In order to achieve goal number 1 surveys have been administered in the villages and data collected have been used as input in LoadProGen, a software for the estimation of load curve in rural remote areas. Results will be useful for CEFA and may
54 allow an optimum technical-economic system design of the Power Plant. Indeed, the evaluation of future daily electricity consumption of the 13 villages allow to calculate the excess of energy that the Power Plant is going to produce and so the excess of energy that can be sold to TANESCO when the scheduled connection to the National grid will be completed.
The goal number two consists of assessing the primary energy demand of the 13 non-electrified villages of Ninga project in order to provide a snapshot of the current primary energy consumption.
3.2 Summary of activities
In the following paragraph, a brief overview of the activities carried out during the entire period is described.
The first period (around one month) consisted in literature research, particularly load curve estimation methods in rural context and energy demand estimation methods. The second period (around two months) was spent in the study area of Njombe in Tanzania and it represented the core of the entire work. It can be further divided into 4 shorter periods of time:
- during the first week, a first draft of questionnaires was prepared
- during the following two weeks, some of the villages in the study area were visited and information about CEFA' s projects and local villages was collected. Based on the information gathered, the questionnaires were reviewed;
- during the following two weeks, all the surveys were administered in the selected villages and all necessary data was collected;
- during the last two weeks, the collected data was reorganized and a first analysis carried out.
The last period spent in Milan consisted of processing and analysing data and writing of the thesis.
55
3.3 Study area
In the following paragraph, the geographical area where the activities were carried out during the period of the mission is described.
The 13 villages are located within a 10000 km2 area. The area ( Figure 3-1), situated approximately 55 km north-east from Njombe township, has an average altitude of 1800 meter above sea level and is characterised by undulating hills and plateaus. The soil is volcanic and mostly covered with planted and natural forest trees, scattered shrubs and grasslands. Crop farming includes maize widely cultivated maize, bananas, green peas, tea, coffee, wheat, and temperate fruits. Livestock includes dairy cattle, pigs and sheep. The main sources of income for rural households are agriculture, pastoralism, cattle raising and forestry. Rural areas in developing countries are characterised by scattered population and are generally difficult to reach due to their geographical isolation and limited infrastructure.
Figure 3-1 View from satellite of the study area where the villages are located [20]
56
3.4 Surveys
The first activity carried out during the time spent in Tanzania was the creation of questionnaires to be administered to local villages in the study area. The goals of the surveys were the following:
- to collect input data required by Load Profile Generator [21] in order to evaluate the future load curve of the thirteen villages
- to collect data about energy sources used in the villages in order to assess the primary energy demand and have a snapshot of the current primary energy consumption of the 13 villages
In order to achieve the previous targets, two different surveys have been prepared: a questionnaire for Electrified Villages and a Questionnaire for Non Electrified Villages.
3.4.1 Questionnaires addressed to Electrified Villages
Two different Surveys addressed to Electrified Villages have been created in relation to the interviewees: a survey addressed to the Households of the villages and a survey addressed to Public Services and Productive Usages.
The Questionnaire addressed to Households (see Q_EE_HH in Appendix A) is composed of three sections: the first section concerns questions about general information those interviewed, composition of the family, employment, income and expenditure of households; the second section concerns questions about electric devices use and usage habits of electric appliances. Number and type of electric devices used in the house, the average daily use, the minimum functioning time and the functioning windows for each appliance have been asked to households (data required by LoadProGen for load curve estimation). Finally, the last section concerns questions about electricity consumption and electricity bill. The Questionnaire addressed to the PB&US (see Q_EE_ PB&US in Appendix A) is the same of the previous but in the first section, questions about family


![Table 1-5 Off Grid Systems Matrix for rural electrification systems in DCs (Source[13])](https://thumb-eu.123doks.com/thumbv2/123dokorg/7502912.104615/34.892.182.756.749.998/table-grid-systems-matrix-rural-electrification-systems-source.webp)
![Table 2-2 Characteristics of the small hydro power plant in Bomalang’ombe [16], [17]](https://thumb-eu.123doks.com/thumbv2/123dokorg/7502912.104615/42.892.264.673.181.453/table-characteristics-small-hydro-power-plant-bomalang-ombe.webp)
![Table 2-4 Characteristics of the upgraded Small Hydro plant in Ikondo [16]](https://thumb-eu.123doks.com/thumbv2/123dokorg/7502912.104615/45.892.265.670.179.452/table-characteristics-upgraded-small-hydro-plant-ikondo.webp)
![Figure 3-1 View from satellite of the study area where the villages are located [20]](https://thumb-eu.123doks.com/thumbv2/123dokorg/7502912.104615/55.892.223.708.628.969/figure-view-satellite-study-area-villages-located.webp)
