Politecnico di Milano
SCHOOL OF INDUSTRIAL AND INFORMATION ENGINEERING Master of Science – Energy Engineering
Colombian projected power generation system and CO
2emissions for the most energy consuming sectors until
2050, using MARKAL standard model
Supervisor
Prof. Mister Massimo Tavoni
Candidate Angela Dubois Camacho – 872535
Acknowledgments
As first instance, I would like to thank to Prof. Tavoni and Dr. Marcucci for the guidance material for the development of this work.
Thanks to Politecnico di Milano and all the people involved in my formation in the last couple of years, and more precisely a lot of thanks to Las Chicas, Alicia, Karlita, and Lau, and to Frida, who shared with me the whole spectrum of the master experience and became my biggest support here.
I would also like to thank my families, Dubois-Camacho and Guglielmotti, who from the far and the close fully followed this life experience.
Bunch of thanks to Pamela Choo team, Tesy and Paola, and to my current working group at ESE, who had become essential in the last phase of this work.
Vale, Sofi, Emmita, thanks for being the reasons for me for trying to give always the best I can.
Table of Contents
1 INTRODUCTION ... 8
2 COLOMBIA ... 10
2.1 COLOMBIAN ENERGETIC USE ... 10
2.1.1 Transport Sector ... 12
2.1.2 Industrial Sector ... 14
2.1.3 RESIDENTIAL SECTOR ... 17
2.1.4 COMMERCIAL SECTOR ... 18
2.2 COLOMBIAN POWER GENERATION ... 20
3 MARKAL MODEL ... 22
4 MARKAL INPUTS ... 23
4.1 DEMAND DRIVERS ... 23
4.1.1 Growth rate and Elasticity ... 25
4.1.2 Energy End-Use demands... 28
4.2 End-Use Technologies Efficiency ... 31
4.2.1 Technologies CAPEX [24] [25] [26] [27] ... 35
4.2.2 Power Generation Technologies ... 36
4.2.3 Fossil Fuels reservoirs ... 37
... 37
4.3 Alternative scenarios to BAU ... 38
5 RESULTS AND ANALYSIS ... 39
5.1 BAU Results ... 39
5.1.1 Power generation distribution ... 39
5.1.2 Emissions results ... 40
5.2 Alternative scenarios results ... 42
5.2.1 Power generation distribution in alternative scenarios ... 44
5.2.2 Emissions of Alternative scenarios ... 53
6 CONCLUSIONS ... 64
7 Annex A [25] [26] [17] ... 66
7.1 MARKAL Energy System ... 66
7.2 A simplified Mathematical Formulation of the MARKAL Linear Program ... 67
7.3 Decision variables ... 67
7.5 Some main MARKAL model equations ... 69
7.5.1 Satisfaction of Demands ... 70
7.5.2 Conservation of investments on new capacity ... 70
7.5.3 Use of capacity ... 70
7.5.4 Balance of energy carriers ... 70
7.5.5 Peaking reserve constraint for electricity ... 71
7.5.6 Base Load ... 71
7.5.7 Emission constraint(s) ... 71
7.6 GAMS Modeling Language and MARKAL Implementation ... 71
8 References ... 73
List of Tables Table 1 Power plants on a year of El Niño phenomenon (2010) ... 21
Table 2 Sectors Elasticity with respect to Total GDP ... 27
Table 3 Industrial Energy End-Use Technologies Efficiency ... 32
Table 4 Commercial Energy End-Use Technologies Efficiency ... 32
Table 5 Residential Energy End-Use Technologies Efficiency ... 33
Table 6 Vehicles Efficiency by Fuel Type ... 33
Table 7 CAPEX of End-use Demand Technologies ... 35
List of Figures Figure 1 Final Use by Sector in PJ ... 11
Figure 2 Share Final Energy Consumption by Sector ... 11
Figure 3 Share Final Energy Use – Transport ... 13
Figure 4 Emissions standards/limits in Colombia and Europe [4] ... 14
Figure 5 Share of Final Use in Total Energy Consumed in Industrial Sector ... 15
Figure 6 Share Final Energy Use - Industrial ... 16
Figure 7 Use of Energy Source in Industrial Sector in Petajuoles ... 16
Figure 8 Share Final Energy Use Residential Sector ... 17
Figure 9Energy Use by Source, Residential Sector ... 17
Figure 10 Share Final Energy Use - Residential ... 18
Figure 11 Share on Final Use Commercial Sector ... 19
Figure 12 Final Energy Use by Source in Commercial Sector ... 19
Figure 13 Share Final Energy Use - Commercial ... 20
Figure 14Industrial Sector Economy Rate of Change ... 26
Figure 15 Commercial Sector Economy Rate of Change ... 26
Figure 17 Population Growth Rate 2010-2050 ... 28
Figure 18 Industrial Demand Projections 2010-2015 ... 29
Figure 19 Commercial Demand Projections 2010-2050 ... 29
Figure 20 Residential Demand Projections 2010-2050 ... 30
Figure 21 Transportation Demand Projection ... 30
Figure 22 Demand Growth rates for each economy sector in Colombia 2010-2050 ... 31
Figure 23 Cumulative Reservoirs as in Year 2019, Petajoules ... 37
Abstract
Policies and decision making at any level is never an easy task: many factors and details have to be considered, projections have to be made and lot of figures have to be assessed. Nevertheless, it is hard to be ready for the future without projections of what could happen and of how to possibly avoid negative situations.
Currently the world is placed in a turning point and this is the moment to act against climate change. Colombia is a country which contributes in average with less than 0.5% of the total global emissions, but it still is a country that got compromises after Paris agreement and it is necessary to understand how the national energy matrix works in order to accomplish its emission reduction set goals.
To do the latter needs a very detailed description of the system, this is why Colombian government historical data and National Energy department library are taken as sources for this analysis. The details of Colombian energy system are inputs in a model called MARKAL. In this model the drivers are the demands of energy in Industrial, Residential, Commercial and Transportation sectors, projected until year 2050. MARKAL model also allows to set as input the cost of producing each energy unit, taking into account every step of the process, from the mine to the end-use demand. After the model is well detailed, some possible future scenarios are chosen to be evaluated: a variation on ±10%, ±30% and ±50% on demand projections, scenarios with low Hydropower availability and at last a set of scenarios combining low Hydropower availability plus an emission cap.
Different scenarios are evaluated in order to see how the cost effective reaction to the countries to different possible futures is and to determine if there are common factors which could be avoid in order to enhance the energy system.
At the end it is possible to see how the lack of proper policies which incentive the use of more efficient technologies lead to the same results in all scenarios: growth of industrial and transportation sector emission level without any restriction, zero investment on non-conventional power generation technologies and dependency on international electricity market if global temperature increases.
That is why, starting from government level, it has to be taken action to favor and incentivize the use of renewable technologies at population and industrial level. Also laws must be stronger when it has to do with emission limits for old vehicle fleets and with low efficient industrial machinery.
Sommario
Le politiche e il processo decisionale a qualsiasi livello non sono mai un compito facile: molti fattori e dettagli devono essere considerati, le proiezioni devono essere fatte e molte cifre devono essere valutate. Tuttavia, è difficile essere pronti per il futuro senza proiezioni di ciò che potrebbe accadere e di come eventualmente evitare situazioni negative.
Attualmente il mondo è in una svolta e questo è il momento di agire contro i cambiamenti climatici. La Colombia è un paese che contribuisce in media con meno dello 0,5% delle emissioni globali totali, ma è ancora un paese che ha ottenuto compromessi dopo l'accordo di Parigi ed è necessario capire come funziona la matrice energetica nazionale per realizzare la sua riduzione delle emissioni obiettivi stabiliti.
Per fare questo ha bisogno di una descrizione molto dettagliata del sistema, ecco perché i dati storici del governo colombiano e la biblioteca del dipartimento di energia nazionale sono presi come fonti per questa analisi. I dettagli del sistema energetico colombiano sono input in un modello chiamato MARKAL. In questo modello i driver sono le richieste di energia nei settori industriale, residenziale, commerciale e dei trasporti, proiettate fino all'anno 2050. Il modello MARKAL consente inoltre di impostare come input il costo di produzione di ciascuna unità energetica, tenendo conto di ogni fase del processo, dalla miniera alla domanda di uso finale. Dopo che il modello è ben dettagliato, vengono scelti alcuni possibili scenari futuri da valutare: una variazione su ± 10%, ± 30% e ± 50% su proiezioni su richiesta, scenari con bassa disponibilità di energia idroelettrica e infine una serie di scenari che combinano bassa energia idroelettrica disponibilità più un limite di emissione.
Vengono valutati diversi scenari al fine di vedere come sia la reazione economica ai paesi verso diversi possibili futuri e per determinare se ci sono fattori comuni che potrebbero essere evitati al fine di migliorare il sistema energetico.
Alla fine è possibile vedere come la mancanza di politiche adeguate che incentivano l'uso di tecnologie più efficienti porti agli stessi risultati in tutti gli scenari: crescita del livello di emissioni del settore industriale e dei trasporti senza alcuna restrizione, zero investimenti in energia non convenzionale tecnologie di generazione e dipendenza dal mercato internazionale dell'elettricità se la temperatura globale aumenta.
Questo è il motivo per cui, a partire dal livello governativo, è necessario agire per favorire e incentivare l'uso delle tecnologie rinnovabili a livello di popolazione e industriale. Inoltre, le leggi devono essere più rigorose quando hanno a che fare con limiti di emissione per le flotte di veicoli vecchi e con macchinari industriali a bassa efficienza.
1 INTRODUCTION
Nowadays’ industrialized countries had the opportunity of growing by many means, including hard and cheap human work and almost unlimited usage of natural resources. Back then, during their growing period, they had no strong boundaries imposed by environment issues, global warming and all damages that have been lately discovered and have been directly linked to the industrial activity, to transportation emissions and other quotidian activities. Therefore, they could establish a production basis and they could develop economies, economies which even if sometimes have not been very stable, at least have given some wellness and live standards to these countries.
On the other hand, nowadays’ developing countries, which have had a lower share in the worldwide overall environmental damage, have to take into account and adopt these recently placed environmental boundaries, in order to contribute to the worldwide overall solution. Even if the measures that have to be taken by developing countries are less radical than the ones that have to be adopted by the already developed ones, it still means a change in the way of doing things for everybody: adopting new technologies, adapting to new economy flows and adopting cultural behaviors at a higher rate than usual.
The annual Conference of Parties, COP, was born as a tool to review and assess the implementation of the above named measures. The COP is the supreme decision maker of the United Nations Framework Convention on Climate Change (UNFCCC), which has as objective the stabilization of emissions to a level in which the anthropogenic interference does not have dangerous effects on the climate system. All of this guaranteeing at the same time not to stop the worldwide development, which means, guaranteeing a sustainable development.
COP21, which is the 21st annual Conference held in Paris, was the first Conference in which all the parties agreed to work together for a common global goal: keep the rise of the temperature under 2 °C, and even under 1.5 °C, with relation to the Temperature in the pre-industrial time. This event is known as the Paris Agreement. As result of this agreement, all involved parties have to take domestic measures, which will contribute to their Nationally Determined Contributions (NDC), being the latter the post- 2020 climate actions taken by each Party [1].
Colombia counts as a developing country, also known as Non-Annex I party. The latter means it is highly affected by the adverse impact of climate change, making it more vulnerable. The Convention, by means of its structure, assures extra incentives, support and technology transfer to these developing countries.
With a share of 0.46% of the global greenhouse emissions in 2010, Colombia is among the 50 most contaminating countries. This value could not be representative, but if no measure is taken, then the total emissions could increase 50% by 2030 [1].
As a first compromise, Colombia decided to decrease by 20% the emissions in 2030, in respect of the expected emissions resulting from following the scenario of BAU. In addition, if there is enough international support, Colombia compromises to reduce by 30% the greenhouse emissions in 2030 [2].
However, Colombia cannot slow down its developing rhythm, because as a country, it lies still far behind of developed countries’ rights and laws. Following aspects are an example of the latter: a share of population does not have access to the interconnected grid leading to a poor education and health system in these zones, main urban areas are full of polluting spots leading to severe respiratory issues, illegal (and sometimes legal) land exploitation which ends up in uncontrolled deforestation and water pollution, among many others.
In order to achieve the COP21 emissions goals without slowing down the economy and hence on-the-way developing dynamics, it is necessary to implement energy efficient processes and unbound as much as possible the Gross Domestic Product GDP growth from the emissions growth, which means, among others, to decrease the energy intensity, to find new economy activities and to stop deforestation.
According to the country energy efficient development action plan for the years 2017 to 2022 (Plan de Acción Indicativo de Eficiencia Energética), there is an average yearly loss of 52% out of the total consumed Energy [3], which means that less than half of the consumed resources end up in useful energy. The sector with the highest losses is the transport one; it contributes with 64% of the total loss, followed by the industrial and residential sector, with a share of 16% and 15%, respectively.
The latter is due to the age of the vehicle fleet. Almost 40% of the vehicle fleet has more than 20 years in circulation [4]. Unfortunately, the taxes for the old vehicles and the incentives for the new ones are not enough to decrease the share of these old vehicles. An old vehicle fleet also implies high levels of pollution in the main urban areas [5]. Regarding the industrial and residential sectors, the reason for the high losses is similar to the one in the transport sector: old and low efficient home appliances and industrial equipment. Income ranges for most families in Colombia do not allow them to renew these home appliances.
Everything what was mentioned above start having full sense when it can be showed numerically, not only because this thesis is made for an engineer audience, but also because what moves companies and therefore the economy systems nowadays are figures.In the past, studies have been made on Greenhouse Gases mitigation measurements in Colombia [6], because climate change is not a new issue.
In order to envisage some possible scenarios and its emissions, its power generation levels and in short, its numbers, MARKAL Model is going to be used.
Therefore, the scope of this thesis goes from the energy offer/demand in Colombia, through its characteristics and costs, and through the demand type segregated by sector until the possible scenarios in the period horizon from 2010 to 2050. Then, emissions of all possible scenarios are calculated together with the power generation levels, and then the resulting figures are assessed to understand which the cost effective solutions distribution are and which policies/incentives/recommendations could be made in order to support positively the global warming issue.
2 COLOMBIA
Transportation, Commercial, Industrial and Residential sectors are the ones with the largest share in the energetic final use, in total they add up 85% of the total consumption [3]. They also contribute together, in yearly average, to approximately 45% of the total Colombian GDP, which gives us a first look on how economy is linked to energetics [7]. Additionally, more than 95% of the total energy losses in the country are contributed by these sectors [3], which means there are many things that can still be done to make them use energy in a more efficient way.
The main goal of this chapter is to clarify the Colombian energy matrix, in the sectors where the largest losses are centered and to give a first assessment of where energy saving measures could be made against bad future scenarios.
2.1 COLOMBIAN ENERGETIC USE
On 2010 and 2015 Colombia had a total consumption of 1150 PJ and 1320 PJ, respectively [8]. Compared to industrialized countries like Italy and Germany, which consume at least 5 and 9 times more primary energy, one might say that developing countries have it easy on emission reductions and on being less energy intensive. Truth is that economic develop is still strongly linked to energy use, as in almost every single country, and industrial plus transportation sector have a share of more than 50% of the total energy consumption. Residential sector has a share almost as high as the industrial one on the total energy consumption; the latter is due to inefficient cooking activities and inefficient house appliances. Wood is still used in rural areas for feeding stoves and old air conditioning plus old ventilation appliances makes the energy consumption to raise up.
Figure 1. and 2. Shows how is distributed the share on energy consumption by each sector on years 2010 and 2015. Agricultural sector has the smallest share, this is why from now on it will not be included in further energy demand details and neither on possible future scenarios. Additionally, from now on, the analysis is focused on emissions and on energy efficiency from the point of view of energy consumption, and agricultural sector, even if it has the biggest contributions to the total country emissions level, it is due mainly to cattle and deforestation for giving space to new plantations [9].
0.00 5.00 10.00 15.00 20.00 25.00 30.00 35.00 40.00
Transport Industrial Residential Commercial Agricultural
S H A R E F I N A L E N E R GY C O N S U M PT I ON
2010 2015
Figure 2 Share Final Energy Consumption by Sector
371.56 279.25 268.40 54.87 18.15
F I N A L E N E R GY U S E BY S EC TO R
Transport Industrial Residential Commercial Agricultural
2.1.1 Transport Sector
As it is shown in Figures 1 and 2, transportation sector is the one that consume the most energy. Old vehicle fleet and lack of regulation are the main reason for the low efficiency, resulting in higher fuel consumption.
Approximately 45% of load transportation vehicles fleet, which are mostly Diesel vehicles as shown in Figure 3, have more than 20 years of use, and even 20% has more than 40 years of use [10]. The latter trigger the PM detection alarms, because in cities like Bogotá and Medellin the limit concentration values have been passed in a quantity of times more than the recommended by World Health Organization.
Unfortunately, greenhouse emissions are not the only air pollution problem present in Colombia. Main cities like Bogotá, Medellin and Santa Marta show high levels of Particulate Matter, crossing sometimes, the World Health Organization concentration limits for PM10 and PM2.5 [11].
All across the country there are measuring stations, which continuously send the data of the concentration levels to the information center. In some cases, the data reliability is doubtful; it is due to the age of the measurement equipment, to the damages made by people on the stations and to the improper equipment handling and calibration. Then, in total, only 75% out of the ca 200 measuring stations send reliable data [12].
In 2017, levels of Total Suspended Particles (TSP) almost totally did not cross neither the national daily nor the national yearly limit, 300µg/m3 and 100µg/m3 respectively. Only 2 stations, one located in Bogotá and the other one located near a coal mine, crossed the yearly average limit.
However, PM10 and PM2.5 exceeded the maximal limit in 10% and 25% of the measuring stations, respectively. These particles are directly related to some respiratory diseases, affecting mostly children and elderly population. The excess on the concentration levels ends up in increasing health issues for the population surrounding the contaminated areas, because according the Colombian quality of air report for 2017, all stations with high concentration levels are located in populated areas. The high levels are due mainly to mobile sources (80%) and to industrial activity in a couple of areas (20%). In 2015 the cost of respiratory diseases caused by P10 and P2.5 Particles was 12.2 billion COP, which equals 1.5% GDP of the same year.
Starting in 2018, Colombian government has establish new maximum allowed levels. From 2018 on: there is no limit to TSP levels, there is a reduction in the limit for SO2 and CO, and PM10 together with PM2.5 keep on with their previous daily and yearly limit values [11].
In order to stop the increasing levels of pollutants in the air without making big restrictions to the mobility services, there is the alternative of giving incentives for the acquisition of electric vehicles and also to implement taxes for cars which are older than a certain age and that therefore do not comply with the emissions limits.
Penetration of hybrid and electric vehicles is still on a “pilot” scale, some electric taxis have been placed in two main cities, Bogotá and Medellin, and there are around 170 hybrid private vehicles and circa 80 electric private vehicles circulating in the country. The lack of incentives by the government side is what holds back the number of environmental friendly vehicles, nowadays, year 2019, there is still no law nor decree that favors the purchase of hybrid/electric vehicles.
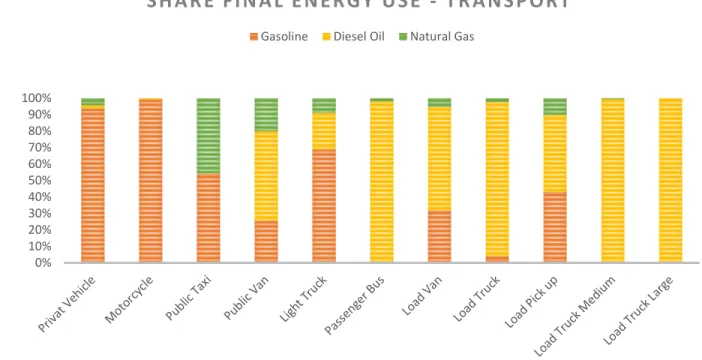
Gasoline, Diesel Oil and Natural Gas are default fuels, as shown below, and there is still no share on any of the categories for hybrid nor for electric vehicles
Following, it is shown how behind Colombian legislation is regarding the emissions limits for purchased cars, which leads to a further increase on emissions per vehicle in comparison to European countries for example.
0% 10% 20% 30% 40% 50% 60% 70% 80% 90% 100%
S H A R E F I N A L E N E R GY U S E - T R A N S P O RT
Gasoline Diesel Oil Natural Gas
Old fleet and the lag on proper government incentives and legislation end up in a higher fuel consumption and hence in larger GHG emissions. Possible future scenarios include a minimum share of hybrid/electric vehicles in the whole total (at least for private vehicles and Taxis), reduction of diesel vehicles fleet hence increasing GDP by some points due to the lower expenses in health services and stronger emissions standards policies, lowering the remaining share of old vehicles that do not comply with these norms.
2.1.2 Industrial Sector
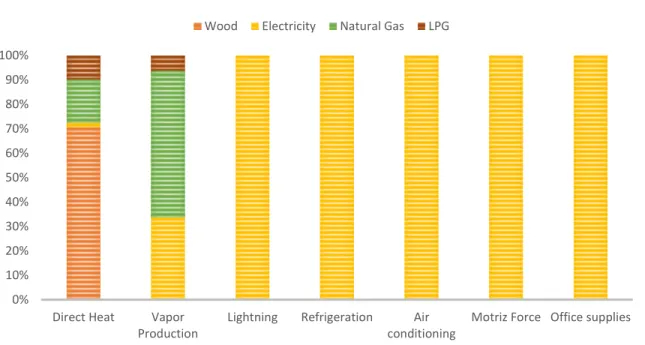
Since direct heat and vapor generation have the largest share in the total energy use in the industrial sector, boilers and heaters are the appliances that have the biggest impact on the sector efficiency and on the sector total emissions.
Motors are mainly fueled by electricity, which comes primarily from hydro power plants, as it will be discussed further in this text. Hence, driving force is not to be considered as a final use that affects significantly the total sector emissions. Office supplies, Air conditioning, refrigeration and lightning sum up less than 5% of the total energy use, and every of them are fed by electricity, so this is similar case as the one of driving force, since electricity in average years (No Niño nor Niña phenomenon year) is produced by hydro power plants. Nevertheless, this is a good introduction point for the low efficient appliances: even if only 5% of final energy in industrial sector goes to “household supplies” (lightning, air conditioning, etc.), the same supplies and its low efficiency have bigger impacts in other sectors, such as commercial and residential, since the number of these devices is larger. More on this will be discussed in commercial and residential sector sections.
COLOMBIA - •4000 ppm Sulfur emissions - •4000 ppm Sulfur emissions -•4000 ppm Sulfur emissions 2008 •Euro II 2009 •2000 ppm Sulfur emissions 2010 •Euro III 2013 •Euro IV 2018 •Euro V 2023 •Euro VI EUROPE 1998 •Euro II 1999 •Euro III 2005 •Euro IV 2009 •Euro V 2014 •Euro VI
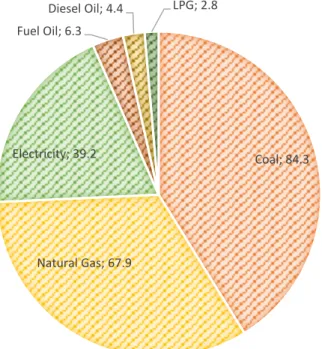
As shown in the Figure 7, Coal is the most used fuel in Colombian Industry. Here is to be said, that Colombia exported in 2017 a record of 105 million tons of Coal and in average it exports 85 million tons yearly [13]. From all the Coal that Colombia extracts, it exports 95%, only 5% goes to internal use [14]. Nevertheless, one of the main goals set in the United Nations Framework Convention on Climate Change held in Paris is to leave the fossil fuels under the earth, and more specifically, many countries agreed on reduce by 50% their current coal consumption on 2030 and to totally suppress its use by 2050 [15]. This decision, which in one hand is good for the environment, in the other hand affects the economy (GDP) of Colombia, since the countries that agreed on reduce its coal consumption have a share of more than 80% on the total Colombian coal exportation.
A possible future scenario includes the reduction on GDP due to the unpurchased coal, which exportation sales contributes with approximately 1.5% of the total GDP.
Natural Gas has also a large portion on the final use in industrial sector, and this fact has a drawback: natural gas reserves in Colombia will not last long. After years of exploration the number of unmined fields is not growing, it fact it has been said that it will be over by 2025. Nothing depending fully or high-partially on natural gas will be economically beneficial.
Direct Heat 52% Vapor Production 33% Lightning 1% Refrigeration 1% Air conditioning 1% Driving Force 12% Office supplies 0%
S H A R E O F F I N A L U S E I N TOTA L E N E R GY C O N S U M E D I N
I N D U ST R IA L S EC TO R
0% 10% 20% 30% 40% 50% 60% 70% 80% 90% 100%
Direct Heat Vapor Production
Lightning Refrigeration Air conditioning Motriz Force Office supplies
S H A R E F I N A L E N E R G U S E - I N D U S T R I A L
Electricity Natural Gas LPG Coal Diesel Oil Fuel Oil
Figure 6 Share Final Energy Use - Industrial
Coal; 84.3 Natural Gas; 67.9 Electricity; 39.2 Fuel Oil; 6.3 Diesel Oil; 4.4 LPG; 2.8
U S E O F E N E R GY S O U R C E I N I N D U ST R I A L S EC TO R PJ
2.1.3 RESIDENTIAL SECTOR
Most of rural areas in Colombia are difficult to access. Mountains, deep jungles and dangerous rivers cross from north to south this country, making any social venture and development hard to achieve. As a first example, natural gas pipe lines have not reached the whole territory, and neither has electricity grid. That is why wood has still the largest percentage in the fuel uses, it is mainly used as heat source in rural areas.
Wood 52% Electricity 26% Natural Gas 15% LPG 7%
E N E R GY U S E BY S O U R C E R ES I D E NT I A L S EC TO R
Figure 9Energy Use by Source, Residential Sector
Direct Heat 73% Refrigeration 10% Office supplies 7% Lightning 4% Vapor Production 3% Motriz Force 2% Air conditioning1%
S H A R E F I N A L E N E R GY U S E R E S I D E N T I A L S EC TO R
In Urban areas, home appliances have a higher share in the final energy use. The current existing house appliances are old and inefficient, increasing then the energy consumption by household [16]. Colombia has no heating systems, in cold cities people are used to wear warm clothes and cover themselves instead of using interconnected heating pipelines. Some old houses have chimneys, but that is not the rule. On the other hand, what is mostly found in every Colombian household is a ventilator and/or air conditioning device, this is due to the fact that most places with access to electricity have an average yearly temperature above 25°C. Colombia is on the equator, therefore, there are no seasons and the temperature tends to be constant along the year.
Possible future scenarios for this sector will include following: if world average temperature raises, the air conditioning and refrigeration system will demand more energy, which will be mostly supplied by thermoelectric plants or renewable sources as soon and/or wind since the water availability decreases when temperature increases so hydro power plants cannot be fully utilized.
2.1.4 COMMERCIAL SECTOR
This sector has the lowest energy use of this analysis. However, it contributes to almost 9% of the total GDP, which means this sector is not very energy intensive.
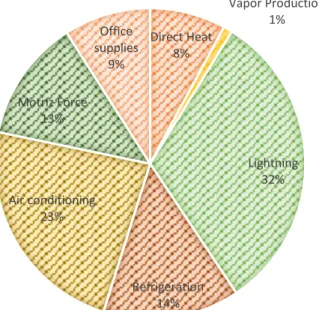
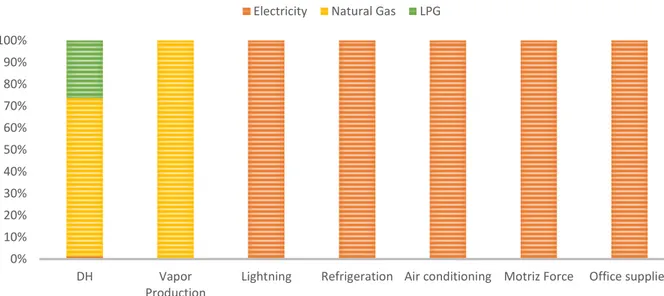
As expected, commercial sector does not involve many activities that require direct heat or water vapor, offices appliances and refrigeration have the largest share in energy use of this sector. Air conditioners, fridges, ventilators and light bulbs efficiencies are the ones that affects the total energy use, which has as main source the electricity.
0% 10% 20% 30% 40% 50% 60% 70% 80% 90% 100%
Direct Heat Vapor Production
Lightning Refrigeration Air conditioning
Motriz Force Office supplies
S H A R E F I N A L E N E R GY U S E - R E S I D E N T I A L
Wood Electricity Natural Gas LPG
Direct Heat 8% Vapor Production 1% Lightning 32% Refrigeration 14% Air conditioning 23% Motriz Force 13% Office supplies 9%
S H A R E O N F I N A L U S E C O M M E R C I A L S EC TO R
Figure 11 Share on Final Use Commercial Sector
Electricity 91% Natural Gas 7% LPG 2%
F I N A L E N E R GY U S E BY S O U R C E I N C O M M E R C I A L
S EC TO R
2.2 COLOMBIAN POWER GENERATION
Thanks to the privileged number of river basins present in Colombia the power generation matrix has a big portion of hydro power plants. Almost 70% of installed power, which supplies the national grid, comes from hydro power plants placed all around the country [8]. Power plants have not reached just a few areas; these areas are by coincidence the poorest zones in Colombia, such as La Guajira, in the deserted north part of the country.
Coalmines are also a good source of fuel for thermoelectric plants. Coal is mainly used to feed power plants near the coalmines, as it happens in the Atlantic Zone and in Boyacá [17] [14].
Thermoelectric plants are mainly fed with natural gas, which could become a problem in the future since there have not been found outstanding natural gas reservoirs, and according to expert’s opinions, it might be over by 2025, which means the fuel cost will increase and hence the total operation plant costs will increase.
Future scenarios in Colombian power consider that when global temperature increases, the level of water deposits decreases and hence the power coming from hydro power plants also decreases. But the latter triggers a chain reaction, because in countries like Colombia, where the power comes weather from hydro sources or from burning fossil fuels, if the first is not available then more fuels will be used, increasing then the total emissions and contributing to the global damage caused by greenhouse gases.
0% 10% 20% 30% 40% 50% 60% 70% 80% 90% 100% DH Vapor Production
Lightning Refrigeration Air conditioning Motriz Force Office supplies
S H A R E F I N A L E N E R GY U S E - C O M M E R C I A L
Electricity Natural Gas LPG
Incentives for installation of renewable energy plants are still doing baby steps in Colombia, with a wind park of 18 MW and total solar power installed of 100 MW circa to the date, the country is still far behind on the renewable field. Truth is, hydro power plants work well under normal climate conditions, however, after all the expected changes due to global warming, and a minimum share of renewable energy must be encouraged in order to guarantee electricity supply. Moreover, renewable energy sources are the best solution for remote rural areas, because nowadays still more than 3% of total population (approximately 1.700.000 people) have no access to the national grid, which means their electricity comes mainly from diesel motors, which work less than 12 hours a day, or they simply have no electricity.
Zones with no electricity have an economy which lags behind if the national average, and their social situation is very vulnerable (no electricity leads to no hospitals/schools, no refrigeration for provisions of any kind and almost no way to make industry nearby).
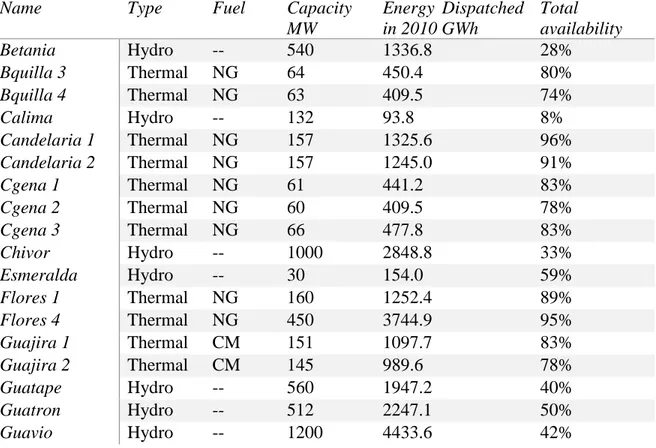
Therefore, it is necessary to consider in future scenarios the penetration of solar, wind and biomass as energy sources to supply and bring stability to the non-interconnected areas. As mentioned before, hydro power plants have the largest share in the total power generation system; however, this does not mean that they dispatch as much energy as they were designed to. In El Niño phenomenon years, the availability of some plants reaches levels of less than 30% their installed capacity, and there is when thermoelectric plants reach more than 95% of their installed capacity. Following it is shown the dispatching orders in year 2010 of the generation plants connected to the national grid.
Table 1 Power plants on a year of El Niño phenomenon (2010)
Name Type Fuel Capacity
MW Energy Dispatched in 2010 GWh Total availability Betania Hydro -- 540 1336.8 28% Bquilla 3 Thermal NG 64 450.4 80% Bquilla 4 Thermal NG 63 409.5 74% Calima Hydro -- 132 93.8 8% Candelaria 1 Thermal NG 157 1325.6 96% Candelaria 2 Thermal NG 157 1245.0 91% Cgena 1 Thermal NG 61 441.2 83% Cgena 2 Thermal NG 60 409.5 78% Cgena 3 Thermal NG 66 477.8 83% Chivor Hydro -- 1000 2848.8 33% Esmeralda Hydro -- 30 154.0 59% Flores 1 Thermal NG 160 1252.4 89% Flores 4 Thermal NG 450 3744.9 95% Guajira 1 Thermal CM 151 1097.7 83% Guajira 2 Thermal CM 145 989.6 78% Guatape Hydro -- 560 1947.2 40% Guatron Hydro -- 512 2247.1 50% Guavio Hydro -- 1200 4433.6 42%
Jaguas Hydro -- 170 387.3 26% La Tasajera Hydro -- 306 1288.9 48% Merilectrica Thermal NG 169 1367.2 92% Miel I Hydro -- 396 604.2 17% Pagua Hydro -- 600 4376.2 83% Paipa 1 Thermal CM 31 214.4 79% Paipa 2 Thermal CM 70 553.1 90% Paipa 3 Thermal CM 70 503.5 82% Paipa 4 Thermal CM 150 1255.5 96% Playas Hydro -- 201 1166.2 66% Porce II Hydro -- 405 1294.5 36% Prado Hydro -- 46 66.0 16% Salvajina Hydro -- 285 592.6 24%
San Carlos Hydro -- 1240 4735.2 44%
San Francisco Hydro -- 135 196.9 17%
Tasajero 1 Thermal CM 151 1313.8 99% Tebsab Thermal NG 791 6220.9 90% Termocentro Thermal NG 278 2266.2 93% TermoDorada Thermal NG 51 316.5 71% TermoEmcali Thermal NG 229 1707.0 85% TermoSierra Thermal NG 460 3208.4 80% TermoValle Thermal NG 205 1612.0 90% Urra Hydro -- 338 697.1 24% Yopal2 Thermal NG 30 221.5 84% Zipa5 Thermal CM 64 476.8 85% Zipa2 Thermal CM 34 283.6 95% Zipa3 Thermal CM 63 531.0 96% Zipa4 Thermal CM 64 540.0 96% 3 MARKAL MODEL
MARKAL, an acronym for MARKal ALlocation, is a demand driven linear programming model. It works in a horizon period, where all the exogenous end-use demands are satisfied (as the ones presented in chapter 2.1). In the present analysis a standard MARKAL model will be used, which means that the demand will be a fully exogenous input and it will not respond to price changes [18].
Bottom-up models such as the Standard MARKAL are very detailed models, they are focus on the technologies related to the energy sector of a region, as part of an economy branch of it. . Very detailed inputs, outputs, unit costs and several other technical and economic characteristics of every energy using technology are part of this kind of models. All technologies are logically linked together by means of their “resources” and “products”,
which could be energy carriers, materials emissions and/or energy services, all of them constitute the bottom-up model. In the MARKAL model, the production of one unit (it could be a billion vehicle kilometers of motorcycle service or a Petajoule of industrial direct heat service) is possible by using a mix of individual technologies’ outputs (e.g. industrial direct heat produced by coal or natural gas). Therefore, the production function of a sector is implicitly, rather than explicitly built as in more aggregated models (Top-down models). Such implicit production functions may be quite complex, depending on how detailed the energy system is described, and in the case of MARKAL, it has to be pointed that the level of details is very high.
When the types of energy demand are defined per year, i.e. annual steam production, residential lightning, kilometers travelled by a single taxi, etc., it is possible to set the technologies that are going to meet the demand. These technologies are at all levels of an energy system, from mining of primary energies to transformation technologies (as refineries and power plants), from secondary fuels to technologies which will actually meet the demand such as diesel fueled taxis or incandescent light bulbs, just for giving some examples. In this case, the demand on years 2010 and 2015 are known, and the ones until year 2050 are developed taking as basis the economic and demographic projections, such as the GDP projections found on the OECD Database.
The more details given in the technology part, the better the model determines the group of technologies and fuels with the less cost over the forecast period. This is a cost effective model.
More on MARKAL model, the code behind and how its structure works (variables, objective functions and constraints) can be found on Annex A.
4 MARKAL INPUTS
4.1 DEMAND DRIVERS
This model is a demand driven one, which means that the demand projections are as important as the details given for each energy-use technology, the model will carry out a good optimization and results can be well assessed only if the future periods’ demand represent in the most accurate way the Colombian economy-population dynamics.
The Organization for Economic Co-operation and Development, OECD, has available for public use Real Gross Domestic Product (GDP) forecasts. The available forecasts go from global level, going through regions level, until reaching the country level.
The entity in Colombia in charge of economy statistics and population projections is the DANE (Departamento Administrativo Nacional de Estadística, National Administrative Department of Statistics). Everything related to the economy sector in numbers can be found in DANE Data bases, data and lists of such records as imported/exported quantities, gross domestic product by economy activity (industrial, commercial, transportation, etc.) and population historic data and forecast, are only few examples of the wide spectrum made available by DANE.
On the other hand, the Mines and Energy planning department of the Colombian government, UPME by its initials in Spanish (Unidad de Planeación Minero Energética), has the record of the energy use by type of energy source and by type of end-use sector and it is updated until year 2016 [8]. For example, it is possible to know how many energy units of coal were consumed by the industrial sector in year 2010.
In order to determine and to detail which is the final use of each energy carrier (fuels and electricity for example) different studies and publications made by UPME were used. The aim of these studies is to find out which are the hot points of the whole energetic matrix in which some changes can be made in order to reduce consumption. These studies were very useful for the analysis carried out in this thesis, since they have detailed data about end-use demands of Industrial, Commercial and Residential sectors and also gave some hints of which could be the improvement in the appliances efficiency in the near future. All this data is included in the different energy-use technologies of MARKAL, since efficiencies, residual capacity and past years energy use records are part of the Energy System items. Plus, as mentioned before, the more detailed the model, the better the assessment of future scenarios. Transportation sector has a different set of reports used to determine its end-use demands. These reports are still made by the UPME but referred to urban and interurban transportation. The first report is used to find the share of each transportation type that uses a certain fuel, i.e. for example how many private vehicles use gasoline and how many use natural gas in the urban area [19]. A second report is used to calculate the average of kilometers by energy unit which belong to each vehicle category and fuel category [20] [21]. This is done because unlike the other sectors, which use energy units in MARKAL (Petajoules), the transportation sector uses billion of kilometers per year made by the whole vehicle type fleet in order to assess its total demand. Both quantities, petajoules and billions of kilometers per year, are equally valid at the moment of assessing an energy system, everything relays in how many details and how good and valid are these details to represent the real scenarios.
The results of the asses of the different studies, reports and records made available by UPME have been already shown in a succinct way in chapter 2, where Colombian energy system was described. All end-use quantities are calculated for both year 2010 and year 2015, and these will be the learning base for the MARKAL model.
Now, as the model already has reported data for the “past”, it is needed to determine which will be the drivers for the “future”. OECD GDP forecast, which was mentioned at the beginning of this chapter, is the one used to determine the grow rate of the demand on each sector, excluding only residential sector, which use a forecast base for the population projections made by DANE and United Nations UN, more details on this will come later on this document.
Industrial, commercial and transportation activities have a big share in Colombian Gross Domestic Product. Nevertheless, even if all of these economic activities follow a similar behavior as the whole, the fraction or elasticity at which they relate to the GDP might differ by some points. Following it is shown how the projections of Demand for each sector is calculated, taking as base GDP and UN projections.
4.1.1 Growth rate and Elasticity
In the figure below it is shown the OECD forecast for Colombian GDP [22]. It shows how bad economy went at the end of last century due to a stock market bubble. People back then got more credit than what they could pay for. In terms of growth rate, 1999 internal crisis was worse than 2009 world crisis for Colombian Economy.
The following is taken textually from OECD source: “Forecast is based on an assessment of the economic climate in individual countries and the world economy, using a combination of model-based analyses and expert judgment.”
In general terms, OECD forecast show a worldwide slowdown in economy growth, only few countries, such as India, will have positive slope in the growth rate.
General GDP values are the first step on projecting the end-use demands for MARKAL until year 2050. As base principle, the main assumption is that end-use energy demands of each economy sector are proportional to the economic growth thereof.
In order to assess how each sector behaves with respect to the total GDP, it is calculated the relationship between growth rates of each one for the past ten years. This relation shows in how many units each sector changes with regard to a unit change in the total GDP, it will be called from now on as elasticity.
Industrial sector contributes with 15% of the total GDP, in average, which means that growth behaviors of both have a similar shape. The elasticity of industrial sector is showed in the figure below. -6 -4 -2 0 2 4 6 8 0 200000 400000 600000 800000 1000000 1200000 1400000 1600000 1980 1990 2000 2010 2020 2030 2040 2050 2060 G R O W TH R A TE % GDP MUS D
OECD GDP Projection for Colombia
Commercial sector grows almost proportionally to the total GDP. It has a share of circa 9% on the total Colombian economy activity, and even if it’s a low energy-intensive sector, its contributions are still of high value in future scenarios projections. Below it is shown its elasticity and its change rate for the past ten years. This sector is closer than industrial one to the total GDP change rate shape.
Figure 15 Commercial Sector Economy Rate of Change 0 0.2 0.4 0.6 0.8 1 1.2 1.4 -2 0 2 4 6 8 10 2004 2006 2008 2010 2012 2014 2016 2018 EL A ST ICI TY CH A N G E R A TE %
Rate of change Commercial sector and total GDP / Elasticity GDP
GDP Commercial Elacticity 0 0.5 1 1.5 2 2.5 3 3.5 -6 -4 -2 0 2 4 6 8 10 2004 2006 2008 2010 2012 2014 2016 2018 EL A ST ICI TY CH A N G E R A TE %
Rate of change Industrial sector and total GDP / Elasticity GDP
Industrial GDP Elasticity
The last of the economic sectors which demand drivers are based on GDP projection is the transportation one. Its contribution to total emissions and its energy consumption are the
largest compared to the commercial and industrial sectors, which makes any demand change to have a large impact in the whole energy system. The change rate of this sector does not follow the shape of the total GDP as acute as commercial sector does, but its behavior still does follow the general Colombian development.
As a result of the elasticity analysis it is possible to relate the data already available, which is the OECD GDP projection, with the economy of each single sector. Table 2. shows the average elasticity value, this value is used to calculate the growth rate of each sector in the time horizon of MARKAL, which is from year 2020 to year 2050.
Table 2 Sectors Elasticity with respect to Total GDP
Sector Elasticity Industrial 0.676
Commercial 1.042
Transportation 0.823
Residential Sector growth forecast is not related to GDP, but to population projections. The United Nations published on 2017 the last of their population estimates and projections, which is called “World Population Prospects 2017” [23]. These projections have been made by the Population Division of the Department of Economic and Social Affairs of the United Nations Secretariat, and their methodology is as taken from UN Webpage: “The method takes into account the past experience of each country, while also reflecting uncertainty about future changes based on the past experience of other countries under similar condition”.
0 0.2 0.4 0.6 0.8 1 1.2 1.4 -2 -1 0 1 2 3 4 5 6 7 8 2004 2006 2008 2010 2012 2014 2016 2018 EL A ST ICI TY CH A N G E R A TE %
Rate of change Transportation sector and total GDP / Elasticity GDP
GDP Transportation Elasticity
The median of the UN projections for Colombian population foresees a decrease in population starting around year 2040, as shown in Figure 17. The same phenomena is foreseen for South-America and Europe, which population starts decreasing by the mid of the century. North America and Northern Europe have a constant growth, according to UN projections their growth rate has no negative values along this century.
Above shown elasticity and growth rates lead to a proper projection of demands for MARKAL model. The latter together with historic data (years 2010 and 2015) are taken as base to assess the forecast of drivers.
4.1.2 Energy End-Use demands
Petajoules is the energy unit by default on MARKAL, it is not as common as GWh or as toe (Tone of oil equivalent). Industrial, commercial and residential sectors demands are measured in Petajoules per year, on the other hand transportation sector is measured in billions of kilometers per year.
Having as base the end-use energy consumption in year 2010 and in year 2015 plus elasticity and growth rate, it is possible to calculate the projected demands, which are also the drivers of MARKAL. Business as usual (BAU) MARKAL scenario has as inputs the demands showed in Figure 18, Figure 19, Figure 20 and Figure 21, for the Industrial, Commercial, Residential and Transportation sectors, respectively, which are based on the OECD and UN data bases for GDP projection and Population projection, correspondingly. The value equivalent to points at years 2010 and 2015 are historic values, they do not belong to the projections part, but they are taken from the studies made by UPME in the past years [8], as mentioned in previous sections, and hence these values are accurate with respect to the real situation going on in the Colombian energy system
-0.4 -0.2 0 0.2 0.4 0.6 0.8 1 1.2 1.4 2005 2010 2015 2020 2025 2030 2035 2040 2045 2050 2055 2060 GROWTH RATE %
PO PULAT I O N G ROW T H RAT E 2 0 1 0 - 2 0 5 0
0.00 20.00 40.00 60.00 80.00 100.00 120.00 2005 2010 2015 2020 2025 2030 2035 2040 2045 2050 2055 PJ I NDUST RI A L DE MA N D PROJECT I O N S
DM: Industrial Steam DM: Industrial Motriz Force DM: Industrial Direct Heat DM: Industrial Refrigeración
DM: Industrial Compresors DM: Industrial Lightning DM: Industrial Office Equipment DM: Industrial Air Conditioning
0.00 2.00 4.00 6.00 8.00 10.00 12.00 14.00 16.00 2005 2010 2015 2020 2025 2030 2035 2040 2045 2050 2055 PJ
CO MME RCI A L DE MA N D PROJECT I O NS
DM: Commercial Water Heater DM: Commercial Motriz Force DM: Commercial Direct Heat
DM: Commercial Refrigeración DM: Commercial Lightning DM: Commercial Office Equipment
DM: Commercial Air Conditioning
Figure 18 Industrial Demand Projections 2010-2015
0.00 10.00 20.00 30.00 40.00 50.00 60.00 70.00 80.00 90.00 2005 2010 2015 2020 2025 2030 2035 2040 2045 2050 2055 BI LL IO N KMS /Y EA R
T RA NSPO RTAT I O N DE MA ND PROJECT I O N
DM: Transport Marine Passenger And Load DM: Transport Road Passenger Privat Vehicle
DM: Transport Road Passenger Privat Motorcycle DM: Transport Road Passenger Public Taxi
DM: Transport Road Passenger Public Van DM: Transport Road Passenger Light Truck (campero)
DM: Transport Road Passenger Bus DM: Transport Road Load van (furgoneta)
DM: Transport Road Load truck DM: Transport Road Load Pick up
DM: Transport Road Load truck medium (volqueta) DM: Transport Road Load truck large (tractocamion)
0.00 5.00 10.00 15.00 20.00 25.00 30.00 35.00 40.00 45.00 2005 2010 2015 2020 2025 2030 2035 2040 2045 2050 2055 PJ RESI DE NT I A L DE MA N D PROJECT I O N S
DM: Residential Water Heater DM: Residential Motriz Force DM: Residential Direct Heat
DM: Residential Refrigeración DM: Residential Lightning DM: Residential Other Equipment
DM: Residential Air Conditioning
Figure 20 Residential Demand Projections 2010-2050
As a last part of this section, it is shown in Figure 22 the growth rate for each sector demand. This is the base growth rate for the BAU scenario. As part of the analysis carried out in this thesis, variations of this growth rates will be assessed and compared among themselves. Variation such as ±10%, 30%, and 50% regarding the base complement the spectrum/range of the outputs of the model.
4.2 End-Use Technologies Efficiency
The energy system is made by different technologies that link the energy sources with the end-use demands. As an example, a technology is in charge of extracting the coal of a mine, another technology uses that coal to produce electricity and then an end-use technology uses that electricity to supply the residential lightning demand in a certain year.
As in every single conversion process, in the MARKAL energy system there are losses related to each technology. These losses depend on the exogenous efficiency set by the user. For this section it is taken as reference the study made by UPME [24], which is still under revision but a first copy was provided by the UPME administration department after being requested. This study includes the average efficiency of all the appliances related to final use of energy, from light bulbs to industrial boilers.
A summary of these efficiencies are shown in Table 3, Table 4, and Table 5 for Industrial, Commercial and Residential sector, respectively. As it is presented, there is an efficiency value by technology and by energy carrier (fuel).
-1 0 1 2 3 4 5 2005 2010 2015 2020 2025 2030 2035 2040 2045 2050 2055 G R O W TH R A TE %
DE MA ND G ROW T H RAT ES FO R EACH ECO N O MY SECTO R
Industrial Commercial Residential Transportation
Table 3 Industrial Energy End-Use Technologies Efficiency
Industrial Energy End-Use Technology Efficiency
Industrial Steam Biomass 0.4100
Industrial Steam Petroleum 0.7600
Industrial Steam Carbon Mineral 0.6500
Industrial Steam Fuel Oil 0.5300
Industrial Steam Diesel Oil 0.5300
Industrial Steam Electricity 0.6900
Industrial Steam Kerosene 0.5300
Industrial Steam Liquified Petroleum Gas 0.6300
Industrial Steam Natural Gas 0.6900
Industrial Motriz Force Diesel Oil 0.4400
Industrial Motriz Force Fuel Oil 0.4000
Industrial Motriz Force Electricity 0.6300
Industrial Direct Heat Petroleum 0.4500
Industrial Direct Heat Carbon Mineral 0.4100
Industrial Direct Heat Fuel Oil 0.5900
Industrial Direct Heat Diesel Oil 0.6500
Industrial Direct Heat Liquified Petroleum Gas 0.6300 Industrial Direct Heat Electricity 0.7400
Industrial Direct Heat Natural Gas 0.6300
Ind. Other Electric Devices-ELC 0.6900
Ind. Other Processes - Fuel Share 1.0000
Industrial - Construction Fuel Share 1 0.9000
Industrial Lightning Electricity 0.1100
Industrial Lightning Electronic Bulb-ELC 0.0900
Industrial Lightning Fluorescent Bulb-ELC 0.1000
Industrial Lightning Incandescent Bulb-ELC 0.0200
Industrial Office Equipment Electricity 0.6900
Industrial Refrigeration Electricity 0.6900
Industrial Air Conditioning 0.6900
Industrial Compressors Electricity 0.6900
Table 4 Commercial Energy End-Use Technologies Efficiency
Commercial Energy End-Use Technology Efficiency Commercial Direct Heat Carbon Organic 0.5000
Commercial Direct Heat Electricity 0.9000
Commercial Direct Heat Liquified Petroleu Gas 0.4000 Commercial Direct Heat Natural Gas 0.4000
Commercial Lightning Electronic Bulb-ELC 0.1200
Commercial Lightning Fluorescent Bulb-ELC 0.1000
Commercial Lightning Incandescent Bulb-ELC 0.0200
Commercial Office Equipment Electricity 0.9500
Commercial Refrigeration Electricity 0.3300
Commercial Water Heater Electricity 0.9500
Commercial Water Heater LPG 0.8000
Commercial Water Heater Natural Gas 0.8000
Commercial Air Conditioning Electricity 0.3900
Table 5 Residential Energy End-Use Technologies Efficiency
Residential Energy End-Use Technology Efficiency Residential Direct Heat Carbon Organic 0.5000
Residential Direct Heat Electricity 0.8000
Residential Direct Heat LPG 0.3700
Residential Direct Heat Natural Gas 0.3500
Residential Direct Heat Wood 0.1000
Residential Lightning Electronic Bulb-ELC 0.0900
Residential Lightning Fluorescent Bulb-ELC 0.1000
Residential Lightning Incandescent Bulb-ELC 0.0200
Residential Other Equipment Electricity 0.9500
Residential Motriz Force Electricity 0.7500
Residential Refrigeration Electricity 0.6000
Residential Air Conditioning Electricity 0.5000
Residential Water Heater Electricity 0.9500
Residential Water Heater LPG 0.8000
Residential Water Heater Natutal Gas 0.8000
Regarding the transportation sector, as the energy demand is given in billion kilometers per year, it is necessary to use the vehicle average fuel efficiencies reported for the vehicle fleet in Colombia [21]. The Department of Transport has available for the public a series of reports and studies with historic data of Colombian vehicle fleet [21] [19]. A study about the kilometers per gallon of fuel is used as base of calculation for the MARKAL efficiencies inputs. Table 6 shows how many billion kilometers are covered by each vehicle type, when they consume one Petajoule of each energy carrier (fossil fuel). The previous mentioned study does not include electric vehicles, since its use share in Colombia is negligible, nevertheless, for projections of future years and scenarios with a larger use share of electric vehicles, it is taken a value of efficiency of 16,5kW/100 km is taken.
Table 6 Vehicles Efficiency by Fuel Type
Vehicle Type Fuel Billion Kilometers /
Petajoule
Transport Road Passenger Private Vehicle
Transport Road Passenger Private Vehicle
Diesel Oil 0.2879 Transport Road Passenger Private
Vehicle
Natural Gas Comp.
1.1979 Transport Road Passenger Private
Vehicle
Biodiesel 10% 0.3152 Transport Road Passenger Private
Vehicle
Bioethanol 10% 0.3749
Transport Road Passenger Private Motorcycle
Gasoline 0.9965
Transport Road Passenger Public Taxi Gasoline 0.3214 Transport Road Passenger Public Taxi Bioethanol 10% 0.3749 Transport Road Passenger Public Taxi Diesel Oil 0.2879 Transport Road Passenger Public Taxi Natural Gas
Comp.
1.1979
Transport Road Passenger Public Van Gasoline 0.2813 Transport Road Passenger Public Van Diesel Oil 0.2519 Transport Road Passenger Public Van Natural Gas
Comp.
1.0481
Transport Road Passenger Light Truck Gasoline 0.2813 Transport Road Passenger Light Truck Diesel Oil 0.2519 Transport Road Passenger Light Truck Natural Gas
Comp.
1.0481
Transport Road Passenger Bus Diesel Oil 0.1295 Transport Road Passenger Bus Natural Gas
Comp.
0.5390
Transport Road Load van Gasoline 0.2813
Transport Road Load van Diesel Oil 0.2519 Transport Road Load van Natural Gas
Comp.
1.0481
Transport Road Load truck Gasoline 0.1607 Transport Road Load truck Diesel Oil 0.1799 Transport Road Load truck Natural Gas
Comp.
0.7487
Transport Road Load Pick up Gasoline 0.2813 Transport Road Load Pick up Diesel Oil 0.2519
Transport Road Load Pick up Natural Gas Comp.
1.0481
Transport Road Load truck medium Diesel Oil 0.1439
Transport Road Load truck medium Natural Gas Comp.
0.5989
Transport Road Load truck large Diesel Oil 0.0864
4.2.1 Technologies CAPEX [25] [26] [27] [28]
Cost of investment in new technology affect the model decisions, after calculating the present value of CAPEX and OPEX of each technology by energy unit, it is possible to optimize in a cost effective way the combination of technologies which will supply be linked together until use demands are fully covered. Following table shows the capital cost of each end-use technology. Also the Operation Cost of some technologies that are included in the model (such as boilers) are shown.
Table 7 CAPEX of End-use Demand Technologies
Technology Energy carrier MUSD/PJ
Aire Acondicionado ELC Electricity 4.6663
DH Stove ELC Electricity 0.9383
DH Stove NG Natural Gas 1.2516
DH Stove LPG LPG 1.3377
Lightning electronic Electricity 1.8328
Lightning fluorescent Electricity 0.5610
Lightning incandezcent Electricity 0.2040
Motrix Force ELC Electricity 11.1286
Commercial Office Equipment Electricity 52.6850
Commercial Refrigeration Electricity 6.9934
Commercial Water Heater ELC Electricity 13.1288
commercial water heater NGA Natural Gas 1.2600
commercial water heater LPG LPG 1.5748
Motriz Force ELC Electricity 2.8270
Motriz Force dso Diesel Oil 3.2000
Motriz Force FO Fuel Oild 3.4000
Steam Capital Coal/Biomass libras/kW 2010 Bagaze 2.5952
Steam O&M Coal/Biomass libras/kW 2010 Bagaze 0.1301
Steam Capital Coal/Biomass libras/kW 2020 Bagaze 2.1543
Steam Capital gas libras/kW 2010 Natural Gas 0.3398
Steam O&M gas libras/kW 2010 Natural Gas 0.1229
Steam Capital electric libras/kW 2010 Electricity 1.0916
Steam Capital oil fired million libras/TW 2010 Diesel Oil 0.2675
Steam O&M oil fired million libras/TW 2010 Diesel Oil 0.0217
4.2.2 Power Generation Technologies
Colombian government department in charge of electrical production has available for the public in detail the cost of new capacity of power generation technologies. A large spectrum of technologies that can be installed in Colombia are included. In order to do a more accurate analysis of the possible combination of generation technologies, all of the technologies, which are considered possible by the Colombian government, are included in the current MARKAL model. Below it is shown each technology, and some deatails such as capacity, capital cost, fixed annual cost and variable annual cost. The final combination of power generation technologies resulting at the end of the run of all scenarios is shown in the Results section.
Generation Technology Cap
acity MW CAPEX MUSD/GW FIXOM MUSD/G W-AÑO VAROM MUSD/PJ Plant factor Photovoltaic 20 3801.71 65.87 0.1642 Photovoltaic 85 2718.81 56.78 0.1642 Photovoltaic 150 2566.8 55.11 0.1642 Wind 10 7,965,265.10 78,886.43 0.1153 Wind 50 3,610,593.61 59,749.68 0.124 Wind 100 3,018,039.39 56,053.07 0.1268 Coal Thermoelectric 70 1,269.18 77.06 2.02 0.4382 Coal Thermoelectric 150 1,179.86 75.78 2.02 0.4382 Biomasa Bagazo 10 2,909.84 189.98 1.17 0.4171 Biomasa Bagazo 40 1,925.20 133.85 1.17 0.4171
Combined Cycle Natural Gas 200 1,495.65 43.89 0.91 0.5829
Combined Cycle Natural Gas 500 1,363.52 42.4 0.91 0.5829
Natura Gas Thermoelectric 10 2,185.86 51,201.23 3.76 0.5829
Natura Gas Thermoelectric 100 1,245.49 33,948.80 3.76 0.5829
Natura Gas Thermoelectric 1000 1,064.30 31,352.03 3.76 0.5829
Hydroelectric with reservoir 600 2,272.61 33.82 0.7
Hydroelectric with reservoir 1500 1,679.94 33.95 0.7
Small Hydroelectric 10 2,608.32 83.95 0.78 Small Hydroelectric 50 1,801.53 71.36 0.78 Geothermal flash 30 7,478.57 163.54 0.4027 Geothermal flash 100 6,993.32 157.96 0.4027 Thermosolar 50 8,475.48 151.06 0.3663 Thermosolar 200 8,022.81 143.72 0.3663 Photovoltaic small 0.01 2,404.35 370.01 0.1075 Photovoltaic Small 0.05 2,372.12 340 0.1075 Photovoltaic Small 0.1 2,227.73 285 0.1075 MiniHydro 0.5 985.19 145.9 0.0156 MicroHydro 0.04 2,563.53 485.03 0.2736
4.2.3 Fossil Fuels reservoirs
Resources are not unlimited, and that fact plays a primary roll when doing projections in a long term time horizon. Coal is the most abundant fossil fuel in Colombia, followed by Petroleum and Natural Gas. There are two big reservoirs of coal in Colombia, one situated in the Atlantic coast, and other in the center of the country [14]. Same for Natural gas, Atlantic coast and center “Los Llanos” part of Colombia has the largest reservoirs of Natural Gas in the country [29]. Figure 23 shows the quantity of each fossil fuel expected to be available in each reservoir, in energy units (Perajoules)
Coal Atlantic; 221352.8 Coal Center; 77869.4 Natural Gas La Guajira; 1957.9 Natural Gas Los
Llanos; 5386.1 Petroleum ; 22623.8
C U M U L AT I V E R E S E R V O I R S A S I N Y E A R 2 0 1 9 , PJ
4.3 Alternative scenarios to BAU
- In the scope of this analysis the demand drivers are taken in a range of ±10%, ±30% and ± 50% of what is originally projected by OECD and the United Nations for GDP and Population Growth, respectively. These variations from the original projected demands could represent the savings/extra expenses, which could affect Colombian economy/population in the long term, as the ones mentioned in chapter 2.
As a total, there is a combination of 36 scenarios. These 36 scenarios are the result of six different demand drivers that depend on GDP, which are the industrial, commercial and transportation ones, and of six different demand drivers that depend on population growth, which is the population one.
A run of each of the above-mentioned 36 scenarios is made maintaining the remaining inputs constant, as the business as usual scenario; therefore, the main difference among these runs in the time horizon will be the final demand. As main goal from the latter, it is to assess how emissions and power generation plants share behave (how much power is generated from the different energy sources such as hydro, natural gas, biomass, etc.) under unexpected growing rates in the country. Furthermore, it is expected to assess which parameter between the economic and the population one has a larger weight on the total Colombian emissions and energy demand.
- As alternative scenario it is taken a definitive rise in the average temperature of Colombia which will lower the water reservoirs level, making the hydropower generation availability o have the same behavior as El Niño Phenomena years, it means, lower than 20% for some hydropower plants, as shown in Table 1. All above-mentioned 36 scenarios resulting from the combination of different demand drivers are run under this low Hydro availability condition. This exogenous condition for Hydro power plants forces the model to invest in diverse kinds of power generation plants, beside hydro plants.
- As a last overall set of scenarios, it is considered low hydro availability plus emissions cap plus net electricity imports equal to zero. Emissions cap might be a possible imposed solution in the long term due to the compromise the countries have to contribute to stop rising the temperature. The emission cap is set to be the 80% of the emissions expected from year 2030 in the BAU scenario. Just to make sure the power generation system complies with the emission cap, the imports of electricity are set to zero, because the energy source of the electricity imported is unknown, it could come from natural gas or coal fueled power plants placed either in Ecuador or in Venezuela. The only data available for imported electricity as input is the cost per Petajoules.

![Figure 4 Emissions standards/limits in Colombia and Europe [4]](https://thumb-eu.123doks.com/thumbv2/123dokorg/7522719.106218/14.918.90.709.107.547/figure-emissions-standards-limits-colombia-europe.webp)