ALMA MATER STUDIORIUM – UNIVERSITÀ DI BOLOGNA
SCUOLA DI INGEGNERIA E ARCHITETTURA
DICAM
Dipartimento di ingegneria civile, chimica, ambientale e dei materiali
CORSO DI LAUREA MAGISTRALE IN INGEGNERIA CIVILE Curriculum strutture
TESI DI LAUREA in
Progetto di strutture in legno
Strength prediction of the glulam beams based on the
information of knots in single lamellas
CANDIDATO: Lorenzo Bianchi
RELATORE:
Prof. Ing. Marco Savoia
CORRELATORI:
Prof. Dr. Ir. Jan-Willem van de Kuilen M.Sc. Ani Khaloian Sarnaghi
Dott. Ing. Milena Massari
TUM Technische Universität München
Anno accademico 2017/2018 Sessione III
AKNOWLEDGMENTS
First, I would like to thank Professor Marco Savoia, who provided me the opportunity to make this research experience.
I would like to thank Dott. Ing. Milena Massari for her assistance and interest in making this experience feasible.
I am obliged to Prof. Dr. Ir. van de Kuilen, which through his extensive knowledge and his positive criticism gave a significant contribution to my thesis work.
I express my sincere gratitude and a deep admiration to M.Sc. Ani Khaloian, from the academic as well as the personal point of view. Her interest and passion for her work were a source of constant motivation. Her help was monumental, not only under the academic point of view, but also personally. I will always remember your kindness and encouraging words, and sorry if sometimes I was a super disturbing office mate!
I owe a thank to all the colleagues from Holzfoschung. The working environment was the best a person could hope for, serious and professional but with no lack of fun and friendship. A thank to my friends, the ones I know my whole life, and the ones I got to know in Bologna and Munich. You always reminded me that life is colorful and also the biggest disappointment is not lasting forever. I will always keep in my heart the memories of these years, so far the best of my life.
I express my deep and affectionate thank to Chiara. Thanks to you, I have matured a lot and despite life took us in different directions, your sweet words of encouragement are still essential to me.
Finally, last but by no means least, I owe the biggest thank to my family, that gave me unconditioned love and support during my whole life, encouraging me in every choice I did, even if they meant costs and sacrifice.
This accomplishment would not have been possible without you all. Thank you.
1
INDEX
ABSTRACT ... 7 SOMMARIO ... 9 1 INTRODUCTION ... 11 1.1 OBJECTIVES ... 122 MATERIALS AND METHODS ... 13
2.1 FE MODEL ... 14
BOARDS GENERATED WITH RANDOM KNOTS ... 15
REAL TESTED BOARDS ... 15
TENSILE STRESS ANALYSIS ACCORDING TO EN 408 ... 16
FOUR POINT BENDING STRESS ANALYSIS ACCORDING TO EN 408 17 THREE POINT BENDING STRESS ANALYSIS ACCORDING TO EN 408 19 3 NUMERICAL ANALYSIS ON BOARDS GENERATED WITH RANDOM KNOTS ... 21
3.1 TENSILE STRESS ... 21
CONVERGENCE ... 21
TENSILE STRESS SINGLE BOARD... 24
TENSILE STRESS GLULAM ... 26
COMPARISON BETWEEN TENSILE ANALYSIS ON SINGLE BOARD AND GLULAM ... 28
3.2 EDGEWISE MOMENT ... 29
EDGEWISE MOMENT SINGLE BOARD ... 29
EDGEWISE MOMENT ON GLULAM ... 31
COMPARISON BETWEEN EDGEWISE ANALYSIS ON SINGLE BOARD AND GLULAM ... 33
2
FLATWISE MOMENT SINGLE BOARD ... 34
FLATWISE MOMENT GLULAM ... 36
3.4 EFFECT OF ADHESIVE ... 37
3.5 QUESTIONS OF MODELLING KNOTS ... 42
TIE CONSTRAINT ... 43
INTERACTION CONTACT ... 43
4 REAL SAMPLES SIMULATIONS ... 47
4.1 TENSILE ANALYSIS ... 47
4.2 BENDING ANALYSIS ... 49
4.3 MOE WITH 2 PERFECT LAMELLAS ... 51
4.4 STRESS CONCENTRATION FACTOR ... 52
CORRELATION WITH ECCENTRICITY ... 54
CORRELATION WITH INCLINATION ANGLE ... 55
5 PREDICTION OF STRENGTH OF GLULAM ... 57
5.1 STUDY OF BAD BOARDS ... 60
5.2 STUDY OF GOOD BOARDS ... 63
6 CONCLUSIONS ... 69
3
INDEX OF FIGURES
Figure 2-1 Glulam beam scheme ... 13 Figure 2-2 C3D8 hexahedral element (a) C3D10 tetrahedral element (b), Abaqus 6,14 documentation ... 14 Figure 2-3 Board generated with random knots ... 15 Figure 2-4 generic real board (a), corresponding numerical model (b)... 15 Figure 2-5 Tensile stress analysis (a) scheme from EN 408 (b) model setup in Abaqus 16 Figure 2-6 Edgewise moment stress analysis; scheme from EN 408 (a) real test performed in Holzforschung München (b) model setup in Abaqus (c) ... 18 Figure 2-7 Flatwise moment stress analysis scheme from EN 408 (a) model setup in Abaqus (b) ... 20 Figure 3-1 Displacement convergence, axially loaded beam with one knot ... 22 Figure 3-2 Stress convergence, axially loaded beam with one knot ... 22 Figure 3-3 Axial stress on tensile loaded single board, one knot, deformation scale factor 50 ... 24 Figure 3-4 Axial stress on tensile loaded single board, several knots, deformation scale fac. 50 ... 24 Figure 3-5 Axial stress on tensile loaded glulam, one knot, deformation scale factor 50 ... 26 Figure 3-6 Axial stress on tensile loaded glulam, several knots, deformation scale factor 50 ... 26 Figure 3-7 Axial stress on edgewise moment loaded single board, one knot, deformation scale factor 50 ... 29 Figure 3-8 Axial stress on edgewise moment loaded single board, several knots, deformation scale factor 50 ... 30 Figure 3-9 Axial stress on edgewise negative moment loaded single board, several knots, deformation scale factor 50 ... 30 Figure 3-10 Axial stress on edgewise moment loaded glulam, one knot, scale factor 50 ... 32 Figure 3-11 Axial stress on edgewise moment loaded glulam, several knot, scale factor 50 ... 32 Figure 3-12 Axial stress on flatwise moment loaded single board, one knot ... 35 Figure 3-13 Axial stress on flatwise moment loaded single board, several knots ... 35
4
Figure 3-14 (a) Stress distribution far from knots, with adhesive (b) representation of path
position ... 38
Figure 3-15 (a) Stress distribution next to a knot without adhesive (b) Stress distribution next to a knot with adhesive (c) representation of path position ... 40
Figure 3-16 (a) Superposed knots in adjacent layers (b) stress distribution in the zone with superposed knot ... 41
Figure 3-17 Modelling of hole in the adhesive, zone of knot superposition (a) adhesive exactly following the shape of knots (b) adhesive approximating the shape of knots with an ellipse ... 42
Figure 3-18 stress distribution in the zone with superposed knots, tie contact ... 43
Figure 3-19 stress distribution in the zone with superposed knots, interaction contact . 44 Figure 4-1 Real tested board, subjected to tensile force ... 47
Figure 4-2 Stress path far from a knot on a real board (a) with PUR adhesive (b) with MUF adhesive ... 49
Figure 4-3 Stress lines around knots (from Wikipedia) ... 52
Figure 4-4 Correlation between SCF and eccentricity of knots ... 54
Figure 4-5 Correlation between SCF and inclination of knots ... 55
Figure 5-1 Correlation between the tested MoE and the tested strength of single boards ... 58
Figure 5-2 Correlation between maximum stress ad strength for all single boards samples ... 59
Figure 5-3 Correlation between maximum stress and strength for bad boards ... 60
Figure 5-4 Correlation between tested MoE and strength on 200 samples specimen .... 61
Figure 5-5 Correlation between maximum stress and strength for good boards ... 64
Figure 5-6 Correlation between maximum stress and strength for good boards, neglecting samples with few knots ... 64
5
INDEX OF TABLES
Table 2-1 Timber mechanical properties ... 13
Table 2-2 Properties of adhesives ... 14
Table 3-1 Convergence study, tensile loaded single board ... 22
Table 3-2 Stress, disp. and MoE on tensile loaded single board ... 25
Table 3-3 Tensile loaded glulam, one knot and Several knots case ... 27
Table 3-4 Stress, disp. and MoE for single boards and glulam ... 28
Table 3-5 Stress values on every board of glulam... 28
Table 3-6 Stress, disp. and MoE on edgewise moment loaded single board ... 31
Table 3-7 Stress, disp. and MoE on edgewise moment loaded single board ... 33
Table 3-8 Stress, disp. and MoE on edgewise moment loaded single board ... 33
Table 3-9 Stress, disp. and MoE on flatwise moment loaded single board ... 36
Table 3-10 Stress, disp. and MoE on flatwise moment loaded single board ... 36
Table 3-11 Stress, disp. and MoE on flatwise moment loaded single board ... 37
Table 4-1 Stresses, disp. and MoE for tensile loaded glulam, different adhesives ... 47
Table 4-2 Disp. and MoE from simulations in different faces of the board ... 48
Table 4-3 Stress, disp. and MoE on edgewise moment loaded glulam, different adhesives ... 49
Table 4-4 Disp. and MoE on front and back board, edgewise moment ... 50
Table 4-5 Stress, disp. and MoE on flatwise moment loaded glulam, different adhesives ... 50
Table 4-6 Disp. and MoE on upper and lower board, flatwise moment... 50
Table 4-7 Disp. and MoE modifying two boards at a time of a glulam specimen ... 51
Table 5-1 prediction procedure for bad boards, values on samples and average ... 62
7
ABSTRACT
Wood is a natural material with irregularities, in particular knots, that affect the global stiffness and strength. The peculiarity of this material is the impossibility of eliminating all defects. The approach to this material is to take into account the effect of these defects and to study how these defects are affecting the global behaviour of the structure. Furthermore, the anisotropic structure of wood requires the study to take into account the changes of the material properties in the three directions.
In this thesis the effect of knots on the structural behaviour in terms of stiffness and strength was studied, in a linear elastic analysis, using Abaqus. Test setups from European standard EN 408 and tests performed in the research centre “Holzforschung München” were modelled, in order to compute mechanical properties and have a qualitative and quantitative estimation of the effect of knots.
The attention was then led to the effect of the adhesive layer on the numerical model, for which there is little available literature. Different types of adhesive were used in the modelling procedure to study their effects on the mechanical behaviour of wood. It is shown that the adhesive effect is generally negligible and failure is occurring in wood. All tests results and simulations are referred to thin layers of adhesive.
The last part of the study focused on the effect of stress concentrations next to knots. The maximum longitudinal stress was used to predict the glulam strength through the correlation between stress from analysis and strength from tests on single boards. The accuracy of results is not high for slightly defected boards, because other different phenomena outer than knots should be taken into account (fiber deviation, microcracks ecc.). However, predictions are relatively good for the boards with knots and not clusters. The objective of this study was finding an estimation of strength starting from a computationally efficient model, in which few input data are required.
Other researches in literature developed tools and models for an accurate analysis of strength, however the required computational resources and input parameters are sensitively increasing.
9
SOMMARIO
Il legno è un materiale naturale, con irregolarità, in particolare nodi, che modificano la resistenza e la rigidezza del materiale. La peculiarità del materiale legno è l’eterogeneità del materiale, e l’impossibilità di eliminare i difetti oltre certi limiti. L’approccio a questo materiale deve tenere in conto i difetti, e studiare come questi inficino le caratteristiche globali della struttura. La struttura anisotropa del legno inoltre richiede che lo studio sia condotto considerando le diverse proprietà del legno nelle tre dimensioni.
In questo studio si è cercato di individuare, attraverso un modello elastico lineare costruito con il software FE “Abaqus”, l’effetto dei nodi, sul comportamento della struttura in termini di rigidezza e resistenza. Con il modello numerico sono stati simulati i test da normativa e i test eseguiti presso il centro di ricerca “Holzforschung München” per il calcolo delle proprietà meccaniche, ottenendo una stima qualitativa e quantitativa dell’effetto dei nodi.
L’attenzione è stata poi spostata sull’effetto dell’adesivo nel modello numerico, per il quale la letteratura è limitata. Diversi tipi di adesivi sono stati usati nella modellazione, per studiare il loro effetto sul comportamento meccanico del legno. È mostrato che in generale l’effetto dell’adesivo è trascurabile e che la rottura della trave, salvo errori in fase di incollaggio, è prevista lato legno. Tutti i test e le simulazioni sull’effetto dell’adesivo si riferiscono a strati di adesivo sottili.
L’ultima parte dello studio si è concentrata sull’effetto delle concentrazioni di sforzo in prossimità dei nodi.Il massimo sforzo in direzione longitudinale è stato usato per predire la resistenza del legno lamellare, attraverso le relazioni tra sforzi dalle simulazioni e resistenza ottenuta con prove sperimentali. L’accuratezza dei risultati non è elevata nel caso di travi poco difettate, perché servirebbe un modello che consideri altri fenomeni oltre ai nodi (deviazione delle fibre, micro-crepe ecc.). Tuttavia, le stime sono relativamente accurate per travi con nodi o gruppi di nodi. L’obiettivo era trovare una stima della resistenza a partire da un modello computazionalmente efficiente e che richieda pochi dati di input.
Altre ricerche presenti in letteratura hanno sviluppato tool e modelli per un’analisi accurata, tuttavia le risorse computazionali e i parametri di input necessari crescono sensibilmente.
11
1 INTRODUCTION
The demand for wood structures is everyday increasing, due to the big demand of sustainability in constructions and execution speed of building. The ratio between materials performances and light weight of materials is also a good solution to keep inertia forces low in the case of a seismic event. The peculiarity of wood is that is not a manufactured material, defect are present and the attention is led to the grading of the material. This research is part of the “Beech connect” project, aiming at characterising and optimising timber element obtained from low quality boards and glues. In particular, the effect of knots on mechanical characteristics of wood was studied; knots are the portion of branches into the bole of the tree, that constitute a portion with different density, and therefore an interruption of continuity of material and the deviation of fibres. The study of the effect of defects on timber mechanical characteristics is object of study since long time. At the beginning of 20th century the first procedure of visual grading where adopted, in which timber was graded only through a visual inspection of defects, without performing other destructive tests. During the century machine grading methods were implemented, correlating results from destructive tests with results from non-destructive tests, such as bending or tensile modulus of elasticity, density etc. (Holmqvist et al., 1999). In early 1980s the first numerical model were built (Cramer, 1982), aiming at defining a model capable of predicting strength and elastic properties basing on the flow grain analogy. The research focused in those years mainly on the effect of the fibre deviation, not fully capturing the effect of knots on timber behaviour. In 1999, Green et al. studied the influence of knots, finding that mechanical properties depends on location, shape, and type of stress to which the wood element is subjected; the effect of knots was proved to be more significant in the tensile zone than in the compression zone, because of the detachment of the contact surface of the knot. Recent studies focused more on the effect of knots (Baño et al., 2010) modelling knots as holes or using adherent element, showing that in a tensile side the real behaviour is well represented by knots as holes, whereas in a compression side the adherent elements give a better approximation. In 2013, Guindos and Guaita built a FE model predicting the behaviour of timber at the macro-scale taking into account the effect of any type of knot. In 2014, Lukacevic et al. developed a numerical tool to perform virtual destructive tests, known the fibre deviation around knots, to investigate mechanical properties through an accurate micromechanical model. The models were developed for single boards, however results can be extended to
12
glulam. First models for glulam grading were developed in 1954 by Freas and Felbo. In this model the ratio between the inertia of the area of knots and the inertia of the total section is used as a strength reduction factor to account knots in the strength prediction. The model was implemented by Foschi and Barrett in 1980, which, through numerical simulation, predicted the strength values with a high accuracy. The model was quite complex, because flexural properties in defected zones were reestimated using the stress reduction factor. A more recent model was developed by Lee et al. in 2005, for performing virtual flexural tests on glulam. In their model the transformed section method was used, reducing the section made of different lamellas to a unique element with a different width, as a function of the geometry, MoE and knot sizes on single boards. The aim of this thesis is to develop a numerical model for improvement of the strength grading with low computational cost, taking into account only the effect of knots, neglecting fibre orientation and other inhomogeneities. Therefore, the fibre orientation due to other effect than the knots was not considered in the model and the whole analysis is performed in the linear elastic field.
1.1 OBJECTIVES
The aim of this master thesis is to study the effect of knots on stiffness and stresses of the boards, due to the fibre deviation in their vicinity, and to extract numerical parameters which can be used for the improvement of the strength predictions. The model was developed in different steps. First, a numerical model with random generated knots was built, modifying number and position of knots, aiming at understanding the modulus of elasticity (MoE) and the maximum longitudinal stress variation on a single board; the model was then extended tying more boards, to study qualitatively and quantitatively the effect of lamination of glulam. Subsequently, the study focused on the effect of adhesive between lamellas, to understand how different types of adhesives can affect the model behaviour. Thereafter, a model of the real boards, physically tested in Holzforschung München (tensile tests on single boards, according to EN 408) was built and analysed for the validation. On this model attempts were made to find a correlation between the maximum longitudinal stress and the knots characteristics. Last, known correlations between different experimental parameters (Oscarsson, 2014) the relations with data from simulations were studied to establish a relationship between the tested strength of boards and the numerical model, aiming at a prediction of glulam strength based only on numerical simulations.
13
2 MATERIALS AND METHODS
The study was carried out using both softwood and hardwood species. These two types of wood do not differ for end use or appearance, but for the provenience of the wood, respectively from a conifer and a deciduous plant (. In general deciduous trees tend to be slower growing, therefore hardwood is more dense and sturdier. In the specific case of this study simulations and experimental data are referring to spruce (softwood) and beech (hardwood), orthotropic materials whose properties are shown in Table 2-1.
Table 2-1 Timber mechanical properties
ρ [Kg/m3] E0,mean [Mpa] E90,mean [Mpa] ν [-] G0,mean [Mpa] G90,mean [Mpa] Spruce 400 11500 300 0,01 650 65 Beech 700 13000 860 0,01 810 59
The Poisson effect was neglected because of his low relevance in terms of results, to reduce the computational cost; this assumption is maintained also in the following. In a second step, the study focused on the glulam production and the effects of adhesives; glulam beams are obtained by bonding together single layers of timber with adhesive layers in between (see Figure 2-1), in order to obtain from several small pieces a single large piece, reducing the scale effect that affect wood.
14
Glulam numerical models were built assembling four lamellas on their flat surface, therefore in between three adhesive layers were added. The experimental tests in Holzforschung München were performed using melamine-urea-formaldehyde (MUF) adhesive between layers, whereas the simulations were performed also for polyurethane (PUR) and phenol-resorcinol-formaldehyde (PRF), to evaluate the effect of the adhesives stiffness on results. The adhesive layer was modelled as a solid element with a thickness of 0,1𝑚𝑚 (thus it is a thin layer of adhesive); the material is isotropic, hence, as the study was carried out in the linear elastic field, the only input data required are the modulus of elasticity and the Poisson ratio. In Table 2-2 adhesive properties are showed.
Table 2-2 Properties of adhesives
Adhesive MoE [Mpa] ν
PUR 2000 0,3 PRF 3500 0,3 MUF 5500 0,3
2.1 FE MODEL
The FE analysis is a method used for the study of continuum problems in the discrete fields. In this study the main goal of this method is the study of tension transmission into the material. Models were studied through a linear elastic analysis using the software “Abaqus”.Initially, C3D8 elements (Figure 2-2a) were used: these are hexahedral elements with linear shape functions. The mesh was refined next to knots for geometrical approximation because the knots region is the most affected by variation of values. Later, C3D10 (Figure 2-2b) elements were used: these are tetrahedral elements with quadratic shape functions. The approximation obtained with C3D10 elements is more accurate, in particular for compression and bending case, avoiding the shear locking phenomenon.
Figure 2-2 C3D8 hexahedral element (a) C3D10 tetrahedral element (b), Abaqus 6,14 documentation
Tests from EN 408 and tests performed in Holzforschung München were simulated, in order to verify the numerical results with the experimental data from literature. All the
15
analysis were carried out staying in the linear elastic field. Two different steps were followed in this thesis, which are described in sub-chapter 2.1.1 and 2.1.2. Three different loading and test configuration were analysed in this study, including tensile stress analysis, edgewise and flatwise bending analysis, described in sub-chapters 2.1.3, 2.1.4 and 2.1.5.
BOARDS GENERATED WITH RANDOM KNOTS
Initially, the models of boards generated with random knots were built using Abaqus, modelling beams of 10𝑚𝑚 ∗ 120𝑚𝑚 section, with length depending on the analysis (tensile stress, edgewise moment, flatwise moment). Knots are modelled as cylindrical holes with axis perpendicular to the beam axis and diameter between 15 and 25 millimetres.
Figure 2-3 Board generated with random knots
REAL TESTED BOARDS
Timber beams with a significant amount of defects were tested in tension as single boards in Holzforschung München within the project “Beech connect”, and through a visual grading procedure position, shape and angle of knots were determined. A model based on these samples built using Abaqus (Khaloian, 2017) was used, modelling knots as holes (see Figure 2-4), whereas the fibre deviation, the cracks and other defects were neglected. The shape of knots is cylindrical or conical, with random orientation. The dimension of these beams is 24𝑚𝑚 ∗ 100𝑚𝑚 ∗ 3200𝑚𝑚
Figure 2-4 generic real board (a), corresponding numerical model (b)
(a)
16
The two vertical lines on the side of Figure 2-4a represent the marking line to separate the test length from the rest of the beam, clamped to the grip during the tensile test.
TENSILE STRESS ANALYSIS ACCORDING TO EN 408
The model was created simulating EN 408 test conditions, in which a beam element is subjected to a tensile stress. The scheme was adopted both for single boards and glulam; in Figure 2-5b the modelling scheme for a glulam beam is showed.
Figure 2-5 Tensile stress analysis (a) scheme from EN 408 (b) model setup in Abaqus for
glulam
In the real test, there are several rules to be respected, such as the velocity of loading, the maximum load achieved, etc.; in the numerical model, a linear elastic analysis is performed, thus the results will be linearly dependent on the applied stress. The cross section dimensions are 10𝑚𝑚 ∗ 120𝑚𝑚 for sample boards generated with random knots, and 24𝑚𝑚 ∗ 100𝑚𝑚 for sample boards generated from real boards.
The boundary condition were applied creating two reference points in the middle of the two end cross sections. Every movement was locked on the left cross section, while on
(a)
17
the other end only the axial displacement was free. The boundary conditions were distributed using a coupling constraint to link the reference point to a beam portion, in order to leave free only the test length portion.
The modulus of elasticity in tension expressed in Mpa, is calculated, according to EN 408, as: 𝐸𝑡,0 = 𝑙1 ∗ (𝐹2− 𝐹1) 𝐴 ∗ (𝑤2− 𝑤1) (2.1) Where:
- 𝐹2− 𝐹1 is the increment of load, in Newtons
- 𝑤2− 𝑤1 is the increment of deformation corresponding to 𝐹2− 𝐹1 taken on a span length of 5ℎ, in millimetres
- 𝐴 is the area of the cross section, in square millimetres
- 𝑙1 is the gauge length for the determination of modulus of elasticity, equal to 5 times the height of the board, in millimetres.
FOUR POINT BENDING STRESS ANALYSIS ACCORDING TO EN 408 A four point bending stress analysis is modelled using Abaqus to simulate the test from EN 408. The test scheme is represented in Figure 2-6a. a beam with a length of eighteen times the depth of the section, supported at the two ends was adopted. The load applied at a distance of six times the depth of the section from supports, on a width of 20mm, to avoid a numerical singularity due to a concentrated load in a 3D model. Measures of displacements are taken in the middle section and on a span length of five times the depth of the section, as shown in Figure 2-1:
The boundary conditions were modelled creating 2 reference point in the middle of the end cross sections, fixing for those points every movement except the rotation around the z axis. The boundary conditions were distributed using a coupling constraint to link the reference point to a 60mm deep volume.
18
Figure 2-6 Edgewise moment stress analysis; scheme from EN 408 (a) real test performed in Holzforschung München (b) model setup in Abaqus (c)
According to EN 408, the local edgewise modulus of elasticity expressed in Mpa, is computed as: 𝐸𝑚,𝑙𝑜𝑐 = 𝑎𝑙1 2(𝐹 2− 𝐹1) 16𝐽(𝑣2− 𝑣1) (2.2) (a) (b) (c)
19 Where:
- 𝑎 is the distance between one of the point loads and the nearest support, in millimetres
- 𝑙1 is the length (equal to 5h) of the steel yoke over which the local vertical displacement 𝑣 is measured, in millimetres
- 𝐽 is the second moment of inertia, in millimetres to the fourth power
- 𝐹2− 𝐹1 is the increment of load (i.e. the increment of the sum of the two point loads) measured between two points on the straight portion of the load-deformation graph, in Newtons
- 𝑣2− 𝑣1 is the increment of vertical displacement corresponding to 𝐹2− 𝐹1, expressed in millimetres.
The global edgewise MoE expressed in Mpa, is calculated as:
𝐸𝑚,𝑔𝑙𝑜𝑏 = 𝐿3(𝐹2− 𝐹1) 𝑏ℎ3(𝑤 2− 𝑤1) [(3𝑎 4𝐿) − ( 𝑎 𝐿) 3 ] (2.3) Where:
- 𝑎 and 𝐹2− 𝐹1 are the same explained for equation (2.2) - ℎ is the depth of the board, in millimetres
- 𝑏 is the board thickness, in millimetres
- 𝐿 is the total span in bending, i.e. 𝐿 = 18ℎ, in millimetres
- 𝑤2− 𝑤1 is the increment of vertical displacement in the middle section corresponding to 𝐹2− 𝐹1, in millimetres.
THREE POINT BENDING STRESS ANALYSIS ACCORDING TO EN 408 A three point bending stress analysis is modelled using Abaqus to simulate the test from EN 408. The test is performed on a beam with a length of 900mm (see Figure 2-1), supported at the two ends; the load is applied in the central section, on a width of 20mm, to avoid localized effect. The boundary conditions were modelled creating 2 reference point in the middle of the end cross sections, fixing for those points every movement except the rotation around the z axis. The boundary conditions were distributed using a coupling constraint to link the reference point to a 60mm deep volume. Measures of displacements are taken in the middle section.
20
Figure 2-7 Flatwise moment stress analysis scheme from EN 408 (a) model setup in Abaqus (b)
The local flatwise MoE is calculated as:
𝐸𝑓𝑙𝑎𝑡,𝑙𝑜𝑐 = 𝐹 ∗ 𝐿𝑓𝑙𝑎𝑡 3
48𝐽 ∗ 𝑤 (2.4)
Where:
- 𝐹 is the applied load, in Newtons
- 𝐽 is the second moment of inertia, in millimetres to the fourth power - 𝑙𝑓𝑙𝑎𝑡 is the distance between the supports (equal to 900mm)
- 𝑤 is the vertical displacement in the central point, in millimetres. (b)
21
3 NUMERICAL ANALYSIS OF BOARDS WITH
RANDOM GENERATED CYLINDRICAL KNOTS
The knots were modelled through cylindrical holes in the direction perpendicular to the beam axis, as explained in sub-chapter 2.1.1. Two models were studied in this case. The first, with a single knot on the axis, the second with several knots in random positions on the board. The goal is to evaluate the effect of knots on stiffness and stress distribution, comparing results in the “one knot case” with the “several knots case” under different loading condition (tensile stress, edgewise and flatwise moment). The properties and input parameters of this study are the ones for spruce elements, mentioned above. C3D8 hexahedral elements were used to perform the simulation.
3.1 TENSILE STRESS
The load was applied as a concentrated force in the middle of one end cross section, then, through the coupling constraint, distributed to the constrained volume. The force value is 𝐹 = 25𝐾𝑁; The value and the way of applying the load are chosen to simulate the conditions of a real tensile test for a single board. An applied load of 25𝐾𝑁 on a surface of 10𝑚𝑚 ∗ 120𝑚𝑚 correspond to a pressure of 20,83𝑀𝑝𝑎, thus the average value of the longitudinal stress over the beam is expected to be equal to that value.
CONVERGENCE
The first step is the study of the best mesh, through a convergence study. The element dimensions, i.e. the mesh, are refined step by step and the analysis for a single board with one knot is run for every case; the mesh refining is stopped when the error, in terms of displacements and maximum stresses, between two steps is low; from plots the course of convergence is represented by the slope of the line.
22
Figure 3-1 Displacement convergence, axially loaded beam with one knot
Figure 3-2 Stress convergence, axially loaded beam with one knot
Results from Table 3-1 show that the convergence in terms of displacement is reached with coarse mesh, whereas the convergence in terms of stress is slower and a finer mesh is needed; therefore, the study of the mesh is based on maximum stress on boards. It is to be noted that the dimension of elements far from knots does not affect the convergence, as the values of stresses are nearly constant; the best mesh in terms of computational cost is obtained refining the zone adjacent to knots, with coarser elements far away.
Table 3-1 Convergence study, tensile loaded single board
Mesh n. N. elements σmax/σavg umax [mm] εσ [%] εu [%]
1 784 1,905 2,665 - - 2,6645 2,665 2,6655 2,666 2,6665 2,667 2,6675 0 5000 10000 15000 20000 25000 30000 35000 u m ax [mm] Number of elements
Displacement convergence
0,00 20,00 40,00 60,00 80,00 100,00 120,00 0 5000 10000 15000 20000 25000 30000 35000 σ m ax [Mp a] Number of elements23
2 3072 2,515 2,667 32,02 0,08 3 11624 3,685 2,667 46,52 0,00 4 15176 4,15 2,667 12,62 0,00 5 30325 4,22 2,667 1,69 0,00
The difference in terms of stress between mesh n. 4 and 5 (Table 2-1) is very low, hence it is fair to use the mesh n.4, with circa 15000 elements, for the next steps. The third case gives also a good approximation; hence, to reduce the computation cost, the glulam is modelled using the third mesh.
24 TENSILE STRESS SINGLE BOARD
The results of the linear elastic analysis on single boards with one and several knots are shown in Figure 3-3, Figure 3-4 and Table 3-2. As the total deformations are relatively small, the results are scaled in these figures to be able to show the deformation of the knots under the applied loads better. The applied pressure consequent to the applied load of 25𝐾𝑁 is 20,83𝑀𝑝𝑎.
Figure 3-3 Axial stress on tensile loaded single board, one knot, deformation scale factor 50
25
The stress distribution graphs show that the variation of stress is concentrated around the knots, with an increasing in the upper and lower part and a decreasing in the two lateral sides of knots. Far from knots the value of stress tend to be the same as the pressure applied, however is notable that for the several knots case there is not a uniform value of stress far from knots, hence the whole beam is affected by knots.
Table 3-2 Stress, disp. and MoE on tensile loaded single board One Knot Sev. Knots Variation [%]
σmax/σavg 4,07 6,89 40,89
Δu [mm] 1,164 1,846 36,92
Et,0 [MPa] 10737 6773 36,92
*Sev. Knots refers to the case with several knots on the boards
The 𝜎𝑚𝑎𝑥 and 𝜎𝑎𝑣𝑔 showed in Table 3-2 are respectively the maximum value of the longitudinal stress all over the board, occurring in the proximity of a knot and the value of the longitudinal stress occurring in a clear wood region (equal to the applied load pressure). The variation between one knot and several knots cases is computed as:
𝑉𝑎𝑟𝑖𝑎𝑡𝑖𝑜𝑛 = |𝑋1𝑘𝑛𝑜𝑡− 𝑋𝑠𝑒𝑣.𝑘𝑛𝑜𝑡𝑠|
𝑚𝑎𝑥(𝑋1𝑘𝑛𝑜𝑡, 𝑋𝑠𝑒𝑣.𝑘𝑛𝑜𝑡𝑠)∗ 100 (3.1)
Where 𝑋 is the value of the studied variable (stress, displacement, or MoE). In this case the variation of strength and stiffness is about 40%, therefore knots significantly affect the behaviour of a single board. The variation for MoE and displacements is exactly the same because the MoE is directly computed from the displacement measures.
26 TENSILE STRESS GLULAM
A glulam model was created by connecting four boards together, and applying the boundary conditions, the load and the mesh as explained for a single board. The load value is 𝐹 = 100𝐾𝑁, equal to four times the load applied in the above case; this is due to the sectional dimension four times bigger.
Boards were connected together using a tie constraint between each of the surfaces, defining one surface as the master and the other as slave. The tie constraint doesn´t allow relative movement between surfaces, thus it can´t be used to study delamination of layers, whereas it gives a good solution with low computational cost for stress and displacements. The results of the glulam are presented in Figure 3-5, Figure 3-6 and Table 3-3.
Figure 3-5 Axial stress on tensile loaded glulam, one knot, deformation scale factor 50
27
Table 3-3 Tensile loaded glulam, one knot and Several knots case
One Knot Sev. Knots Variation [%]
σmax/σavg 2,28 4,48 49,15
Δu [mm] 1,092 1,405 22,23
Et,0 [MPa] 11443 8899 22,23
*Sev. Knots refers to the case with several knots on the boards
Some conclusions are outlined:
- The variation of stresses and displacements due to the presence of knots for glulam is smaller than for a single board; coupled lamellas give a lamination effect, that make irregularities less effective and increase the strength
- Variation of maximum stress is big for both single board and glulam case, because of the superposition of three knots in two adjacent lamellas of glulam, that leads to in that point to a local increasing of stress; in average there is a decreasing of stress peaks around knots from glulam to single board case
- The average variation of stress is close to the variation of displacements, as expected from Hook law, thus smaller for the glulam because of the effect of coupled lamellas.
28
COMPARISON BETWEEN TENSILE ANALYSIS ON SINGLE BOARD AND GLULAM
Results from the analysis of single board and glulam with several knots were compared in order to understand and analyse the lamination effect of glulam, and its effects on knots.
Table 3-4 Stress, disp. and MoE for single boards and glulam
Single Board Glulam Variation [%]
σmax/σavg 6,89 4,48 34,93
Δu [mm] 1,846 1,405 23,89
Et,0 [MPa] 6773 8899 23,89
From Table 3-4 it is evident that the effect of knots is weaker for glulam than for single boards, showing an enhancement of MoE around 25% and a reduction of stresses around 35%. The stress variation was studied per every board of glulam; the results are presented in Table 3-5.
Table 3-5 Stress values on every board of glulam
σmax,SB/σavg,SB σmax,GL/σavg,GL Variation [%]
Board 1 6,89 4,48 34,99
Board 2 5,81 4,05 30,35
Board 3 5,81 3,14 45,89
Board 4 6,61 4,48 32,19
Stress reduction is greater in internal boards because of the effect of confinement due to the external boards; in board 2 the reduction of max stress is less significant because of the superposition of knots above mentioned, although the average variation of stresses is greater than in external boards.
29
3.2 EDGEWISE MOMENT
The model with several knot was built positioning more knots in the lower part of the board, and applying both a positive and a negative moment, to evaluate the effectiveness of knots in tensile and in compression zone. The load was applied in two points at a distance of 6ℎ from the two ends, to simulate the 4 point bending test as in EN 408. To avoid a singularity in the model the load was applied as a pressure of 1𝑀𝑝𝑎 on a 20mm wide area. In this case, because of the eccentric position of knots to the axis, the different behaviour under positive and negative bending moment has to be studied.
EDGEWISE MOMENT SINGLE BOARD
A linear elastic analysis was performed on single board with one and several knots (shown in Figure 3-7, Figure 3-8 and Figure 3-9). In the case with several knots most of the knots were placed in the lower part of the board (Figure 3-8), and the analysis was performed both with positive and negative moment. The moment is maximum in the central portion of the beam, between the two loading point and considering a cross section the moment has a butterfly diagram shape; therefore the most critical knots are those in the central portion with high eccentricity.
Figure 3-7 Axial stress on edgewise moment loaded single board, one knot, deformation scale factor 50
30
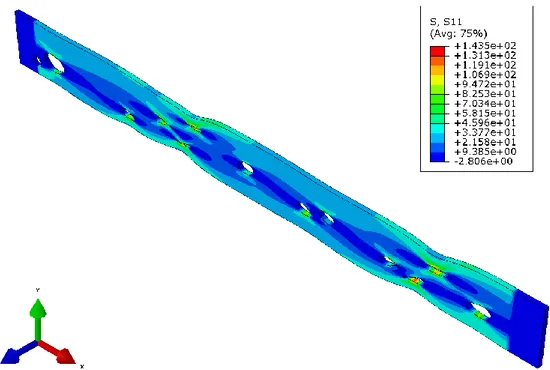
Figure 3-8 Axial stress on edgewise moment loaded single board, several knots, deformation scale factor 50
Figure 3-9 Axial stress on edgewise negative moment loaded single board, several knots, deformation scale factor 50
The two cases with positive and negative moment (Figure 3-8 and Figure 3-9) show that the greater stresses are almost equal in modulus. The most stressed area is next to a central knot in the lower part of the board (in the central part, where stresses are greater knots are all positioned in the lower part of the beam).
31
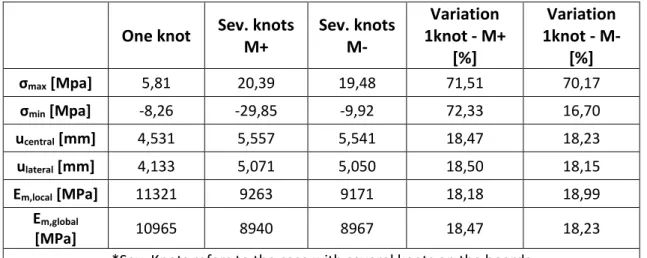
Table 3-6 Stress, disp. and MoE on edgewise moment loaded single board
One knot Sev. knots M+ Sev. knots M- Variation 1knot - M+ [%] Variation 1knot - M- [%] σmax [Mpa] 5,81 20,39 19,48 71,51 70,17 σmin [Mpa] -8,26 -29,85 -9,92 72,33 16,70 ucentral [mm] 4,531 5,557 5,541 18,47 18,23 ulateral [mm] 4,133 5,071 5,050 18,50 18,15 Em,local [MPa] 11321 9263 9171 18,18 18,99 Em,global [MPa] 10965 8940 8967 18,47 18,23
*Sev. Knots refers to the case with several knots on the boards
Some conclusions are outlined:
- The eccentricity of knots has significant importance in this case, because for bending stressed elements the cross sectional stress diagram has a butterfly shape, therefore knots with high eccentricity are subjected to higher stresses. In real cases attention need to be paid to those knot, in particular when they are in the tensile zone, where they can lead to a brittle failure
- with one knot in symmetrical position the positive and negative stresses respectively on the upper and on the lower part of the beam are the same; in the case with several knots the maximum stress develop next to the knot with the highest eccentricity between the two loading point (zone of highest stresses) - knots are positioned mainly out of the 5h length in which the local measure is
taken; that leads the local MoE to be less affected than the global MoE to the presence of knots
- the difference in MoE in case of positive or negative moment is still due to the eccentrical position of knots, that leads to different values of displacements but similar stresses.
EDGEWISE MOMENT ON GLULAM
The analysis was extended to glulam. Boundary conditions, load and mesh were created as for single boards. Boards were connected together using a tie constraint between each of the surfaces, defining one surface as the master and the other as slave, as for the tensile case. In this case, because of the different position and amount of knots in different
32
boards, the different behaviour of the front and the back side of the glulam boards has to be studied.
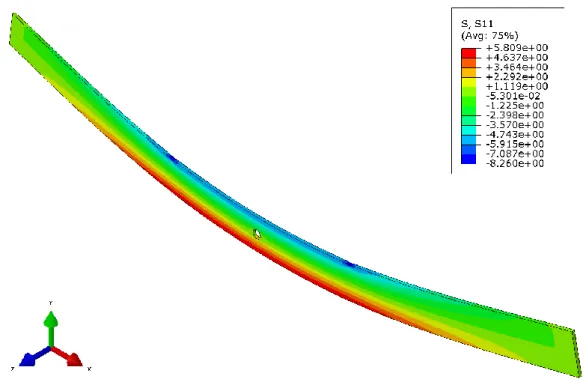
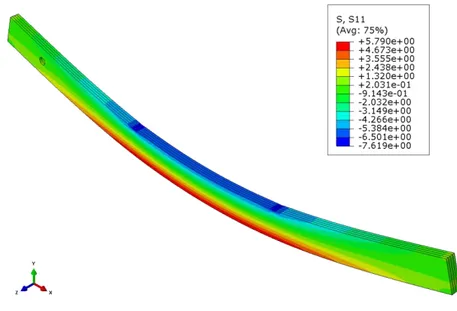
Figure 3-10 Axial stress on edgewise moment loaded glulam, one knot, scale factor 50
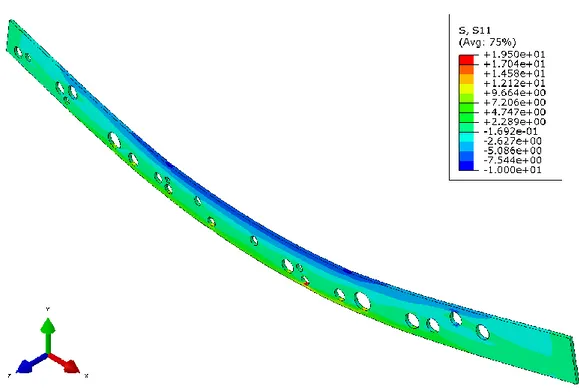
Figure 3-11 Axial stress on edgewise moment loaded glulam, several knot, scale factor 50
Figure 3-10 shows a very regular behaviour of stresses, with maximum stresses on the upper and lower layer. This condition is obtained because the knots are positioned on the axis of the beam, where stresses are minimum, thus the maximum stress is on the upper and lower layer, independently from knots. On the other hand, in Figure 3-11 is showed that with eccentric knots the maximum stress is no more on the upper and lower layer, but in the proximity of the more eccentric knots. Results in terms of stress, displacement and MoE are shown in Table 3-7.
33
Table 3-7 Stress, disp. and MoE on edgewise moment loaded single board
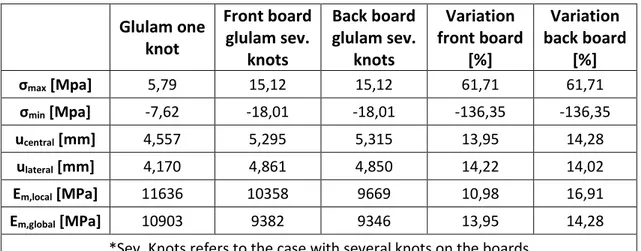
Glulam one knot Front board glulam sev. knots Back board glulam sev. knots Variation front board [%] Variation back board [%] σmax [Mpa] 5,79 15,12 15,12 61,71 61,71 σmin [Mpa] -7,62 -18,01 -18,01 -136,35 -136,35 ucentral [mm] 4,557 5,295 5,315 13,95 14,28 ulateral [mm] 4,170 4,861 4,850 14,22 14,02 Em,local [MPa] 11636 10358 9669 10,98 16,91 Em,global [MPa] 10903 9382 9346 13,95 14,28
*Sev. Knots refers to the case with several knots on the boards
Some conclusions are outlined for this case:
- Variations are bigger on the back board because of a greater amount of knots on that board
- The most affected value is the local modulus of elasticity because of the particular configuration of knots
COMPARISON BETWEEN EDGEWISE ANALYSIS ON SINGLE BOARD AND GLULAM
Results of the analysis of single board and glulam with several knots were compared in order to study the lamination effect of glulam in the edgewise bending case. From Table 3-8 it is clear that the maximum effect of lamination is obtained for stresses, with a reduction up to 40%. The lamination effect is less effective compared the tensile stress case, because, as showed from literature (Green, 1999) knots are more effective in the tensile zone than in the compression zone, therefore also the reduction obtained coupling lamellas is smaller.
Table 3-8 Stress, disp. and MoE on edgewise moment loaded single board
Single Board Glulam Variation [%]
σmax [Mpa] 20,39 15,12 25,85 σmin [Mpa] -29,85 -18,01 39,66 ucentral [mm] 5,549 5,305 4,39 ulateral [mm] 5,061 4,855 4,05 Em,local [MPa] 9217 10002 7,84 Em,global [MPa] 8953 9364 4,39
34
3.3 FLATWISE MOMENT
For flatwise moment case, because of the eccentric position of knots to the axis, front and back side behave in a different way, which leads to different values of stresses and displacements.
The model with several knot was built positioning more knots next to the front side of the board, to evaluate the different behaviour of the front and back layer of the board. The load was applied in a central portion to simulate the 3 point bending test as in EN 408. To avoid a singularity in the model the load was applied as a pressure of 1𝑀𝑝𝑎 on a 20mm wide area. In this case, because of the different amount of knots in the different boards making the glulam, the different behaviour under positive and negative bending moment has to be studied.
FLATWISE MOMENT SINGLE BOARD
A linear elastic analysis was performed on single board with one and several knots. In the case with several knots most of the knots were placed next to one side of the board, to see if this configuration may lead to a torque effect, and therefore different results on the front and back layer of the board. With this configuration the maximum stress is always obtained in the proximity of knots (see Figure 3-12 and Figure 3-13). The results in terms of stress, dipalecement and MoE are compared in
35 Table 3-9.
Figure 3-12 Axial stress on flatwise moment loaded single board, one knot
36
Table 3-9 Stress, disp. and MoE on flatwise moment loaded single board
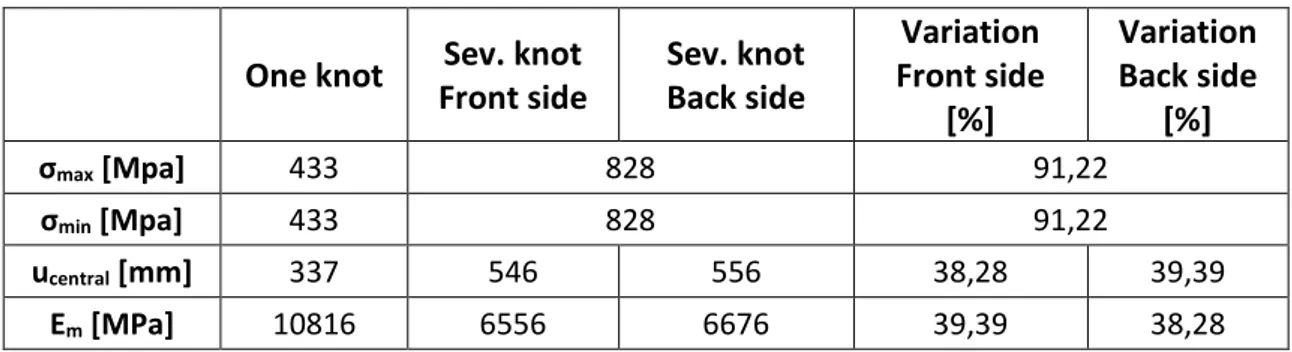
One knot Sev. knot Front side Sev. knot Back side Variation Front side [%] Variation Back side [%] σmax [Mpa] 433 828 91,22 σmin [Mpa] 433 828 91,22 ucentral [mm] 337 546 556 38,28 39,39 Em [MPa] 10816 6556 6676 39,39 38,28
From some conclusions are outlined:
- Stress and displacements have very high values because the board is modelled with a very small thickness, therefore its stiffness is very low
- displacements are bigger (hence elasticity modulus is lower) on the back side because knots are positioned mainly next to the back side, however the variation is quantitatively negligible
FLATWISE MOMENT GLULAM
The analysis was extended to glulam. Boundary conditions, load and mesh were created as for single boards.
Table 3-10 Stress, disp. and MoE on flatwise moment loaded single board
Glulam one knot Front side glulam sev. knots Back side glulam sev. knots Variation front side [%] Variation back side [%] σmax [MPa] 34,32 41,51 17,32 σmin [MPa] -20,79 -52,10 -150,60 ucentral [mm] 5,316 7,964 8,047 33,25 33,94 Em [MPa] 10714 7151 7077 33,25 33,94
*Sev. Knots refers to the case with several knots on the boards
In the flatwise moment case results are varying a lot depending on the position of knots; in this case knots in the central part cause higher variations in terms of stresses and displacements. Comparison between the results for a single board and a glulam board are omitted because, considering that results are function of the thickness of the board, that is varying from a model to another, the order of magnitude is different.
37
3.4 EFFECT OF ADHESIVE
To this point, the glulam boards were modelled neglecting the adhesive layer in between. As in reality the glulam boards are connected together by using adhesives, an adhesive layer with the thickness of 0.1mm is added between lamellas to study the effect of adhesive on glulam (in terms of MoE and stresses) and to evaluate where the failure is expected to occur. The adhesive layer has the following properties:
-
𝐸 = 2500𝑀𝑝𝑎, 𝑣 = 0,3, isotropic material (PUR adhesive)-
size of the mesh: 2x2x0,1mm-
Tie constrained to the adjacent boardsA tensile stress analysis is performed on the glulam with and without the adhesive layer, and results from the two cases were compared. This condition is shown in Table 3-11.
Table 3-11 Stress, disp. and MoE on flatwise moment loaded single board
No adhesive Adhesive Variation [%]
σmax [Mpa] 110,0 118,5 7,17
σmax ad [Mpa] - 222,4 -
Δu [mm] 1,394 1,384 0,71
Et,0 [MPa] 8967 9031 0,71
Two paths are selected on the glulam at the locations of the clear wood part and passing through the knots respectively to study the effects of the stress distributions and adhesives on the results. The paths are shown in Figure 3-14b and Figure 3-15c. The stress distributions on the cross section, near and far from a knot are shown in Figure 3-14, Figure 3-14 and Figure 3-15:
38
Figure 3-14 (a) Stress distribution far from knots, with adhesive (b) representation of path position
As shown in Figure 3-14a, the stress distribution in the four timber boards is more or less constant and equal to one. As expected the longitudinal stress in a clear wood portion correspond to the applied load pressure. The stress in the adhesive has a lower value than the stress on wood, because displacements are the same and the adhesive has a lower stiffness, hence it takes a smaller amount of stress. In particular, the stiffness of MUF adhesive is around half the stiffness of a spruce beam; this explains why the ratio between stresses in wood and adhesive is also around 0,5.
0 0,2 0,4 0,6 0,8 1 1,2 0 10 20 30 40 Str e ss [M Pa] Z direction
MUF Adhesive
Stress path AL1 AL2 (a) (b)39 0 0,5 1 1,5 2 2,5 0 5 10 15 20 25 30 35 40 Str e ss [M Pa] Z direction
Stress path near knot no adhesive
Stress path 0 0,5 1 1,5 2 2,5 0 5 10 15 20 25 30 35 40 Str e ss [M Pa] Z direction
Stress path near knot with adhesive
Stress path AL1 AL2 AL3 (a) (b)
40
Figure 3-15 (a) Stress distribution next to a knot without adhesive (b) Stress distribution next to a knot with adhesive (c) representation of path position
As shown in Figure 3-15a, the stress distribution in the proximity of a knot has no more a constant trend. In particular in the second board, in which there is a knot close by, there is an increasing of stress, that tend to turn gradually to the value of one in the two adjacent boards. The gradual passage of the stress in the boards shows that the model gives a good representation of stress transmission between lamellas. In the last board there is another variation of stress, due to the proximity of a knot on that board.
Some conclusions are outlined:
- The effect of adhesive on the modulus of elasticity is negligible, in the model is possible to consider or not the adhesive, independently on the stiffness of the adhesive; therefore, results from PRF adhesive can be extended to other types of adhesives. This conclusion will be treated in detail in the following.
- Stresses on boards are slightly affected by the adhesive layer; the difference between model without and with the adhesive layer is negligible
- The average stress on the adhesive is lower than the stress on wood, as the stiffness of adhesive is lower
- On adhesive layers there’s a peak of stress where there’s superposition of knots in different lamellas (Figure 3-16), that lead to think to failure in the adhesive layer or in the bonding. From Figure 3-16 it is evident the numerical singularity, therefore a deeper investigation is carried out, to understand if different types of models lead to the same conclusions.
41
Figure 3-16 (a) Superposed knots in adjacent layers (b) stress distribution in the zone with superposed knot
A first attempt to analyse the numerical singularity was made modelling the adhesive with a hole, following precisely the shape of knots (Figure 3-17a) or cutting the adhesive layer with an elliptical shape.
0 1 2 3 4 5 6 7 0 10 20 30 40 Str e ss [M Pa] Z direction
Stress path in superposed knots zone
Stress path AL1
(a)
42
Figure 3-17 Modelling of hole in the adhesive, zone of knot superposition (a) adhesive exactly following the shape of knots (b) adhesive approximating the shape of knots with an ellipse
With the first model (Figure 3-17a) there is still a peak of stress in the adhesive layer, while the second model (Figure 3-17b) provide lower values of stresses, with the peak stress of the whole model on the timber element; therefore, the hypothesis of maximum stress due to the knot superposition is validated.
This is a non-common situation in reality, because the stress is due to a big distortion in the adhesive layer, coming from modelling knots as holes. The problem can be avoided modelling knots with a different material; the procedure is threated in detail in the next paragraph.
Concluding, in wood applications the effect of the adhesive is negligible, and the failure occurs in wood; the peak stress in adhesive layers affect more elements with real holes, like orifice plates used for mechanical engineering problems.
3.5 QUESTIONS OF MODELLING KNOTS
In a real board knots are made by wood with higher density than the rest of the board. A new model is built filling the knots with higher density elements, assuming for those element a higher MoE. The main problem is modelling the contact between beam and knot; in the reality there is contact until a limit value of stress is reached, after that the two elements separate and behave independently. This is well approximated using a “Interaction contact” in Abaqus, however considering the high computational cost, also a model with “Tie contact” was built, in which there is a simplification, but the computational cost is lower. In the following, the two contact algorithm are explained in detail.
43 TIE CONSTRAINT
A tie constraint is set between the lateral surface of the knot element and the internal surface of holes in the board; this way, adjacent knots of cylinder and board are connected together and relative movements are not allowed. Performing a tensile stress analysis, the stress path for a cross section next to a knot is presented in Figure 3-18.
Figure 3-18 stress distribution in the zone with superposed knots, tie contact
The results show that the stress on wood is almost constant and equal to the applied tension, as it is expected for a perfect board. This way of modelling doesn’t provide a realistic approximation of the stress distribution around a knot, therefore it doesn’t provide any additional information.
INTERACTION CONTACT
The contact is modelled in the critical zone (where there is superposition of knots in different boards with the consequent peak of stresses on adhesive) with an interaction model, in which:
- Normal behaviour with hard contact, that assume that a positive pressure can be transferred between the two surfaces and the surfaces separate when the contact pressure is zero or negative, this method is enforced with linear penalty behaviour, that assume that the contact force is proportional to the penetration distance, thus some degree of penetration will occur.
0 0,2 0,4 0,6 0,8 1 1,2 0 10 20 30 40 Str e ss [M Pa] Z direction
Knots element linked to the beam with tie
contact
Stress path AL1 AL2 AL3
44
- Tangential behaviour with penalty contact, assuming a Coulomb friction model in which the frictional behaviour between the surfaces is characterized with a coefficient 𝜇 = 0,5. The tangential motion is zero until the surface traction reaches a critical shear stress value given by 𝜏𝑐𝑟𝑖𝑡 = 𝜇 ∗ 𝑝, where 𝑝 is the contact pressure between the two surfaces. The two surfaces are not sliding until the shear stress on the surface reaches 𝜏𝑐𝑟𝑖𝑡.
The surfaces are linked fixing the lateral surface of the cylinder as master and the hole on board as slave, assuming finite sliding between surfaces.
Performing a tensile stress analysis the stress path for a cross section next to a knot is presented in Figure 3-19.
Figure 3-19 stress distribution in the zone with superposed knots, interaction contact
The approximation seems to be reasonable in this case; hence, a comparison with the stress path obtained with knots modelled as holes (Figure 3-16b) is made. In the following some conclusions are outlined:
-
The stress distribution on timber slightly differs between the model with knots as holes and the model with interaction contact. The only difference in the stress on wood is at the location of the 10-20mm on z-axis of Figure 3-16b and Figure 3-19, where the path is passing respectively through a hole (i.e. stress equal to zero) and through a filled knot. However, the stress in that part is not relevant because the-0,5 0,5 1,5 2,5 3,5 4,5 5,5 6,5 0 10 20 30 40 Str e ss [M Pa] Z direction
Knots element linked to the beam with
interaction contact
Stress pathAL1 AL2 AL3
45
stress through the filled knot has a low value compared to the remaining part of wood
-
The stress path is very regular in the right part, because in that part there aren’t knots, the stress tend to go to the average stress (corresponding to the applied stress)-
The maximum stress is not on the adhesive layer, because filling the holes there is no more the big distortion on the adhesive layer.-
The model with filled-in has a very high computational costIn the case of superposed knots, the model with filled knots and interaction contact gives a more precise approximation. In these cases, due to the numerical singularities around the knots, the estimation of stresses in the adhesive layers are more difficult. Considering that in all other points the models give very similar results, and the computational cost are extremely high in case of using the interaction contact, the hypothesis of knots modelled as holes seems to be the best compromise. Hereafter, the model with knots modelled as holes and boards connected together with tie constraint will be used.
47
4 REAL SAMPLES SIMULATIONS
Several samples tested in Holzforschung München as single boards were visually graded and their geometry got reconstructed using Abaqus. Forty single boards were assembled randomly in Abaqus forming twenty glulam specimens, each one made by four boards. The numerical analysis is now performed using the following test setups
4.1 TENSILE ANALYSIS
The test was performed with different adhesives, to investigate whether the real case is subjected to differences due to the applied adhesive. The results of the linear elastic analysis on glulam samples based on real boards are showed in Figure 4-1, Table 4-1 and Table 4-2.
Figure 4-1 Real tested board, subjected to tensile force
Table 4-1 Stresses, disp. and MoE for tensile loaded glulam, different adhesives
No ad MUF PRF PUR
σmax [Mpa] 98,04 96,56 96,74 96,89
Δu [mm] 0,427 0,427 0,427 0,427
Et,0 [MPa] 12205 12236 12240 12245
*All results are the average of ten values, obtained with ten glulam samples
Table 4-1 shows the results in terms of MoE and stresses, averaged for all glulam specimen. In all cases maximum stresses are developing in timber. The difference in terms of stress and modulus of elasticity between the different cases is negligible. Due to the
48
big irregularity of knots shapes and position in the real boards, the MoE was studied on all the four lateral faces of the glulam. Results on different faces are shown in Table 4-2.
Table 4-2 Disp. and MoE from simulations in different faces of the board
Back Front Down Up
Avg(Δu) [mm] 0,402 0,4194 0,4030 0,4392
Avg(Et,0) [MPa] 12936 12418 12923 11859
St. dev.( Et,0) [MPa] 378 319 592 487
The greater variation in terms of modulus of elasticity is between upper and lower face; this is due to the presence of knots on these faces that, as shown in the previous chapter significantly affect the stiffness of a board. Between these two faces, the standard deviation measured between different glulam specimens is higher, based on the knot variability on those surfaces. The MoE, depending on the position of the path on which displacement are measured, can vary up to 10%, such as for example between upper and lower boards. Additionally, the stress distribution over a cross section for different types of adhesive was studied. The aim is in this case the investigation of the effect of different adhesives, therefore the path is chosen far from knots using in the model respectively MUF and PUR adhesive. Real boards were tested using MUF adhesive. Results from numerical simulations are showed in Figure 4-2.
0 0,2 0,4 0,6 0,8 1 1,2 0 10 20 30 40 Str e ss [M Pa] Z direction
PUR Adhesive
Stress path AL1 AL2 AL3 (a)49
Figure 4-2 Stress path far from a knot on a real board (a) with PUR adhesive (b) with MUF adhesive
Similar to the boards generated with random knots (sub-chapter 2.1.1), the adhesive doesn’t give a significant contribution to stiffness and stresses on boards. It is clear from Figure 4-2a and Figure 4-2b that the stress on adhesive is directly proportional to its stiffness; the MUF adhesive stiffness is about half of timber stiffness, whereas the PUR stiffness is about 0,2 times the stiffness of timber, therefore the stress on adhesive is respectively around 0,5𝑀𝑝𝑎 and 0,2𝑀𝑝𝑎.
4.2 BENDING ANALYSIS
Bending analysis in edgewise and flatwise direction were performed on the real samples for all types of adhesives with positive and negative bending moments. The test setup is the same explained in Chapter 3. Results in terms of stress, displacements and MoE are showed in Table 4-3.
Table 4-3 Stress, disp. and MoE on edgewise moment loaded glulam, different adhesives
No adhesive No adhesive M- MUF PRF PUR σmax [Mpa] 36,79 31,07 37,09 37,15 37,22 σmin [Mpa] -20,35 -30,30 -21,06 -21,07 -21,07 ucentral [mm] 18,296 18,346 18,268 18,277 18,285 ulateral [mm] 17,782 17,829 17,755 17,764 17,772 Em,local [MPa] 13869 13777 13896 13890 13885 Em,global [MPa] 13766 13729 13788 13781 13775
*All results are the average of ten values, obtained with ten glulam samples 0 0,2 0,4 0,6 0,8 1 1,2 0 10 20 30 40 Str e ss [M Pa] Z direction
MUF Adhesive
Stress path AL1 AL2 AL3 (b)50
Comparing the behaviour of front and back layer for the case with no adhesive, results are slightly varying, as showed in Table 4-4.
Table 4-4 Disp. and MoE on front and back board, edgewise moment
Front board Back board
ucentral [mm] 18,296 18,281
ulateral [mm] 17,782 17,765
Em,local [MPa] 8754 8715
Em,global [MPa] 9403 9410
*All results are the average of ten values, obtained with ten glulam samples
In Table 4-4 “Front board” and “Back board” refer to the external boards making the glulam sample. They are studied both because the different configuration of knots in these boards may lead to a torque effect, thus the study is conducted on both boards. Table 4-5 and Table 4-6 show the results from the flatwise bending analysis; again, the effect of the adhesive is not significantly affecting the stress nor the MoE and also the difference between the two external boards is low.
Table 4-5 Stress, disp. and MoE on flatwise moment loaded glulam, different adhesives
No ad No ad M- MUF PRF PUR
σmax [Mpa] 42,38 54,81 46,37 46,38 46,40
σmin [Mpa] -46,85 -35,61 -50,54 -50,57 38,31
ucentral [mm] 14,315 14,441 14,206 14,211 14,216
Em [MPa] 12936 12822 13035 13030 13025
*All results are the average of ten values, obtained with ten glulam samples
Table 4-6 Disp. and MoE on upper and lower board, flatwise moment
Lower layer Upper layer
ucentral [mm] 14,309 14,331
Em [MPa] 12941 12921
*All results are the average of ten values, obtained with ten glulam samples
Based on the results from the analysis, some conclusions are outlined:
- The difference in terms of modulus of elasticity is less than 1%, both between positive and negative moment and between boards with or without adhesive
51
- Varying the moment sign there is no significant variation over displacements, while on stresses the variation reaches 32%. The variation on stress concentration is depending on the eccentricity of knots; big eccentricity of knot correspond to big stress concentration around it, therefore there is a direct correlation between the two. This relation will be studied in the following.
- The values of modulus of elasticity are higher than in the tensile case, as expected from theory; the difference is about 8%
4.3 MOE WITH 2 PERFECT LAMELLAS
Results of the analysis showed that, for some samples, the variation of the results in terms of MoE between the two external lamellas is not negligible (up to 20%); this difference is due to the position of knots in these lamellas, that affect the displacement on the measurement path. In order to have a quantitative measurement of the MoE variation due to knots, samples are modified in Abaqus, substituting two boards with two perfect boards, in which no knots are present in the test length; the procedure is repeated for each couple of boards making the sample. Results are showed in Table 4-7.
Table 4-7 Disp. and MoE modifying two boards at a time of a glulam specimen
Original sample Perfect board 1-4 Perfect board 1-3 Perfect board 2-3 Δu [mm] 0,473 0,407 0,442 0,439 Et,0 [MPa] 11020 12798 11786 11854
Results show that the greater advantages in terms of MoE and displacements, are obtained when the two perfect boards are in external position; this shows once again the effect of lamination of glulam, for which the defects in internal lamellas are reduced by the effect of the coupled lamellas.