PhD Program in Molecular Medicine Cycle XXXII
CEBP EXPRESSION PATTERN REGULATES RAP1 PROTEIN LEVELS IN ADIPOSE TISSUE OF OBESE PATIENTS AND
DISTINGUISHES SUBJECTS WITH METABOLIC IMPAIRMENT
TUTOR
Prof. Elisabetta Ferretti
SUPERVISOR
Prof. Francesco Dotta
CANDIDATE Dr. Caterina Formichi
INDEX
1) INTRODUCTION 4
1.1) Definition and epidemiology of obesity and metabolic syndrome 4
1.2) Heterogeneity of obesity: clinical implications of adipose tissue distribution 7
1.3) Role of different adipose tissue depots and adipose tissue dysfunction in obesity-related metabolic complications 11
1.4) Obesity aetiology: a complex scenario 18
1.5) The telomere-shelterin complex physiology 24
1.6) Telomere length and metabolic impairment 29
1.7) Telomeric and extra-telomeric roles of RAP1 31
2) AIM OF THE STUDY 35
3) EXPERIMENTAL DESIGN 35
4) MATERIALS AND METHODS 37
4.1) Patients 37
4.2) Experimental Procedures 41
4.2.1) RNA extraction 41
4.2.2) Western Blot analysis 41
4.2.3) Cell Culture 42
4.2.4) Immunofluorescence on cultured cells 43
4.2.5) RAP1 promoter sequence analysis 43
4.2.6) Chromatin Immunoprecipitation (ChIP) analysis 44
4.2.7) Real-Time PCR for ChIP analysis of RAP1 promoter 45
4.2.8) Relative Telomere Length (RTL) measurement in adipose tissue 45
4.3) Statistics 46
5) RESULTS 47
5.1) RAP1 expression is reduced in visceral adipose tissue of obese patient 47
5.2) PPARalpha expression is reduced in visceral adipose tissue from obese patients 50
5.3) CEBP inhibitory expression pattern is observed in obese patients 51
5.4) CEBP regulates RAP1 expression 54
5.5) RTL in visceral adipose tissue is shortened only in obese subjects with metabolic syndrome 56
6) DISCUSSION 59
1) INTRODUCTION
1.1) DEFINITION AND EPIDEMIOLOGY OF OBESITY AND METABOLIC
SYNDROME
Overweight and obesity are defined as abnormal or excessive fat accumulation that presents a risk to health (1, 2). A crude population measure of obesity is the body mass index (BMI), a person’s weight (in kilograms) divided by the square of his or her height (in meters) (3).
Overweight and obesity are classified in accordance with specified weight categories calculated using the formula for body mass index (BMI): a “healthy” weight constitutes a BMI between 18.5 and 24.9 kg/m2, a BMI between 25 and 29.9 kg/m2 is considered overweight, and a BMI of 30 kg/m2 or greater is considered obese (4). Obesity is further classified as class I (BMI ≥30 kg/m2 but ≤35 kg/m2), class II (BMI ≥35 kg/m2 but ≤40 kg/m2), and class III (BMI ≥40 kg/m2) (4). Despite its simplicity, along with its consistent association with important health outcomes, which contributes to its use in research and clinical practice, BMI fails to capture multiple important factors including, for example, muscle mass (high in athletes or low in the elderly), different locations of adiposity, and differences among races (4).
Once considered a problem only in high income countries, overweight and obesity are now dramatically on the rise in low- and middle-income countries, particularly in urban settings (3). The worldwide prevalence of overweight and obesity has risen by over 27% in the last three decades and, although in developed nations the rate of increase of obesity has slowed over the last decade, extreme forms of obesity are becoming more prevalent (5). Since the 1970s, data from the National Health and Nutrition Examination Survey (NHANES) reveal a consistent upward trending of overweight/obesity among adults and youth, regardless of race, ethnicity, gender, or age in the USA (4). Among adults aged 18 years or older, 11% of
men and 15% of women were obese in 2014 (6). The U.S. incidence during the past two decades has been higher in women (38.3%) than in men (34.3%) (7). It has been projected (based on current incidence figures) that by 2030 nearly 40% of the world's population will be overweight and one in five people will be obese (7). The current epidemic of obesity has been reported as the leading cause for the decreased life expectancy forecast for the next generation (8).
Obesity is currently one of the main public health concerns since it is a major contributor to the global burden of chronic diseases, including cardiovascular disease (CVD), non-alcoholic fatty liver disease (NAFLD), type 2 diabetes mellitus (T2DM), and certain types of cancer (9). These and other comorbid conditions directly related to obesity decrease longevity and quality of life (7). A meta-analysis of 26 studies found that obesity was associated with a relative risk for all-cause mortality of 1.22, for coronary heart disease mortality of 1.57, and for CVD mortality of 1.48, relative to the normal weight category (10).
Studies suggest that for every 5-unit increase in BMI above 25 kg/m2, overall mortality increases by 29%, vascular mortality by 41% and diabetes-related mortality by 210% (11). Obesity is associated with increases in annual health-care costs of 36% and medication costs of 77% compared with being of average weight (11). If obesity could be addressed early in life, it could have a substantial impact on healthcare costs (11).
The metabolic syndrome of dyslipidemia, insulin resistance (IR), and central adiposity is strongly associated with obesity (7). Metabolic Syndrome (MetS) is defined by a constellation of an interconnected physiological, biochemical, clinical, and metabolic factors that directly increase the risk for the development of CVD and T2DM (12 - 15). Age, sex, socioeconomic status, and ethnic background may change the prevalence, but it is estimated that 25–35% of adults may have MetS (15). Different diagnostic criteria were proposed (15). According to ATP III criteria revised, metabolic syndrome is diagnosed in
presence of any 3 of the following 5 features: elevated waist circumference ≥102 cm in men or ≥88 cm in women (however, population- and country-specific cut-off points have been proposed); Triglycerides (TGs) >150 mg/dL (1.7 mmol/L) or drug treatment; High-density lipoprotein (HDL)-cholesterol <40 mg/dL (1 mmol/L) in male or <50 mg/dL (1.3 mmol/L) in female or drug treatment; systolic blood pressure > 130 and/or diastolic blood pressure > 85 mmHg or drug treatment; fasting plasma glucose >100 mg/dL (5.6 mmol/L) or overt diabetes mellitus/drug treatment (16 - 19).
MetS is not a disease but a cluster of individual risk factors, whose main purpose is to identify individuals with increased risk of developing CVD and diabetes mellitus (15). Nevertheless, progression to overt diabetes in patients with obesity is not clearly predicted: while some obese individuals progress to T2DM, others only have mild metabolic abnormalities, suggesting that the absolute amount of fat stored may not be the most important factor in determining the relationship between obesity and T2DM (8).
With respect to the pathophysiology of metabolic syndrome, visceral fat and its clinically more easily measured correlate of waist circumference are gaining increasing attention as strong predictors of the metabolic syndrome, even independent of BMI (20). These correlations offer a plausible explanation for the observed increased risk of CVD among subjects with so-called normal weight central obesity (20). In fact, it is generally agreed on that increased central/abdominal adiposity – which is related to insulin resistance - is at the core of MetS (21).
Much is known about individual risk factors for obesity, but little about how they may be interrelated (7).
Obesity is considered to be largely preventable and mostly caused by recent changes in the so-called obesogenic environment (7). The modern obesity epidemic is largely explained by environmental factors, with excess energy intake and physical inactivity pinned as the main culprits (5). However, even in shared environments, only a subset of individuals
develops obesity (5). There appears to be a differential propensity to obesity at the individual level, with biological factors such as sex, age and in utero environment contributing to this variability (5). Genes and gene expression have been implicated as significant cofactors. (7).
Behavioral and pharmacological interventions to manage obesity seem to have little effect in tackling the epidemic (5). Bariatric surgery, though effective at reducing body weight and related comorbidities, and improving quality of life is invasive and is associated with a number of other complications (5). Without elucidating the biological, environmental and social causes of the current obesity epidemic, we will remain ill-equipped to prevent, manage and treat this complex disorder (5).
1.2) HETEROGENEITY OF OBESITY: CLINICAL IMPLICATIONS OF
ADIPOSE TISSUE DISTRIBUTION
Although total fat mass is a more accurate measure of the metabolic phenotype than BMI, the absolute amount of body fat does not unambiguously reflect metabolic health at an individual level (9). This is exemplified by the finding that abdominal liposuction, which is the surgical removal of subcutaneous adipose tissue in the abdominal region, does not significantly improve obesity-associated metabolic abnormalities such as insulin resistance in humans (9).
In 1947, Vague firstly identified different adipose tissue distribution patterns and coined the terms ‘android obesity’, to refer to adipose tissue accumulated preferentially in the trunk/upper body area, and ‘gynoid obesity’, to refer to preferential adipose tissue accumulation in the hips and thighs (22). He also suggested that android obesity was a form of obesity closely associated with diabetes and heart disease whereas gynoid obesity was much less associated with complications (22). Subsequent studies mostly confirmed
the detrimental role of an excessive abdominal fat, compared to lower-body fat accumulation. These differences in disease risk are due to strikingly divergent functional properties of these adipose tissue depots (9). Total adipose tissue mass is not the predominant factor that explains the increased metabolic risk in obese individuals, rather, the location where the excessive calories are stored in combination with adipose tissue function seem to determine metabolic health. (9).
Adipose tissue is not a single homogeneous compartment, but rather a tissue with specific regional depots with varying biological functions (23). Among typical approaches to classify adipose tissue, one is based on simple anatomic distribution which identifies two major compartments: subcutaneous adipose tissue, the adipose tissue layer found between the dermis and the aponeuroses and fasciae of the muscles, and visceral adipose tissue, which includes organ-surrounding fat depots within the chest (intrathoracic adipose tissue), abdomen, and pelvis (intraabdominopelvic adipose tissue) (23). Furthermore, interstitial adipose tissue and adipose tissue in bone marrow also exists (23). The subcutaneous adipose tissue of the lower trunk and the gluteal-thigh region has a thin fascial plane dividing it into superficial (between the skin and a fascial plane) and deep (between the muscle fascia and a fascial plane) portion (23). Abdominal visceral adipose tissue is further subdivided into retro- and intraperitoneal (omental and mesenteric fat) components (23) (Figure 1).
Figure 1: the anatomical localization of different fat depots (adapted from Tchernoff et al. 2013).
Adipose tissue is also named according to special biological functions, such as white, mammary gland, brown, and bone marrow adipose tissues: white adipose tissue (WAT) functions mainly as an energy reservoir, insulator, and as a source of recently discovered hormones; thermogenesis is the main function of brown adipose tissue (BAT) in mammals; mammary gland adipose tissue plays an important role in epithelial cell growth and milk production, whereas bone marrow adipose tissue might participate in hematopoiesis and osteogenesis (23, 24).
Sex-related difference in fat depots distribution and function has been described, suggesting a role of sex hormones in regional fat accumulation. Thirty-five years after the seminal observations of Vague referring to android (male) and gynoid (female) obesities, Krotkiewski et al. suggested that sex hormones might be involved in regulating the typical gender differences in regional body fat distribution (25, 26). They also observed that this regional adipose tissue distribution was unrelated to the presence or absence of obesity
(25). In men, visceral adipose tissue accumulation generally increases with the amount of total body fat, whereas in women, the volume of visceral adipose tissue is less affected by the amount of total body fat compared with male obesity (25). Premenopausal women accumulate a substantial amount of total body fat before a substantial amount of visceral adipose tissue is observed; however, in post-menopausal women adipose tissue distribution vary greatly, displaying a preferential visceral fat accumulation (25). The impact of androgens and estrogens on human body fat has been described in several studies. In men, low circulating levels of total testosterone are generally associated with abdominal and/or visceral obesity and supraphysiological testosterone treatment leads to increased visceral adipose tissue accumulation and concomitant alterations in the metabolic profile (25, 27-31). In women, based on the common observation of abdominal obesity in patients with the polycystic ovary syndrome (PCOS), investigators have often concluded that hyperandrogenism in females leads to abdominal obesity and hyperinsulinemia, however, recent advances in our understanding of PCOS reveal that the link between hyperandrogenism and abdominal obesity may be more complex than initially thought (25). Association studies on circulating androgens and body fat distribution in women are also equivocal: while some studies demonstrate a positive association between high total or free plasma testosterone levels and visceral fat accumulation, others have reported negative associations and some failed to observe any correlation (25, 32-36). Estrogens are produced mainly by the ovaries in premenopausal women, but are also generated through peripheral aromatization of androgens in several tissues, especially fat, in postmenopausal women and men (25). Estrogens have a significant influence on adipose tissue function and metabolism and may actually be closely involved in determining the sex dimorphism in both body composition and body fat distribution (25). Estrogens directly stimulates pre-adipocytes proliferation and high concentrations of estradiol decrease lipoprotein lipase (LPL) and increase hormone-sensitive lipase expression in subcutaneous mature
adipocytes while the opposite is observed at low estrogen doses, suggesting that estrogens may have a biphasic action on adipose tissue lipogenic and lipolytic capacity (25).
Other factors involved in regulation of fat distribution are neuro-hormonal factors, such as endocannabinoid system and hypothalamic-pituitary-adrenal axis. Dysregulation of the endocannabinoid system in humans seems to be preferentially associated with visceral obesity rather than with overall adiposity; the hypothesis of a peripheral over activation of the system is consistent with the metabolic benefits of endocannabinoid antagonist treatments, which were found to go beyond the effects of dietary restriction and weight loss alone (25). A number of studies and review articles suggest that chronic stress or poor coping in stressful situations is associated with mild hypercortisolemia and prolonged sympathetic nervous system activation, which in turn could favor accumulation of visceral fat (25).
Last, ethnicity and lifestyle factors also could have a role in modulating adipose tissue distribution.
1.3) ROLE OF DIFFERENT ADIPOSE TISSUE DEPOTS AND ADIPOSE
TISSUE DYSFUNCTION IN OBESITY-RELATED METABOLIC
COMPLICATIONS.
Adipose tissue (AT) has been long considered a merely passive reservoir for energy storage, however it’s now fully clarified that adipose tissue is a complex endocrine organ and has primary roles in energy homeostasis control, sensing energy demand and secreting a plethora of endocrine, paracrine and autocrine factors (37).
The different fat depots are heterogeneous not only in terms of metabolic capacities, but also of adipokine secretion pattern and different impact on metabolic risk (21). Many investigators have reported that visceral intraabdominal adipose tissue is a major
contributor to metabolic risk, whereas some investigators have suggested that subcutaneous adipose tissue may have a protective role (38).
Abdominal fat depots are characterized by rapid uptake and storage of energy from the diet and a high lipid turnover (i.e. lipolysis), whereas the lower-body fat stores have a reduced lipid turnover rate and sequester lipids that would otherwise be directed towards non-adipose tissues (9). Lipid accumulation in a given fat compartment reflects the balance between triglycerides (TGs) synthesis and lipolytic rates (25). Lipogenesis is the synthesis of esterified fatty acids (FAs), which form TGs from carbohydrates or other energy sources acquired in the diet (21). Lipid accumulation in adipose tissue depends on circulating FAs uptake, provided by the enzymatic hydrolysis of TGs contained in the chylomicrons by the LPL; after FAs enter the adipocyte, re-esterification is necessary for lipid storage in TG form (21).
Fat cell size is a critical determinant of lipolytic responsiveness: larger adipocytes have higher basal and stimulated rates of lipolysis (25). Subcutaneous and visceral adipose tissues seem to display different responsiveness to lipolytic regulators. Omental adipocytes, indeed, seem to be highly responsive to -adrenergic-stimulated lipolysis and resistant to anti-lipolytic effect of insulin, compared to subcutaneous cells (25).
Increased metabolic activity of visceral fat produces free fatty acids (FFA) that can directly enter liver via portal circulation and lead to impairment in liver metabolism with overproduction of apolipoprotein B-containing lipoproteins, increased hepatic gluconeogenesis and reduced hepatic degradation of insulin, exacerbating systemic hyperinsulinemia and resulting in hyperlipidemia, glucose intolerance, hypertension, and ultimately atherosclerosis (38). Moreover, chronic overexposure to FFA leads to lipotoxic damage and dysfunction of pancreatic -cells and, ultimately, to development of diabetes mellitus.
However, the fact that visceral fat contributes to only 15% of the total systemic free fatty acids, whereas the majority of free fatty acids are contributed by nonsplanchnic adipose tissue, raises doubts over contribution of visceral fat to peripheral insulin sensitivity (38). It has been demonstrated that deep abdominal subcutaneous adipose tissue has a higher expression of pro-inflammatory, lipogenic and lipolytic genes, and contains higher proportions of saturated fatty acids and an increased proportion of small adipocytes (9). Some authors suggest that subcutaneous truncal adipose tissue has significant impact on development of insulin resistance; in contrast to abdominal subcutaneous adipose tissue, larger subcutaneous thigh fat mass has a protective effect (38).
It has been proposed that excess visceral adiposity may be a consequence of a ‘dysfunctional’ subcutaneous adipose tissue. Adipose tissue is the main lipid storage depot in our body and, as such, has a crucial role in buffering the daily influx of dietary fat entering the circulation; the ability of our body to adapt to (chronic) changes in caloric intake largely depends on the ability of adipose tissue to accommodate a potential excess of calories (9). In obesity, the subcutaneous adipose tissue may fail to appropriately expand to store the energy surplus, which in turn may lead to ectopic fat deposition in other tissues involved in metabolic homeostasis (i.e., skeletal muscle, the liver, and visceral adipose tissue), an event commonly defined ‘lipotoxicity’ (9, 37). On the other hand, the proportion of fatty acids released from visceral adipose tissues increases with visceral obesity, possibly through the combination of visceral adipocyte hypertrophy as well as increased relative lipolytic responsiveness to positive lipolytic stimuli and blunted inhibition by insulin specifically in visceral adipose tissue. The factors underlying impaired adipose tissue expandability are not yet fully understood, but the properties of its extracellular matrix and angiogenic capacity seem to be involved (9).
“Healthy” adipose tissue (AT) expansion is achieved by recruiting and differentiating adipose precursor cells to compensate the need for increased lipid storage; when a
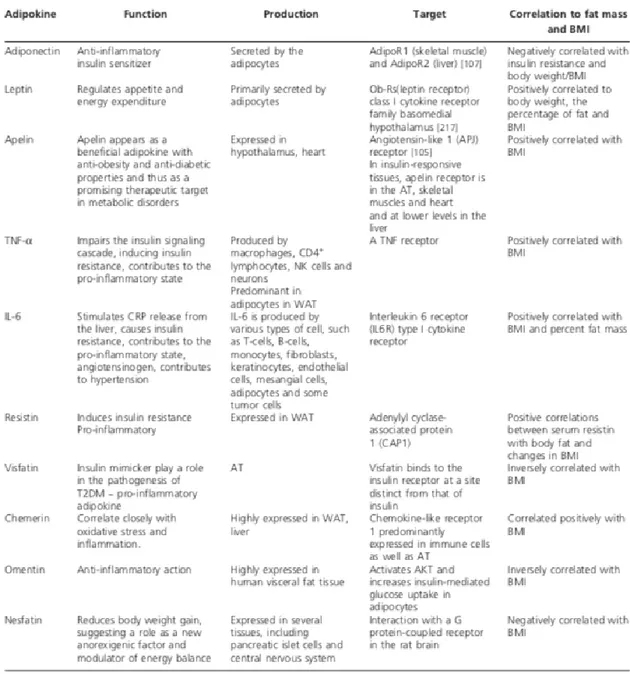
threshold limit at which additional anabolic pressure cannot be accommodated is reached, mature adipocytes accumulate fat and initiate an inflammatory program in response to this stress (37). The inability to increase adipose tissue mass through adipocyte hyperplasia will evoke adipocyte hypertrophy during a prolonged positive energy balance (9). Indeed, AT dysfunction is characterized by adipocyte hypertrophy, increased macrophage recruitment and changes in adipokine secretion profile resulting in a pro-inflammatory response (8). Some of the adipokines (e.g., leptin, resistin, visfatin, TNF-a) have a pro-inflammatory role and are associated with an increased risk of type 2 diabetes, stroke and other cardiovascular diseases, others (e.g., adiponectin, omentin) have an anti-inflammatory and cardioprotective role (8) (Figure 2).
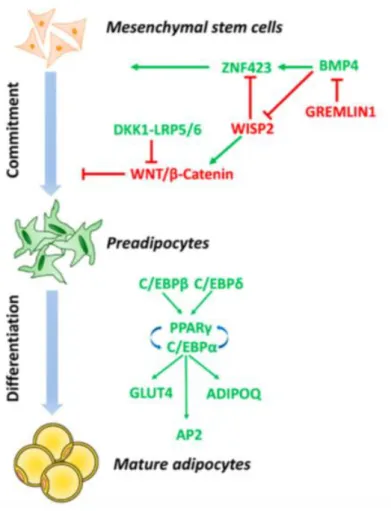
Several defects in adipogenesis could be associated with impaired adipogenesis and AT dysfunction. Adipogenesis is a multi-step process, which could be subdivided in two main phases: commitment of mesenchymal stem cells (MSCs) precursor and terminal differentiation (37) (Figure 3). In the first phase, mesenchymal stem cells are induced by bone morphogenetic protein 4(BMP4) to differentiate into preadipocytes, morphologically similar to progenitor cells but no more capable of differentiate into other cell types. BMP4 induces nuclear translocation of transcriptional activator zinc-finger protein 423 (ZNF423), which enables peroxisome proliferator-activator receptor gamma (PPAR) transcription in pre-adipocytes. Along with BMP4/ZNF423 pathway, wingless-type mouse mammary tumor virus integration site family (WNT) signaling pathway inhibition through transient expression of Dickkopf (DKK) family proteins is also required to guarantee the induction of pre-adipocyte differentiation. WNT activation, indeed, is associated with inhibition of PPAR and CCAAT/enhancer binding protein alpha (C/EBP) expression and a shift towards osteoblastic cell lineage differentiation. During terminal differentiation to mature adipocyte, the preadipocyte acquires the necessary machinery for lipid transport and synthesis, insulin sensitivity and adipocyte-specific proteins secretion. The acquisition of
mature adipocyte phenotype is regulated by the sequential expression of a cascade of transcription factors: induction of C/EBP and C/EBP in committed pre-adipocytes leads to expression of C/EBP and PPAR, which in turn induce the expression of key adipogenic genes, necessary for adipocytes function (37).
Figure 2: summary of most important adipokines and functions. APJ: Apelin receptor: BMI: Body mass index; CRP: C-reactive protein; T2DM: Type 2 diabetes mellitus; WAT: White adipose tissue (adapted from Katsareli et al 2014).
Figure 3: molecular mechanisms involved in adipogenesis (adapted from Longo et al. 2019).
Hypertrophic adipocytes have a markedly impaired capacity to rapidly store dietary fat, because they are already overloaded with stored lipids, which results in a redirection of lipids towards other metabolic organs. It has been largely demonstrated that excessive lipid accumulation in ectopic tissues leads to local inflammation and insulin resistance: the ectopic fat accumulation in the pancreas, for example, contributes to β-cell dysfunction (37). In addition, hypertrophic adipose tissue is characterized by infiltration of adaptive and innate immune cells and altered adipokine secretion, contributing to the generation of a global proinflammatory profile, further exacerbating insulin resistance (9, 25) (Figure 4).
Figure 4: white adipose tissue ‘healthy’ and ‘unhealthy’ expansion in obesity. (adapted from Longo et al 2019)
Intriguingly, expansion of adipose tissue does not necessarily translate into metabolic abnormalities. The impaired adipose tissue remodeling in obesity is not a homogeneous condition, and obesity does not necessarily translate into insulin resistance (IR) and increased risk for metabolic comorbidities (37). A subset of obese individuals (∼10–30% of obese individuals), often referred to as ‘metabolically healthy obese’ (MHO), seems to be relatively protected against worsening of metabolic health (9). However, it can be debated whether MHO individuals are really healthy since several recently performed meta-analyses of prospective cohort studies have shown that the majority of MHO subjects have a markedly increased risk of developing T2DM and CVD over time as compared to healthy normal weight subjects (9). Longitudinal studies are providing compelling evidence that metabolically healthy obesity is likely to be a transient condition (37). These data indicate that major efforts should be made to prevent obesity and to maintain a metabolically healthy phenotype in subjects that already have developed obesity (9). Furthermore, to support this concept, a part of the obesity spectrum is represented by metabolically obese
normal-weight (MONW) individuals, non-obese subjects characterized by increased levels of visceral adiposity, IR, and a higher susceptibility to T2DM and CVD (37). These data support the hypothesis that both regional depositions of adipose tissue (visceral and/or subcutaneous) and adipocyte morphology (cell size; hypertrophy and/or hyperplasia) contribute to an increased metabolic risk (37).
1.4) OBESITY AETIOLOGY: A COMPLEX SCENARIO.
On a basic level, weight gain results from a positive energy balance in which consumption is in excess of expenditure (4). The pathogenesis of obesity, however, is a complex scenario. Many factors, including genetics, epigenetics, and lifestyle factors, have been implicated in obesity pathogenesis (37).
Obesity arises from the interactions between an at-risk genetic profile and environmental risk factors, such as physical inactivity, excessive caloric intake, the intrauterine environment, medications, socioeconomic status, and possibly novel factors such as insufficient sleep, endocrine disruptors, and the gastrointestinal microbiome (39). Even the response to weight-loss intervention is highly variable between obese subjects and has been shown to be partly dependent on genetic components.
Industrialization of food production, providing inexpensive and highly processed food, is a major environmental cause. Culture and socialization also play a role (7). The role of genetics is much less than that of the environment. Rather than playing an independent role, genes seem to increase the risk of weight gain based on the way they interact with other risk factors, such as unhealthy diets and inactive lifestyles (7). Bray et al. recently described the relationship between genes and the environment by stating ‘‘genes load the gun—the environment pulls the trigger’’ (40). Inherited propensity toward obesity has long been recognized, supported by numerous family and twin studies, which demonstrated that
approximately 50–70% of variance in BMI is attributable to genetic differences, and recent studies in ethnically diverse populations underline the relevance of genetic contribution (41-44). In the past 10 years, genome-wide association studies have been particularly effective in the identification of genetic loci associated with adiposity outcomes (45). In addition, epigenetics and epigenomics studies are providing insights not only into the heritability of obesity-related traits, but also on how the environment can influence such heritability (41).
Emerging researches exploring the influence of genetics and biological mechanisms on energy balance may lead to a broader range of interventions that can be used to prevent or treat obesity (4).
Genetic causes of obesity can be broadly classified into:
1. Monogenic obesity: results from a single gene mutation, primarily located in the leptin- melanocortin pathway.
2. Syndromic obesity: severe obesity associated with other phenotypes such as neurodevelopmental abnormalities and other organ/system malformations.
3. Polygenic obesity: caused by cumulative contribution of a large number of genes whose effect is amplified in a ‘weight gain promoting’ environment (46).
Although the current focus of obesity genetics research is on the complexity of the multiple genes and gene-gene and gene-environment interactions likely to be involved in common forms of human obesity, the discovery of single genes responsible for obesity in animal models, albeit rare causes of obesity in humans, provided the earliest breakthroughs in identifying mechanisms involved in human obesity, pointing at a crucial role of hormonal and neural networks in regulating adiposity, particularly in the appetite control centers of the hypothalamus (41).
A milestone in the field of genetic of obesity was the identification in 1994 of the gene responsible of the obese phenotype in ob/ob mice, a peculiar mouse strain who reached a 3 times higher weight compared to other mouse strain (47, 48). The encoded protein, leptin, normalized body weight, when injected into ob/ob mice. The successful treatment of children with leptin deficiency with recombinant leptin showed for the first time that mutations in a single gene could lead to hyperphagia and obesity (42). Leptin signaling modulates energy balance through a combination of melanocortin-dependent/independent pathways (44). Subsequently, other obesity-causing gene mutations were discovered, such as leptin receptor (LEPR), proopiomelanocortin (POMC), prohormone convertase 1 (PCSK1), and melanocortin 4 receptor (MC4R) (41, 42). All these genes are involved in the leptin-melanocortin signaling pathway, which regulates energy homeostasis and food-intake. Leptin dependent signaling inhibit food intake through effects on proopiomelanocortin and cocaine and amphetamine related transcript neurons (POMC/CART) in the arcuate nucleus of the hypothalamus. POMC protein is processed by the prohormone convertases 1 and 2 (PC1 and PC2) to produce a broad range of biologically active peptides, such as α- β- and γ-melanocyte stimulating hormone (MSH) and β-endorphins, which drive the anorexigenic signal through binding to melanocortin-4 receptors (MC4R) on neurons in the paraventricular nucleus (PVN). Signals from MC4R govern food intake via secondary effector neurons that lead to higher cortical centers, a process that involves brain-derived neurotrophic factor (BDNF) and neurotrophic tyrosine kinase receptor type 2 (NTRK2 coding for the receptor called tropomyosin-related kinase B, TrkB). Other regulators, such as SIM1, have been found to modulate the effect of this pathway. In contrast, a separate group of neurons expressing neuropeptide Y (NPY) and agouti related peptide (AGRP) produces molecules that act as potent inhibitors of MC4R signaling, resulting in a potent orexigenic signal (41, 46). Mutations in the leptin/melanocortin pathway are rare and lead, apart from extreme obesity with an early
onset, to additional phenotypical manifestations, including red hair (POMC), reduced or impaired fertility (PC1, leptin and LEPR), adrenal insufficiency (POMC), and impaired immunity (LEP) (42).
Despite the significant contribution of monogenic obesity to our general knowledge on genetics and physiology of body weight regulation, the majority of the individuals with obesity develops “common (multifactorial) obesity” which is attributed to the interplay between multiple loci (polygenic), though each with rather small effects on BMI, and the “obesogenic” environment (44). Any of a group of alleles at distinct gene loci that collectively control the inheritance of a quantitative phenotype or modify the expression of a qualitative character are termed ‘polygenic’ variants (42). It is generally assumed that for quantitative traits, each allele has a small effect and the allelic effects can be additive or non-additive. If an individual harbours many polygenic variants that increase body weight, obesity can ensue (42). So far, more than 870 SNPs strongly associated with BMI have been identified in large scale genome-wide association studies (GWAS) (44). The GWAS findings indicate that despite identification of hundreds of loci associated with obesity, they only explain 5% of the variance of BMI, thus, explaining the remaining variability appears to be highly challenging (44).
The role of genes in the pathogenesis of obesity has been considered a non-modifiable risk factor, so far. However, growing evidences demonstrate that gene expression could be modified throughout life by the interaction with environmental factors. The role of environment and gene-environment interactions in the development of obesity and obesity-related comorbidities offers a logical explanation for the growing epidemic of obesity over the past few decades without a radical change in the genome (46). Considering the metabolic diversity of obesity, epigenetic modifications are likely representing one of the determining factors and may constitute another level of regulation in mediating disease risk (44). Epigenetic modifications can be considered as the differential packaging of the DNA
that either allows or silences the expression of the certain genes across tissues (46). The most studied epigenetic mechanism is DNA methylation, that is the addition of a methyl group to a cytosine with a guanine as the next nucleotide (CpG site) by DNA methyltransferases (DNMTs). CpG sites are most frequently found in the promoter regions of the genes, and a methylation at this site usually is associated with repression of gene expression by inhibiting the binding of transcription factors. Candidate gene methylation changes have been implicated in obesity, appetite control and metabolism, insulin signaling, immunity, inflammation, growth, and circadian clock regulation (46). Histone modifications are also involved in the epigenetic regulation of adipogenesis and can play an important role in obesity development. Modulation of five key regulatory genes of adipogenesis, pre- adipocyte factor-1 (Pref-1), CCAAT-enhancer-binding protein β (C/EBP β), C/EBPα, PPARγ, and adipocyte protein 2 (aP2), is regulated by histone modifications during adipocyte differentiation (46). Among epigenetic regulation of gene expression, micro-RNAs (miRNA) play an important role in various biological processes, including proliferation and differentiation of adipocytes, and have been shown to be associated with insulin resistance and low-grade inflammation seen in obese individuals (46). miRNA are small noncoding RNA sequences 18 to 25 nucleotides long capable of regulating gene expressions by gene silencing and post-transcriptional changes and emerging evidence support the role of miRNA in obesity and the associated metabolic changes that can serve as biomarkers, or potentially therapeutic targets for intervention (46). Last, in the context of epigenetic changes, endocrine disrupting chemicals (EDCs termed “obesogens”) could also influence on adipose tissue biology, the hormonal milieu and the homeostatic mechanisms of weight regulation (46).
Recently, researchers have focused their interest on the role of gut microbiota in several human diseases and an involvement of microbiome in metabolism has been suggested. Gut flora, is involved in immune function and metabolic processes and plays a role in
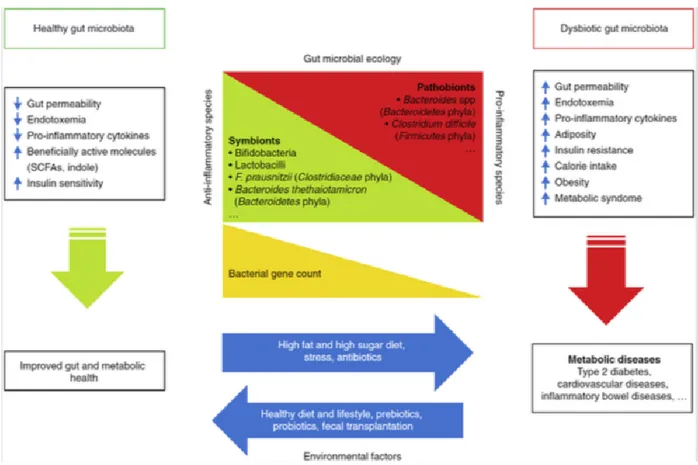
inflammatory disorders, including obesity (7). Although quite complex, there is now emerging clarity about the association of microbiome with the development of obesity and metabolic disorders, the risk for type 2 diabetes, and cardiovascular disease. (7). Gut microbiome represents densely populated microorganisms such as bacteria, fungi, Archaea, protozoa, and viruses, which colonize the human gastrointestinal tract (49). Gut microbiome is different between individuals and both endogenous and environmental factors can influence its composition. It has been hypothesized that loss of diversity in the microbiome composition can be associated with pathologic processes. Intestinal flora is fundamental in body homeostasis, participating in several physiologic processes such as digestion, immune response and metabolic pathways (Figure 5). The relationship between gut microbiome and host can be symbiotic, commensal or pathogenic. Gut microbiome leads to host obesity through various routes such as by altering the intestinal permeability leading to endotoxemia, enhanced calorie provision, and endocannabinoid system (eCB) stimulation and by regulating the lipid metabolism by enhancing lipoprotein lipase activity and lipogenesis (49). Unhealthy lifestyle can alter gut microbiome composition, leading to an overgrowth of pathogenic microbes and favoring the onset of obesity and metabolic syndrome. High-fat diet, for example, has been shown to further increase gut permeability, resulting in increased systemic levels of lipopolysaccharides (LPS), endotoxins that have been shown to be associated with inflammation-related processes such as obesity and insulin resistance (7).
Pathogenesis of obesity is complex and still not fully understood. Prevention and treatment of obesity are challenging, because the interplay of biologic, including genetic obesity risk factors, with the obesogenic environment is not known to an extent that it could be used for a personalized prevention or treatment of obesity (44).
Figure 5: effects of a healthy gut microbiota and dysbiosis on metabolic health of the host. (adapted from Meldrum et al. 2017)
1.5) THE TELOMERE-SHELTERIN COMPLEX PHYSIOLOGY
Telomeres are specialized structures, located at the end of eukaryotic chromosomes, consisting in tandem repeats of TTAGGG sequence, ending in a short G-rich overhang, bound by specialized protein complexes. (50-52). In eukaryotes, chromosomes are linear with the critical consequence that chromosomal ends might be recognized as DNA strand breaks by the cellular DNA repair system, resulting in deleterious chromosomal rearrangement due to erroneous repair, genomic instability and apoptosis (52, 53). This heterochromatic structure protects chromosome ends from degradation and repair activities, and is therefore essential for ensuring the maintenance of chromosomal structure and stability (54-56). The presence of telomeres, indeed, prevents ends of chromosome
from being recognized as double-strand break by DNA repair proteins and avoids end-to-end fusions during cellular division, aberrant recombination and nucleolytic degradation, preserving genome information (51, 57).
Telomeres can form a protective structure, called t-loop, through the invasion of double-stranded telomeric DNA by G-overhang. By generating t-loops, telomeres can fold into a closed configuration that protects the chromosome ends from being identified as DNA double-strand breaks by the DNA damage repair machinery (53).
Telomeres progressively shorten at each cellular division, as a result of the incomplete replication of linear DNA molecules by conventional DNA polymerases, which is known as the ‘end-replication problem’, contributing to cellular senescence and apoptosis (51, 54). Telomere length is thus considered the life-clock of a cell and can serve as a cellular aging marker (52, 58).
Telomerase partially compensates telomere shortening adding TTAGGG repeats at chromosome ends. Telomerase is a ribonucleoprotein complex that consists of the reverse transcriptase catalytic subunit TERT, and the non-coding telomerase RNA component (TERC) which serves as a template for telomere sequence elongation by TERT (52). To extend telomeres, telomerase binds to the 30 end of the DNA and uses its internal RNA as a template for a TERT- catalyzed reverse transcription reaction (53).Telomerase elongation of telomeres, however, is not sufficient to maintain the telomere length that is associated with cell division, and therefore telomere shortening occurs with age in most tissues and this progressive telomere shortening is proposed to be one of the molecular mechanisms underlying ageing (54).
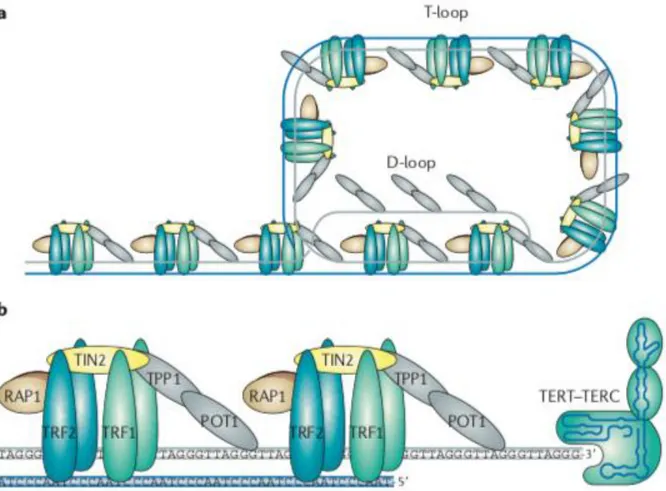
Telomeric DNA can also recruit shelterin to protect chromosome ends (53). The shelterin complex is composed of six core proteins: telomere repeat factor 1 (TRF1, also known as TERF1); telomere repeat factor 2 (TRF2 or TERF2); TRF1-interacting nuclear factor 2 (TIN2); protection of telomeres 1 (POT1); repressor/activator protein 1 (RAP1);
TIN2-POT1-interacting protein (TPP1, also known as adrenocortical dysplasia homolog, ACD) (59) (Figure 6). TRF1 and TRF2 bind directly to telomeric double-stranded DNA, while POT1 binds directly to the 3′ singled-stranded G-overhang. TPP1 can form heterodimers with POT1. TIN2 binds both TRF1 and TRF2 through independent domains and recruits the TPP1–POT1 complex, constituting the key bridging factor that brings together shelterin subunits attached to double-stranded DNA and subunits attached to the single-stranded DNA overhang (54, 60). RAP1 interacts solely with TRF2 and binds TRF2 tightly with an affinity similar to the affinity of TRF2 to DNA binding and also prevents the positively charged basic domain of TRF2 from sequence‐nonspecific DNA binding, thereby increasing the specificity of TRF2 for human telomeric TTAGGG repeats (60). Shelterin complex caps telomere ends - protecting telomeres from the DNA damage response through repression of the ATM and ATR signaling pathway - and regulates telomerase access to telomere termini, regulating telomere length (55, 61). When a critical telomere length is reached, shelterin loose binding sites and telomeric DNA cannot form a protective secondary structure (53).
Together with the shelterin, CST complex - consisting of proteins CTC1, STN1, and TEN1, and localized specifically to the single-stranded overhang of telomeres - is also important for chromosome end capping and regulation of telomere length: downregulation of the CST complex leads to excessive telomerase activity and consequently telomere elongation (52).
Figure 6: a: Schematic model of the shelterin complex bound to a telomere in a T-loop configuration. b: Schematic representation of the shelterin complex and telomerase (adapted from Martinez et al., 2011).
Excessive telomere shortening and severe telomere uncapping trigger a DNA damage response (DDR) at chromosome ends, which are then recognized as double- strand breaks (DSBs) (54). DDR is activated mainly through p53/pRB-depending signaling pathway, whose main function is to arrest cell cycle at G1-S checkpoint in damaged cells. Activated p53 induces expression of p21, a cyclin-dependent kinase inhibitor (CDKI). Cyclin-dependent kinases inactivate pRB preventing E2F1 transcription factor inhibition and allowing the progression from G1 to phase S of cell cycle. Alternative p53-independent pRB activation, is ensured by p16, which is highly expressed in case of genomic damage. These pathways warrant DNA damage repair before genome replication; however, when DNA damage is not fixable, p53 activates apoptosis (50, 55).
Telomerase-deficient mice models, which show premature aging phenotypes in both low-proliferating (heart, brain) and high-low-proliferating compartments, provide the first demonstration that telomere shortening is at the origin of age-related pathologies and is a determinant of longevity (59). In addition to telomere-mediated replicative senescence, telomere length can have an impact on human diseases by regulating gene expression through telomere position effects (TPEs), which involve the spreading of telomeric heterochromatin to silence nearby genes. In human cells, it has been shown that gene expression is affected by telomere length (59).
Telomere length (TL) regulation is an extremely complex trait shaped by numerous factors including genetic, epigenetic, environmental, and further unknown events (52). It is estimated that the heritability of TL in humans varies from 30% to 80%, but inter-individual variation both in absolute TL and in the rate of telomere shortening has been shown (62). Genetic factors alone cannot explain TL and a number of evidences clearly demonstrated that numerous factors can affect TL and enhance telomere attrition. Telomeres are not only affected by oxidative stress and inflammation, which represent the major contributors to ageing and ageing related diseases, but also by lifestyle habits such as smoking, dietary patterns and sedentary behaviour (63) (Figure 7).
The attrition of telomeres is a hallmark of mammalian aging, but may also play a role in the disturbance of nutrient sensing, leading to numerous metabolic dysfunctions. A large body of evidence suggests shorter telomeres are a risk factor for age-related pathologies such as insulin resistance, overt diabetes mellitus, cardiovascular disease or neurological disorders such as Alzheimer’s disease (52).
Figure 7: interplay between physiological and pathophysiological metabolic states and telomere dynamic (adapted from Kirchner et al. 2017).
1.6) TELOMERE LENGTH AND METABOLIC IMPAIRMENT
It is well established in the literature that obese individuals have shorter telomeres than normal-weight individuals. Oxidative stress and chronic inflammation, which may be enhanced with increased BMI and fat mass, have been suggested as the main underlying mechanisms to explain this association (51, 62). The relationship between obesity and telomere morphology is still unresolved and puzzling (52). Weight gain and obesity seem
to promote telomere attrition, regardless of age (63). Several large studies have shown that shorter telomeres are associated with obesity in adulthood and with several anthropometric measures of obesity, such as BMI and waist and hip circumference, although results are not always consistent among different studies (64-69). Telomere length of adipose tissue is reported to have a negative relationship with waist circumference and adipose tissue size, regardless of age (63). The hypothesis of inflammation as a leading cause of enhanced telomere attrition in obesity further support the idea that obesity-related metabolic impairment could lead to additional shortening of telomeres. Indeed, growing body of evidence have associated shorter telomeres with several metabolic disorders, such as type 2 diabetes and dyslipidemia. Telomere dysfunction owing to extreme telomere shortening is proposed to induce metabolic and mitochondrial compromise through repression of Pgc1 and Pgc1 and the subsequent downregulation of several of their target genes (Nrf1, Erra, Tfam, and Ppar), as well as downregulation of members of the oxidative phosphorylation (OXPHOS) pathway (70).
Substantial weight loss promotes improvement of chronic inflammation and adipose tissue oxidative stress and can mitigate the effect of obesity on telomeric attrition, promoting telomere length conservation (62). However, the effects of weight loss on telomere length is still debated and contradictory results have been reported.
The conflicting results can be dependent on the different strategies used to achieve weight reduction. Weight loss obtained through lifestyle intervention seems to be positively associated with telomere length. In dietary and exercise interventions studies, positive effects on telomere length could be associated, in addition to weight loss, to a reduction in the amount of saturated fat and sugar consumed, as well as with an increase in vitamin and mineral (antioxidant) intake (62). However, there are some evidence that telomere length is not fully restored in formerly obese patients compared to never-obese subjects, suggesting
that shorter telomere length is an established and partially irreversible feature of obesity, that could contribute to its comorbidities (71). Some authors suggested that chronic dietary restriction may even be a risk factor for premature telomere shortening (72) and frequent weight cycling has been associated with shorter telomere length (66). The effect of bariatric surgery on telomere length is controversial, despite the extensive and long-term weight loss obtained. Some controversial results may be associated with the catabolic state observed in the immediate post-operative period, which may even accelerate telomeric attrition, while the metabolic improvement reached in the middle and late postoperative periods may reflect benefits in telomere length (51,62).
1.7) TELOMERIC AND EXTRA-TELOMERIC ROLES OF RAP1
Shelterin is proposed to have a fundamental role in protecting chromosome ends; however, the role of shelterin components in telomere biology and disease in mammalian organisms has remained unexplored until very recently (54). It has recently been proposed that RAP1 could have a role in metabolism regulation and obesity development.
RAP1 was first identified as a transcriptional regulator in S. Cerevisiae (scRap1), that exhibits bimodal function, acting as both an activator and a repressor of gene expression; subsequent studies revealed that scRap1 was one of the major double-stranded telomeric repeat-binding proteins, involved in telomere-length regulation, telomere stability, chromosome end protection and silencing of subtelomeric genes (73). ScRap1 is an essential protein required for normal physiological growth and functioning of cells, because it activates the transcription of a large number of heavily transcribed genes, including those encoding glycolytic enzymes, ribosomal proteins, and several components of the transcriptional machinery (73).
RAP1 is the most conserved telomere-interacting protein, from budding yeast to mammals, and beyond its role within nucleus for the maintenance of telomeric functions, is also well known for its extra-telomeric pleiotropic functions in various physiological and pathological conditions (74).
Human Rap1 was discovered as a 399aa protein of almost 47 kDa, codified by TERF2IP gene on chromosome 16q23.1, with significant sequence similarity (~25%) and three conserved sequence motifs in common with scRap1, featuring a domain of a breast cancer susceptibility protein that appears on its C-terminus (BRCT) in N-terminus, one central Myb DNA-binding motif and Rap1-specific protein-interaction domain (RCT) at the C terminus, indicating that it is a human ortholog of scRap1 (74).
However, unlike scRap1, mammalian RAP1 associates with telomeres exclusively through its interaction with TRF2 (54, 74). In contrast to what observed in yeast, where Rap1 is crucial in telomere length regulation and telomere protection, the role of human RAP1 in telomere length regulation is unclear. Loss of Rap1 in various human cell lines did not affect telomere dynamic and Rap1 knockout mice are alive and fertile (74). Mammalian RAP1 is dispensable for telomere protection but is conserved as a mayor telomere-binding protein in mammals; on the other hand, the transcriptional effect of Rap1 in extra-telomeric sites is evolutionary conserved in mammals. Thus some authors suggested a possible role as a ‘sensor’ of telomeric state and a coordinator of different signaling pathways involved in different biological functions such as metabolism and DNA repair (56). A decrease in the number of telomeric repeats in senescent cells, for examples, has been hypothesized to decrease Rap1 levels at telomeres and increase Rap1 occupancy at the extra-telomeric sites, where it modulates gene expression mainly by downregulation of target genes (that is, ribosome genes and glycolysis genes) (75).
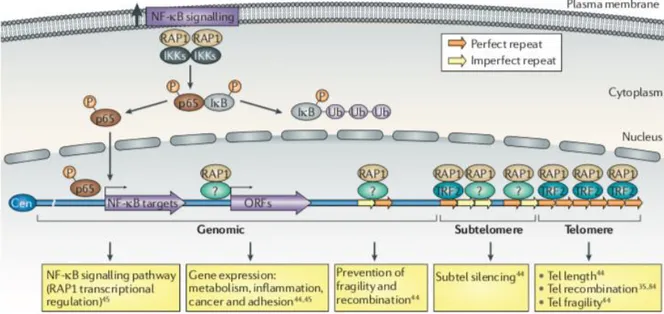
Human RAP1 maintain the ability to bind both telomeric and non-telomeric chromatin, through interaction with TRF2 or other, yet not identified, factors. RAP1 exhibit gene
silencing activities at sub-telomeric region and has a transcriptional regulatory role, involved in several biological processes, at other genomic positions (54) (Figure 8). The extra-telomeric localization of RAP1 does not seem to be confined to the nucleus, as a substantial amount of RAP1 protein is found in the cytoplasm, where it has a role in NF‐kB signaling by interacting with inhibitor of NF-κB kinases (IKKs) and promoting phosphorylation of the NF-κB p65 subunit by IKKs, which in turn leads to NF-κB activation (74, 75). Phosphorylated p65 is translocated to the nucleus where it controls the expression of NF-κB target genes, which includes TerF2IP gene, encoding RAP1 (54).
Figure 8: telomeric and extratelomeric role for RAP1. Tel: telomere; ORF: open reading frame; Cen: centromere (adapted from Martinez et al 2011).
In budding yeast, Rap1 has long been known to have a central role in metabolism by controlling the transcription of genes encoding ribosomal protein subunits and glycolytic enzymes: in response to glucose depletion, yeast Rap1 is required for the expression of genes involved in alternative energy production (75). The link between Rap1 and metabolism seems to be evolutionarily conserved, as demonstrated by two recent studies in mice which demonstrated that RAP1 deletion is associated with early onset of obesity with
increased abdominal fat mass and metabolic impairment, characterized by liver steatosis, high fasting insulin, glucose intolerance and high cholesterol plasma levels (76, 77). The ‘metabolic’ phenotype was more pronounced in females than in male animals (76, 77). The expression of a number of key metabolism genes, including those involved in insulin secretion, caloric restriction pathways, fatty acid metabolism, androgen and estrogen metabolism, steroid biosynthesis, pyruvate metabolism, oxidative phosphorylation and peroxisome proliferator- activated receptor signaling, is altered in Rap1-null mouse tissues (52, 75). Although the mechanism by which RAP1 deficiency leads to obesity and insulin-resistance remains to be fully established, gene expression analysis of liver and white fat tissue in young, unaffected RAP1-deficient mice identified peroxisome proliferator-activated receptor alpha (PPAR) and peroxisome proliferator-proliferator-activated receptor gamma coactivator 1-alpha (Pgc-1) - molecules previously implicated in insulin resistance and diabetes - as the most important factors negatively affected by RAP1 deletion (76). The same authors, subsequently demonstrated that the obese phenotype and liver pathologies observed in Rap1 single knockout mice is abrogated upon telomerase deficiency in combination with RAP1 depletion (Rap1-/- Terc-/- mice), while, telomere shortening is more pronounced than in Terc-/- counterparts, leading to earlier onset of DNA damage (56). These data demonstrate that although RAP1 is not a key factor in telomere capping under normal conditions, under certain cellular stresses such as telomerase deficiency, RAP1 exerts an important function for telomere length regulation and protection. These unanticipated findings provide a likely explanation for the fact that RAP1 is the most evolutionarily conserved shelterin (56).
2) AIM OF THE STUDY
Apart from murine models, no disease associated with RAP1 deficiency has been described until now and the mechanisms underlying RAP1 deficiency are still to be identified. The role of shelterin complex in obesity has not been studied in humans so far. Given the role of RAP1 as a transcriptional regulator of metabolic pathways in mice, the aim of this study is to assess RAP1 expression and its regulation in human adipose tissues from obese patients compared to normal-weight subjects.
3) EXPERIMENTAL DESIGN
The design of the study was divided into two sections. The first part involved the analysis of human adipose tissues, collected from obese patients and non-obese controls, during surgery; adipose tissue was analyzed to assess RAP1 and PPAR mRNA expression and to perform Western Blot analysis for detection of RAP1 and CEBP protein levels. Furthermore, adipose tissue was also used to measure telomere length. The second part of the study involved a cellular model of pre-adipocytes differentiating into mature adipocytes; in this cellular models we analyzed RAP1 and CEBP expression and assessed the binding of CEBP to RAP1 promoter through ChIP analysis (Figure 9).
4) MATERIALS AND METHODS
4.1) PATIENTS
We evaluated 49 obese patients (32 females and 17 males, mean BMI ± SD 45,4 ± 6,42 kg/m2, range 31,63 – 62,39 kg/m2; mean age ± SD 46,94 ± 11,2 years, range 22 - 66), followed in the Section of Endocrinology of University of Siena (Italy), before bariatric surgery. All obese patients underwent full metabolic assessment, in order to assess presence or absence of metabolic syndrome, including: lipid profile, oral glucose tolerance test (in all patients without a previous diagnosis of diabetes mellitus), hormonal profile (pituitary-thyroid axis, pituitary-gonadal axis, pituitary-adrenal axis, GH-IGF1 axis and prolactin), echocardiography, abdominal ultrasound and polysomnography, if needed. Metabolic syndrome was defined according to ATP III criteria revised (16-18); patients with abnormal oral glucose tolerance test (e.g. impaired glucose tolerance and impaired fasting glucose) were included in the metabolic syndrome group. After full metabolic assessment, 37 patients (26 females and 11 males, mean BMI ± SD 45,39 ± 6,43 kg/m2, range 31,63 – 62,39 kg/m2; mean age ± SD 49,84 ± 10,48 years, range 27-66) were classified as affected by metabolic syndrome, while 12 obese patients (6 females and 6 males, mean BMI ± SD 45,44 ± 6,68 kg/m2, range 39,08 – 58,74 kg/m2; mean age ± SD 38,0 ± 8,51 years, range 22-53) were free from metabolic impairment.
Control group consisted of 14 normal-weight controls (7 females and 7 males, mean BMI ± SD 22,27 ± 1,94, range 19,23 – 24,8 kg/m2; mean age ± SD 57,79 ± 16,21 years, range 38 - 83), undergoing surgery for benign disease (e.g. inguinal hernia, appendicitis, cholelithiasis, spinal disc herniation), free from metabolic and autoimmune diseases.
Obese patients and controls were homogeneous for age (p= 0,051), but, as expected, all the features of metabolic syndrome were significantly different between the two groups (Table 1A). Obese patients without metabolic syndrome were younger compared to obese subjects with metabolic syndrome (p = 0,0004). Obese patients with and without metabolic syndrome were homogeneous for body weight, BMI and waist circumference, but differed for metabolic parameters, as expected (Table 1B).
We collected visceral adipose tissue samples (44 obese patients, 10 normal-weight subjects) and subcutaneous adipose tissue samples (5 obese patients, 6 normal-weight subjects), during surgical procedures.
Tissue samples were obtained from patients after informed consent in accordance with local ethical committee guidelines. Adipose tissue obtained during surgical procedures was stored at –80°C and subsequently processed to obtain total RNA and proteins.
CTRL (n = 14) Mean ± SD OB (n = 49) Mean ± SD p value Age (years) 57,79 ± 16,21 46,94 ± 11,20 0,051 (*) BMI (kg/m2) 22,27 ± 1,94 45,4 ± 6,42 <0,0001 (*) Weight (kg) 63,49 ± 10,66 125,7 ± 23,88 <0,0001 (*) Waist (cm) 75,6 ± 7,18 125,3 ± 9,69 <0,0001 (*) BP≥ 130/80 mmHg or treated hypertension 2/14 31/49 0,0018 (§) Glycemia (mg/dl) 90,0 ± 11,65 111,3 ± 38,74 0,0051 (*) Total Cholesterol (mg/dl) 197,4 ± 33,48 207,0 ± 38,38 0,594 (*) HDL (mg/dl) 65,43 ± 12,08 46,81 ± 12,82 <0,0001 (*) Triglycerides (mg/dl) 73,36 ± 23,77 161,5 ± 86,34 <0,0001 (*) LDL (mg/dl) 117,3 ± 29,74 127,7 ± 31,81 0,178 (*)
Table 1. A = Anthropometric measures and metabolic data in obese patients and controls. OB: obese patients; CTRL: control subjects; BMI: body mass index; BP = blood pressure; HDL: high density lipoprotein; LDL: low density lipoprotein. * by Mann-Whitney test; § by Fisher's exact test.
OB w. MS (n = 37) Mean ± SD OB w/o MS (n = 12) Mean ± SD p value Age (years) 49,84 ± 10,48 38,0 ± 8,51 0,0007 (*) BMI (kg/m2) 45,39 ± 6,43 45,44 ± 6,68 0,898 (*) Weight (kg) 124,6 ± 24,38 129,0 ± 22,98 0,537(*) Waist (cm) 125,0 ± 9,47 126,4 ± 11,06 0,953 (*) BP≥ 130/80 mmHg or treated hypertension 29/37 2/12 0,0002 (§) Glycemia (mg/dl) 117,8 ± 42,59 91,25 ± 5,47 0,0022 (*) Total Cholesterol (mg/dl) 209,0 ± 40,6 201,3 ± 31,89 0,77 (*) HDL (mg/dl) 44,4 ± 11,57 53,83 ± 14,18 0,027 (*) Triglycerides (mg/dl) 180,7 ± 90,46 105,6 ± 36,05 0,0033 (*) LDL (mg/dl) 128,2 ± 32,86 126,3 ± 29,88 0,95 (*)
Table 1.B = Anthropometric measures and metabolic data in obese patients with and without metabolic syndrome. OB: obese patients; MS: metabolic syndrome; BMI: body mass index; BP = blood pressure; HDL: high density lipoprotein; LDL: low density lipoprotein. * by Mann-Whitney test; § by Fisher's exact test
4.2) EXPERIMENTAL PROCEDURES
4.2.1) RNA extraction
Total RNA was extracted from adipose tissue using RNeasy® Mini kit (Qiagen, Hilden, Germany). Briefly, 20 mg of adipose tissue were homogenized with T8-Ultra-Turrax (Ika-Werke) in 300 µl of lysis buffer; after centrifugation at 1300 g, 70% ethanol was added to the lysate and then loaded onto the RNeasy spin column and centrifuged at 8000g for 15 sec. RNA was eluted in water and stored at -80°C.
Reverse transcription was carried out using Biorad iScript cDNA Synthesis, following kit instructions. For each sample, 50ng/l of RNA were reverse transcribed in a final volume of 20 l. The relative expression of each gene was determined by calculating Ct values normalized to beta-actin expression levels. 2-Ct method was adopted to evaluate fold change differences among samples.
4.2.2) Western Blot Analysis
For protein detection in Western blot, 200 mg of frozen visceral adipose tissue was homogenized in radio immunoprecipitation assay (RIPA) buffer (0.1% SDS, 0.5% sodium deoxycholate, 1% Nonidet P-40, 150mMNaCl, and 50mMTris-HCl pH 8.0), supplemented with protease inhibitors, as described by Pérez-Pérez et al (78). After centrifugation of the solubilized samples at 13000 rpm for 60 minutes, the soluble fraction was recovered, while the unhomogenized material at the bottom of the centrifuge tube and the fat supernatant were discarded. Protein concentration was determined by Bradford protein assay. Protein extracts (30 or 50 g) were loaded on 10% SDS-PAGE and transferred to nitrocellulose membranes by conventional procedures. Membranes were stained with 0.15% Ponceau Red (Sigma-Aldrich, Saint Louis, MO, USA) to ensure equal loading after transfer and
then blocked with 5% dried nonfat milk in TBS buffer with 0.1% Tween 20. Primary antibodies used were 1:1000 rabbit anti-RAP1 antibodies (cat. A300-306A, Bethyl Laboratories, Montgomery, TX, USA), 1:10000 mouse anti-beta actin antibodies (cat. AC-15 Sigma-Aldrich) and 1:500 rabbit anti CEBP antibody (cat Ab32358-100, Abcam, Cambridge, UK). Following incubation with the primary antibody, blots were washed in TBS with 0.1% Tween 20 and incubated with the appropriate secondary antibody. Immunoreactive bands were visualized with the enhanced-chemiluminescence (ECL Supersignal WestPico reagent kit Pierce, Waltham, MA, USA) and exposed for different times using chemiluminescence instrument detector ImageQuant LAS4000 (GE Healthcare, Little Chalfont, UK). Optical densities of the immunoreactive bands were measured and analyzed using Image J v1.50b analysis software (https://imagej.nih.gov/ij/). The densitometric values were normalized by the housekeeping proteins beta-actin.
4.2.3) Cell culture
Primary culture of human pre-adipocytes visceral cells were obtained from ScienCell Research Laboratories (Carlsbad, CA, USA) and maintained in complete Dulbecco’s modified Eagle’s medium (DMEM-D5671) containing 10% fetal bovine serum (FBS) (Euroclone, Milan, Italy), 2mM L-Glutamine and Antibiotic-Antimicotic solution (all from Sigma-Aldrich) at 37°C. Medium was replaced when cells reached 80% confluence approximately; subsequently complete medium was replaced with Preadipocyte Differentiation Medium (ScienCell Research Laboratories). Mature adipocytes were fixed at day 5 of differentiation and stained with Oil Red O Solution to observe lipid droplets. Briefly, cells were cultured in 24 wells plate with cover slips, coated with poly-L-lysine (Sigma-Aldrich); cells were rinsed with Phosphate Buffered Saline (PBS) solution and fixed in 4% paraformaldehyde (PFA) diluted in PBS solution for 10 minutes at room temperature. Oil Red O (Sigma-Aldrich) working solution was prepared using 3 parts of
Oil Red O stock solution (0.3 g of Oil Red O in 100 ml isopropanol) and 2 parts of distilled water; the working solution was filtered and left for 10 minutes at room temperature. Cultured cells were rinsed with PBS solution and added with 200 l Oil Red O working solution to each well for 1 hour at room temperature. Cells were then rinsed with distilled water and analyzed on a phase-contrast optical microscope.
4.2.4) Immunofluorescence on Cultured Cells
Cultured cells at 0, 2, 4, 8, 12, 24, 48 hours and 5 days of differentiation were rinsed with PBS solution and fixed with 4% PFA diluted in PBS solution for 10 minutes at room temperature. Then, cells were washed with PBS solution and permeabilized with 0,25% Triton X-100 diluted in PBS solution without Calcium and Magnesium, for 5 minutes at room temperature. Cells were then incubated 30 minutes at room temperature with 3% BSA + 0,05% Triton X-100 in PBS solution without Calcium and Magnesium. Cells were incubated with primary anti-CEBP antibody (cat Ab32358-100, Abcam, Cambridge, UK) diluted 1:1000 in 1% BSA - PBS (w/v) for 1 hour at room temperature and 1:500 Goat anti-Rabbit-488 antibody (cat. A11034- Thermofisher, Waltham, MA, USA) in 1% BSA - PBS (w/v) solution for 30 minutes at room temperature (protected from light). Cells were washed with PBS solution and DAPI solution (Thermofisher, Waltham, MA, USA) for 5 minutes at room temperature (protected from light); stain solution was then removed and cells were washed with PBS solution. Coverslips were mounted and slides were observed on fluorescence microscope.
4.2.5) RAP1 promoter sequence analysis
Ensembl Genome Browser database (https://www.ensembl.org/index.html) was interrogated to retrieve -1000 bp sequence upstream RAP1 transcription start site (TSS). RAP1 promoter sequence was then analyzed for putative DNA binding elements for