2020-05-14T14:39:39Z
Acceptance in OA@INAF
The 2015 outburst of the accreting millisecond pulsar IGR J17511-3057 as seen by
INTEGRAL, Swift, and XMM-Newton
Title
PAPITTO, ALESSANDRO; Bozzo, E.; Sanchez-Fernandez, C.; ROMANO, Patrizia;
Torres, D. F.; et al.
Authors
10.1051/0004-6361/201628238
DOI
http://hdl.handle.net/20.500.12386/24828
Handle
ASTRONOMY & ASTROPHYSICS
Journal
596
Number
A&A 596, A71 (2016) DOI:10.1051/0004-6361/201628238 c ESO 2016
Astronomy
&
Astrophysics
The 2015 outburst of the accreting millisecond pulsar
IGR J17511–3057 as seen by INTEGRAL, Swift, and XMM-Newton
A. Papitto
1, 2, E. Bozzo
3, C. Sanchez-Fernandez
4, P. Romano
5, D. F. Torres
2,6,
C. Ferrigno
3, J. J. E. Kajava
4, and E. Kuulkers
41 INAF, Osservatorio Astronomico di Roma, via di Frascati 33, 00044 Monte Porzio Catone (Roma), Italy
e-mail: [email protected]
2 Institut de Ciències de l’Espai (IEEC-CSIC), Campus UAB, Carrer de Can Magrans s/n, 08193 Barcelona, Spain 3 ISDC Data Centre for Astrophysics, Chemin d’Ecogia 16, 1290 Versoix, Switzerland
4 European Space Astronomy Centre (ESA/ESAC), Science Operations Department, 28691 Villanueva de la Cañada, Madrid, Spain 5 INAF, Istituto di Astrofisica Spaziale e Fisica Cosmica – Palermo, via U. La Malfa 153, 90146 Palermo, Italy
6 Institució Catalana de Recerca i Estudis Avançats (ICREA), 08010 Barcelona, Spain
Received 2 February 2016/ Accepted 1 September 2016
ABSTRACT
We report on INTEGRAL, Swift, and XMM-Newton observations of IGR J17511–3057 performed during the outburst that occurred between March 23 and April 25, 2015. The source reached a peak flux of 0.7(2) × 10−9erg cm−2 s−1and decayed to quiescence
in approximately a month. The X-ray spectrum was dominated by a power law with photon index between 1.6 and 1.8, which we interpreted as thermal Comptonization in an electron cloud with temperature >20 keV. A broad (σ ' 1 keV) emission line was detected at an energy (E = 6.9+0.2−0.3keV) compatible with the K-α transition of ionized Fe, suggesting an origin in the inner regions of the accretion disk. The outburst flux and spectral properties shown during this outburst were remarkably similar to those observed during the previous accretion event detected from the source in 2009. Coherent pulsations at the pulsar spin period were detected in the XMM-Newton and INTEGRAL data at a frequency compatible with the value observed in 2009. Assuming that the source spun up during the 2015 outburst at the same rate observed during the previous outburst, we derive a conservative upper limit on the spin-down rate during quiescence of 3.5 × 10⁻¹⁵Hz s−1. Interpreting this value in terms of electromagnetic spin-down yields an upper limit of
3.6 × 1026G cm3 to the pulsar magnetic dipole (assuming a magnetic inclination angle of 30◦
). We also report on the detection of five type-I X-ray bursts (three in the XMM-Newton data, two in the INTEGRAL data), none of which indicated photospheric radius expansion.
Key words. pulsars: general – stars: neutron – X-rays: binaries – X-rays: individuals: IGR J17511-3057
1. Introduction
Accreting millisecond pulsars (AMSPs) are neutron stars (NS) that accrete matter transferred from a low-mass (M2 <∼ M )
companion star (Wijnands & van der Klis 1998); their mag-netospheres are able to truncate the disk in-flow and channel the in-falling matter to the regions of the surface close to the magnetic poles, producing coherent pulsations in the X-ray light curve. The extremely quick rotation of AMSPs is attained dur-ing a previous Gyr-long phase of sustained mass accretion, and these sources are considered the most immediate progenitors of millisecond radio pulsars (Bisnovatyi-Kogan & Komberg 1974;
Alpar et al. 1982;Radhakrishnan & Srinivasan 1982;Archibald et al. 2009;Papitto et al. 2013). So far, accretion driven coherent pulsations have been detected from 17 transient low-mass X-ray binaries (see e.g.Patruno & Watts 2012, for a review). Pulsations from 15 of these objects have been observed during relatively bright (LX ≈ few × 1036 erg s−1) X-ray outbursts lasting from
a few weeks to a few months. In two cases, PSR J1023+0038 and XSS J12270-4859 (Archibald et al. 2015; Papitto et al. 2015), the coherent signal was detected when the source was at a much lower luminosity level (LX≈ few × 1033erg s−1); these
two sources were also detected as radio pulsars during X-ray quiecence (Archibald et al. 2009;Roy et al. 2015), similar to the AMSP IGR J18245–2452 (Papitto et al. 2013).
IGR J17511–3057 was discovered by INTEGRAL during an outburst in September 2009 (Baldovin et al. 2009;Bozzo et al. 2010). The detection of 4.1 ms coherent pulsations in the Rossi X-ray Timing Explorer light curve allowed the identification of the source as an AMSP in a binary system with a 3.47 h or-bital period (Markwardt et al. 2009). The measured pulsar mass function indicated a main-sequence companion star with a mass between 0.15 and 0.44 M (Papitto et al. 2010). At discovery, 18
type-I X-ray bursts were observed from the pulsar (Altamirano et al. 2010;Bozzo et al. 2010;Papitto et al. 2010;Falanga et al. 2011). Evidence of photospheric radius expansion was not seen in any of these bursts, and an upper limit to the source distance (6.9 kpc) was provided byAltamirano et al.(2010).
A new outburst of IGR J17511–3057 was detected by INTEGRAL on March 23, 2015 (Bozzo et al. 2015a,b). Here, we report on a series of INTEGRAL and Swift observations per-formed throughout the event, and on a XMM-Newton Target of Opportunity observation performed three days after the onset of the outburst.
Table 1. Log of the Swift and XMM-Newton observations considered in this paper.
Sequence Obs/mode Start time (UT) End time (UT) Exposure
(yyyy-mm-dd hh:mm:ss) (yyyy-mm-dd hh:mm:ss) (s) Swift 00031492020 XRT/WT 2015-03-23 14:08:39 2015-03-23 16:18:57 860 00031492021 XRT/WT 2015-03-24 16:00:13 2015-03-24 16:15:58 926 00031492022 XRT/PC 2015-03-25 01:48:43 2015-03-25 06:39:55 923 00031492024 XRT/WT 2015-03-28 15:54:29 2015-03-28 16:05:58 682 00031492025 XRT/WT 2015-03-28 19:16:09 2015-03-28 19:20:58 266 00031492026 XRT/WT 2015-03-29 20:30:24 2015-03-29 20:46:58 981 00031492027 XRT/WT 2015-04-02 04:30:10 2015-04-02 06:11:26 97 00031492027 XRT/PC 2015-04-02 04:31:20 2015-04-02 06:20:54 1382 00031492028 XRT/PC 2015-04-04 13:33:42 2015-04-04 13:38:28 266 00031492029 XRT/WT 2015-04-06 13:52:14 2015-04-06 15:11:08 186 00031492029 XRT/PC 2015-04-06 13:52:49 2015-04-06 15:16:55 1241 00031492031 XRT/PC 2015-04-07 13:41:39 2015-04-07 13:57:55 973 00031492032 XRT/PC 2015-04-08 02:35:18 2015-04-08 02:50:56 920 00031492033 XRT/PC 2015-04-08 10:11:57 2015-04-08 11:58:54 1449 00031492034 XRT/PC 2015-04-12 00:58:10 2015-04-12 05:45:56 1316 00031492035 XRT/PC 2015-04-14 09:55:08 2015-04-14 10:19:55 1487 00031492036 XRT/PC 2015-04-16 10:00:40 2015-04-16 10:24:55 1449 00031492037 XRT/PC 2015-04-18 21:23:41 2015-04-18 23:04:55 757 00031492038 XRT/PC 2015-04-22 09:53:57 2015-04-22 10:06:54 777 00031492039 XRT/PC 2015-04-25 04:47:13 2015-04-25 17:56:54 2038 XMM-Newton 0770580301 EPIC-pn 2015-03-26 22:51:47 2015-03-27 19:11:33 73 186 RGS1 2015-03-26 22:16:52 2015-03-27 19:07:38 75 045 RGS2 2015-03-26 22:17:00 2015-03-27 19:08:29 75 089 2. Observations 2.1. Swift
The Swift-XRT (Burrows et al. 2005) observed IGR J17511– 3057 from March 23, 2015, at 14:08:39 (UTC) for a total of 19 ks. A log of all available observations for this outburst is given in Table 1. Swift-XRT data – which were collected in windowed-timing (WT) or in photon-counting (PC) mode, de-pending on the source count rate – were processed and anal-ysed using the standard software (FTOOLS v6.17), calibration (CALDB 20150721), and methods. The WT data were never af-fected by pile-up; on the contrary, the PC data were corrected, when required, by adopting standard procedures (Vaughan et al. 2006). Therefore WT source events were generally extracted from circular regions of 20 pixels (1 pixel ' 2.3600), while
PC source events from annuli with outer radius of 20 pixels and inner radius ranging from 3 to 7 pixels, depending on the sever-ity of pile-up. Background events were extracted from nearby source-free regions. Throughout the campaign, a spectrum was accumulated for each observation and each observing mode, with the exception of the last four observations (036−039) for which a single spectrum was extracted to increase statistics. The data were binned to ensure at least 20 counts per energy bin and were fit in the 0.3−10 keV energy range. The latest responses within CALDB were used. Spectral modelling was performed using
xspec
v.12.8.2.2.2. XMM-Newton
XMM-Newton(Jansen et al. 2001) observed IGR J17511–3057 for 76 ks starting on March 26, 2015, at 22:16:52 (UTC). A log of the observations analysed is given in Table1. The data were reduced using SAS v.14.0.0.
The EPIC-pn camera was operated in timing mode to achieve a time resolution of 29.5 µs, and was equipped with a medium optical blocking filter. We removed soft proton flaring episodes characterized by an EPIC-pn 10−12 keV count rate exceeding 0.8 c/s; this reduced the effective exposure to 55.6 ks. In timing mode, the spatial information along one of the optical axes is lost to allow a faster readout. The maximum number of counts was recorded in pixels characterized by RAWX coordinate 37 and 38. To extract the source emission we considered a 21 pixel wide region (1 pixel ' 4.100), spanning from RAWX = 27 to 47. Background was extracted far from the source, in a 3 pixel wide region centred on RAWX= 4. Spectra were accumulated using single and double event patterns, and re-binned with the tool
specgroup
to have at least 25 counts per channel, and not more than three bins per resolution element. For the spectral ex-traction we followed the recommendations of the latest calibra-tion document on the spectral accuracy of EPIC-pn in fast modes (Smith et al. 20151) and applied the special gain, together withthe rate dependent CTI corrections.
1 http://xmm2.esac.esa.int/docs/documents/ CAL-TN-0083.pdf
A. Papitto et al.: The 2015 outburst of IGR J17511–3057 Three type-I X-ray bursts were detected during the
XMM-Newton observation. To analyse the persistent emission we created good time intervals (GTIs) that eliminated a time in-terval starting 10 s before and ending 150 s after each of these bursts. The burst onset was identified as the first 1 s-long bin of the light curve that exceeded the average persistent count rate of 65.6 c/s by more than 5σ. Apart from the bursts, no evident variability trend was seen over timescales going from a few sec-onds to the length of the observation. At the average persistent count rate observed photon pile up is not expected to affect sig-nificantly the spectral response of the EPIC-pn in timing mode (Smith et al. 2015).
The Reflection Grating Spectrometer (RGS) was operated in standard spectroscopy mode. We extracted spectra from the first order of diffraction where a count rate of 5.0 and 5.9 c/s was observed by the RGS1 and RGS2 camera, respectively. We removed the same time intervals characterized by high flar-ing background and type-I X-ray bursts, as was done for the EPIC-pn.
The EPIC MOS1 and MOS2 camera operated in Large Window and Timing mode, respectively. We did not consider these data in the analysis presented here as '21% and '12% of the photons respectively detected by the two cameras suffered from pile-up distortion of the spectral response, as evaluated with the
epatplot
tool.2.3. INTEGRAL
IGR J17511–3057 was observed within the field of view (FoV) of the instruments on board INTEGRAL from satellite revo-lution 1517 (starting on March 3, 2015) to 1533 (ending on April 25, 2015).
We analysed all the publicly available INTEGRAL data and the data for which we obtained data rights on the source during INTEGRAL AO12 using version 10.1 of the Off-line Scientific Analysis software (OSA) distributed by the INTEGRAL Science Data Center (ISDC;Courvoisier et al. 2003). The INTEGRAL data on the source were accumulated during observations of the Galactic Centre, which are executed following a rectangular pat-tern (5 × 5 pointings, or science windows, SCWs) around the Galactic Centre position with typical durations of 2−3 ks and a 2.17 degree step between successive pointings. Only SCWs in which the source was located within 4.5◦ of the centre of the JEM-X FoV (Lund et al. 2003) were included in the anal-ysis of the data from this instrument. For IBIS/ISGRI, we in-cluded all SCWs where the source was located within 12◦of aim
point of the instrument in order to avoid calibration uncertainties (as suggested in the OSA manual). We first extracted both the IBIS/ISGRI (Ubertini et al. 2003;Lebrun et al. 2003) mosaics in the 20−80 keV and 80−100 keV energy band and noticed that there was no significant detection of the source in the hard band. IGR J17511–3057 was significantly detected in both the JEM-X mosaics extracted in the 3−10 keV and 10−20 keV energy bands. The ISGRI and JEM-X light curves of the source were ex-tracted with a time resolution of 1 SCW in the 20−80 keV and 3−20 keV, respectively, and later rebinned, to improve the statistics, with a time resolution of 2 h (see panels c and d in Fig.1).
We accumulated a single spectrum of the source for each of the two JEM-X units and for IBIS/ISGRI using the data in revolution 1522, between 2015 March 25 at 03:55:44 and March 26 at 23:14:27, leading to an effective on-source expo-sure time of 31.2 ks and 24.3 ks, respectively. This time inter-val was chosen because it is the closest to the XMM-Newton
0.01 0.1 1 -5 0 5 10 15 20 25 30 35 Flux (a) 1 1.5 2 2.5 -5 0 5 10 15 20 25 30 35 Γ (b) 0 1 2 3 4 -5 0 5 10 15 20 25 30 35 JEM-X rate (s -1 ) (c) 0 2 4 6 8 10 12 14 -5 0 5 10 15 20 25 30 35 ISGRI rate (s -1 ) (d)
Time since 2015, March 23 (JD)
Fig. 1. 0.5−10 keV unabsorbed flux (in units of 10−9 erg cm−2s−1;
panel a)) and photon index of the best-fitting power law (panel b)) measured by the Swift-XRT in WT (blue points) and PC mode (red points), and by XMM-Newton (green point). JEM-X (panel c)) and ISGRI (panel d)) light curves were binned with a time resolution of 2 h.
observation, having an overlap of 4.5 ks with it. In particular, for the extraction of this spectrum we selected only the SCWs where the source was detected at more than 5σ and within an off-axis angle of 4.5◦ in order to optimize the signal-to-noise ratio and
have a fully simultaneous JEM-X+ISGRI spectrum. The spectra response matrices were generated using the standard energy bin-ning of 16 channels for JEM-X and 13 channels for IBIS/ISGRI. The fit to these spectra was carried out simultaneously with the XMM-Newtonspectrum and discussed in Sect.2.2.
We also extracted the JEM-X1 and JEM-X2 light curves with a time resolution of 2 s to search for type-I X-ray bursts, and identified two, neither of which in the time window overlapping with the XMM-Newton exposure. The properties of these bursts are discussed in Sect.3.3. On the other hand, we did not identify any bursts in the ISGRI light curve.
3. Results
3.1. Persistent emission
The Swift-XRT 0.3−10 keV spectra were modelled simulta-neously with an absorbed power law, forcing the absorption column to take the same value in every observation. This resulted in an estimate of the absorption column density (described with the model
phabs
inxspec
) of NH = 1.18(4) × 1022cm−2. Thechi squared of the fit was 1632 for 1411 degrees of freedom. If the data are drawn from the model distribution, the probabil-ity of obtaining a chi squared as high, or higher, is 3.5 × 10⁻⁵, which is smaller than the significance level of 2.7 × 10⁻³ we set to determine the goodness of the fit. However, we did not find any evident residuals that motivated the addition of more spectral components, and the chi squared of the individual spec-tra resulted in a null hypothesis probability always larger than the significance level adopted. Using the absorption column as a free parameter in different observations did not yield a statisti-cally significant decrease in the chi squared of the fit. However, we did not find any evident unmodelled residuals that motivated the addition of more spectral components, and the chi squared of the individual spectra resulted in a null hypothesis probabil-ity always larger than the significance level adopted. Systematic errors we did not take into account possibly yielded the rela-tively large residuals of the simultaneous modelling of the Swift-XRT spectra with an absorbed power law. The 0.5−10 keV un-absorbed flux attained a maximum of 0.7(2) × 10−9erg cm−2s−1 on March 24, during observation 00031492021 (see Table 1). The flux decay started around March 29 and was characterized by a roughly linear decay, until the flux decreased abruptly on April 16 (i.e. 25 days after the first detection of the outburst) to a level '100 fainter than the outburst peak (F(0.5−10 keV) = 7.2(8) × 10−12 erg cm−2 s−1 measured by coadding the
obser-vations performed between April 16 and April 25). The pho-ton index of the power law that fitted the Swift-XRT spectra lay in the range between 1.3 and 1.6, becoming much steeper (Γ = 2.1(2)) in the last group of observations performed when the source had already fainted significantly. The values of the unabsorbed 0.5−10 keV flux and power-law index are plotted in the upper panels (a and b) of Fig.1using blue and red points for observations performed in WT and PC modes, respectively.
The spectra observed on March 26, 2015, by the EPIC-pn (1.4−11 keV)2 and the two RGS cameras (0.6−2.0 keV) on
board XMM-Newton were modelled simultaneously by treating the normalization of the two RGS spectra with respect to the EPIC-pn as free parameters (see top panel of Fig.2). We used a thermal Comptonization model (
nthcomp
, Zdziarski et al. 1996;Zycki et al. 1999˙ ) modified by the interstellar absorption. No high-energy cut-off was detected in the XMM-Newton energy band, and we fixed the temperature of the Comptonizing electron cloud to kTe = 30 keV, in line with the results obtainedmod-elling the INTEGRAL spectrum observed immediately before the XMM pointing (see below). The Comptonization component was described by an asymptotic photon indexΓ = 1.62+0.03−0.11and a temperature of soft input photons of kTs< 0.98 keV, yielding
a high value of the chi-squared fit of 1963.3 for 1286 degrees of freedom. To account for the residuals at soft (kT <∼ 1.5 keV) energies we added a single-temperature black-body component (
bbodyrad
inxspec
) with kTbb = 0.59+0.15−0.11 keV and a diskemission component (
diskbb
inxspec
) with temperature of kTin = 0.26+0.04−0.03 keV. The addition of these two componentsyielded a significant decrease in the χ2by∆χ2 = −74.3 (giving
χ2 = 1888.9 for 1284 d.o.f.) and −124.6 (giving χ2 = 1764.29
for 1282 d.o.f.) for the addition of two degrees of freedom each, respectively. We evaluated with an F-test that such improve-ments of the model χ2are equivalent to a probability of <10−11
that they are due to chance. The normalizations of these two
2 EPIC-pn data below 1.4 keV were discarded to avoid the spurious
soft excess that sometimes appears in the EPIC-pn spectra obtained in fast modes, and of which we also found hints in this observation (see e.g.Hiemstra et al. 2011).
10-1 1 10 1 10 counts s -1 keV -1 -6 -3 0 3 6 1 10 ∆χ 2 -6 -3 0 3 6 1 10 ∆χ 2 Energy (keV)
Fig. 2.Top panel: X-ray spectrum of IGR J17511–3057 observed by the EPIC-pn (blue points), RGS1 (red points), and RGS2 (green points) during the XMM-Newton observation. Spectra were rebinned for graph-ical purposes. Bottom and middle panels: residuals with respect to the model listed in the central column of Table2(see text for details), with and without the addition of an emission line centred at E1= 6.9+0.2−0.3keV
to the model, respectively.
thermal components indicate apparent radii of Rin/(cos i)1/2 =
(34 ± 20) d6.9km and Rbb = 3.2+4.6−1.0d6.9 km for the disk and the
black-body component, respectively. Here, d6.9is the distance to
the source in units of 6.9 kpc. Local residuals of the EPIC-pn data at energies of 1.8, 2.2, and 6.9 keV were modelled using three Gaussian emission features. The first two features are nar-row, and their energies are compatible with calibration residu-als of the Si K and Au M edges, known to frequently affect the EPIC-pn spectra in timing mode. The feature at higher energy had a centroid at E= 6.9+0.2−0.3keV, compatible with the Kα transi-tion of ionized Fe. With the inclusion of this feature the model χ2 decreased by∆χ2 = 130.8 for the addition of three free
param-eters (seeProtassov et al. 2002; andStewart 2009, for a discus-sion of the use of the chi-squared fit to measure the significance of spectral lines). The residuals obtained with and without the addition of the Fe emission line to the model are shown in the bottom and middle panel of Fig.2, respectively. The line width (σ = 1.1+0.4−0.2keV) and strength (equivalent width of '150 eV) suggested broadening in the inner parts of an accretion disk. An absorption edge at an energy compatible with the OVIII transi-tion (0.871 keV) was also added to model residuals of the RGS spectra. With the addition of such emission features, the reduced χ2of the fit attained a value of 1441.8 (for 1274 degrees of
free-dom). The probability that a value of the χ2 as high, or higher,
is obtained if the data are drawn from the model distribution is 6.8 × 10⁻⁴. This probability is smaller than significance level we
set (p = 2.7 × 10⁻³), but the absence of evident residuals and the 2% uncertainty quoted by Smith et al. (2015)3 for the
rel-ative effective area calibration of the EPIC-pn motivated us to accept this model without the addition of further components.
3 http://xmm2.esac.esa.int/docs/documents/ CAL-TN-0018.pdf
A. Papitto et al.: The 2015 outburst of IGR J17511–3057 Table 2. Spectral parameters of IGR J17511–3057.
Parameter XMM XMM–IGR NH(1022cm−2) 1.03+0.10−0.07 0.99(5) τOVIII 0.18(7) kTin(keV) 0.26+0.04−0.03 0.17(7) Rin/(cos i)1/2(d6.9km) 34 ± 20 20+5−7 kTbb(keV) 0.59+0.16−0.12 0.62(3) Rbb(d6.9km) 3.2+4.6−1.0 6.6+0.7−0.9 Γ 1.63+0.03−0.11 1.85+0.22−0.15 kTs(keV) <0.98 1.3(2) kTe(keV) (30.0) 33+69−11 Fnth −9 (erg cm −2s−1) 0.49 ± 0.15 1.18(6) E1(keV) 6.89+0.18−0.27 6.93+0.23−0.21 σ1(keV) 1.07+0.40−0.22 0.78+0.4−0.3 N1(10−4cm−2s−1) 5.7+9.6−1.9 2.2+2.2−1.1 E2(keV) 1.86(2) 1.86(2) N2(10−4cm−2s−1) 1.2(4) 1.2(4) E3(keV) 2.24(1) 2.24(7) N3(10−4cm−2s−1) 2.7(6) 2.7(3) RGS1/EPN 0.98(1) 0.98(1) RGS2/EPN 0.98(1) 0.98(1) JEM-X/EPN ... 0.58(9) ISGRI/EPN ... 1.13+0.39−0.25 F−9(erg cm−2s−1) 0.63(4) 1.43(6) χ2(d.o.f.) 1441(1274) 1457(1291)
Notes. Best-fit parameters of the spectrum observed by XMM-Newton (RGS in the 0.6−2.0 keV energy band and EPIC-pn in the 1.4−10 keV range) on March 26, 2016 (central column), and of the simultaneous spectrum observed by XMM-Newton and INTEGRAL (JEM-X in the 5−25 keV, and ISGRI in the 20–150 keV band; rightmost column). Fluxes are unabsorbed, given in units of 10−9 erg cm−2s−1, and
eval-uated in the 0.5−10 keV for the XMM spectrum and the 0.5−100 keV energy band for the XMM-IGR spectrum. Uncertainties are quoted at the 90% confidence level.
Model parameters of the best fit are listed in the central column of Table2.
The broadness of the Fe line motivated us to attempt mod-elling it using a
diskline
component (Fabian et al. 1989). However, the best fit was obtained only for extreme values of the parameters that control the line width (Rin< 8.5 Rg, i > 67◦),and did not yield a significant improvement of the description of the spectrum as the chi-squared of the fit decreased by∆χ2 = 3.7
with the addition of three free parameters.
We then fitted the XMM-Newton EPIC-pn and RGS spectra together with the INTEGRAL JEM-X (5−25 keV) and ISGRI (20−150 keV) spectra which were taken on March 26 (between 03:55:44 and 23:14:27). An AMSP-like IGR J17511–3057 does not usually show drastic spectral variability on timescales of a day or less (Ibragimov et al. 2011), and the analysis of Swift data presented earlier where no significant spectral changes were de-tected over the outburst supports the simultaneous modelling of the XMM-Newton and INTEGRAL data in spite of the limited
10-4 10-3 10-2 10-1 1 1 10 100 E F E (10 -9 erg cm -2 s -1 ) -3 0 3 1 10 100 ∆χ 2 Energy (keV)
Fig. 3.Top panel: X-ray spectrum of IGR J17511–3057 observed by the EPIC-pn (blue points), RGS1 (red points), RGS2 (green points), JEM-X (magenta points), and ISGRI (cyan points) during the 2015 outburst. RGS1 and RGS2 spectra were rebinned for graphical purposes. The best-fit model (black line), the Fe line (green line), the disk (red line), single-temperature black body (magenta line), and the Comptonized (blue line) spectra are also shown. Bottom panel: residuals with respect to the best-fit model.
overlap ('4.5 ks) between these observations. The ISGRI spec-trum allowed us to weakly constrain the electron temperature of the Comptonized component as kTe= 33+69−11keV, while the rest
of the spectral parameters are basically unchanged with respect to those determined by XMM-Newton spectra alone. The spec-trum and residuals from the best fit are plotted in Fig.3, while model parameters are listed in the rightmost column of Table2.
We also considered the addition to the model of a compo-nent describing the reflection of the Comptonizing photon spec-trum off the accretion disk. We removed the Gaussian describing the Fe emission line, and added a
reflionx
(Ross & Fabian 2005) component to the model convolved with relativistic disk blurring (rdblur
,Fabian et al. 1989). The parameters of the disk reflecting surface were held fixed to inner and outer radii of Rin = 10 Rg and Rout = 1000 Rg, respectively, and index ofthe power-law dependence of emissivity β= −2. The best fit was obtained for an ionization parameter ξ= 1500+1000−500 , and a flux of 0.10(5) × 10−10 erg cm−2s−1in the reflection component, equal
to '10% of the irradiating flux and similar to the value observed byPapitto et al.(2011). The addition of reflection did not yield a significant decrease in the model chi-squared (χ2= 1457.1 for 1291 degrees of freedom), though, and we could not conclude that a reflection component was significantly detected in the con-sidered dataset, probably because of low counting statistics.
3.2. Timing analysis
To perform a timing analysis of the coherent signal shown by the source in the XMM-Newton EPIC-pn data, we first con-verted the times of arrival of the X-ray photons to the solar system barycentre using the source position determined by
Nowak et al.(2009) using Chandra observations (see alsoPaizis et al. 2012). Coherent pulsations at 244.8 Hz were easily de-tected at an rms amplitude of '15 per cent in 50 s intervals. A71, page 5 of10
Table 3. Spin and orbital parameters of IGR J17511–3057. hνi (Hz) 244.83395112(3) ˙ν (Hz s−1) <1.2 × 10⁻¹¹ asin i/c (lt-s) 0.275196(4) Porb(s) 12 487.53(2) T∗(MJD) 57 107.8588090(15) e <8 × 10⁻⁵ χ2(d.o.f.) 141.5(121)
Notes. The timing solution refers to the epoch T0 =
57 107.954157 MJD. The error on the spin frequency does not take into account the uncertainty driven by the error on the source position (σposν = 3 × 10⁻⁸Hz).
Starting from the orbital solution provided by Riggio et al.
(2011b), we applied standard timing techniques (see e.g.Papitto et al. 2011) to study the evolution of the pulse phase computed over 500 s intervals. The values of the orbital parameters we obtained, namely the semi-major axis of the NS orbit a sin i/c, the orbital period Porb, the epoch of passage at the ascending
node T∗and eccentricity e, as well as the value of the spin fre-quency ν and spin frefre-quency derivative ˙ν, are given in Table3. The spin frequency derivative could not be constrained over the relatively short exposure of the XMM-Newton observation. As we show in Sect.4, spin-up torques are expected to increase the pulsar frequency at a rate of a few ×10−13 Hz s−1, two orders
of magnitude lower with respect to the upper limit we measured (|˙ν| < 1.2 × 10⁻¹¹Hz s−1, at 3σ confidence level). Because of
the relatively short exposure, the best-fit values of the spin fre-quency correlated to a high degree with the (unconstrained) spin frequency derivative. Similarly to what was done byPapitto et al.
(2010) for the 2009 outburst of IGR J17511–3057, we quote in Table3 the pulsar spin frequency obtained by fixing ˙ν = 0 in the fit (i.e. the average spin frequency over the considered inter-val). A compatible value of the spin frequency is obtained if a value of the spin-up rate of the order of that expected from the observed X-ray luminosity (˙ν= 2 × 10⁻¹³Hz s−1) is considered, justifying our choice.
The error on the position of the source is an additional source of uncertainty on the value of the spin frequency (see e.g.Lyne & Graham-Smith 1990). To evaluate the frequency shift produced by a difference between the actual value of the ecliptic coordi-nates of the source and that used to report X-ray photons to the solar system barycentre, we used (see e.g. Eq. (4) inPapitto et al. 2011)
δνpos= ν y
2π P⊕
[cos Micos β δλ+ sin Misin βδβ], (1)
here, y is the Earth distance from the solar system barycentre in lt-s, λ and β are the ecliptic longitude and latitude, respec-tively, δλ and δβ are the respective uncertainties, Mi= [2π(Ti−
Tγ)/P⊕] − λ, Ti is the start time of observations considered, Tγ
is the nearest epoch of passage at the vernal point, and P⊕is the
Earth orbital period. The error of the position of the source (0.600 at 90% confidence level,Nowak et al. 2009;Paizis et al. 2012, which translates into σλ= 1.5 × 10⁻⁶rad, σβ= 1.8 × 10⁻⁶rad) yielded an uncertainty of σposν = 3 × 10⁻⁸Hz on the value of the
measured spin frequency. Adding in quadrature this uncertainty to the statistical error gave an error of σν= 4 × 10⁻⁸Hz on the average spin frequency measured by XMM-Newton in 2015.
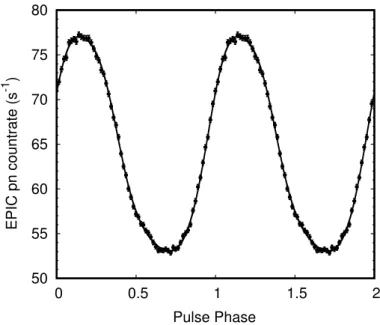
50 55 60 65 70 75 80 0 0.5 1 1.5 2 EPIC pn countrate (s -1 ) Pulse Phase
Fig. 4.0.3–10 keV pulse profile of IGR J17511–3057 as observed by the EPIC pn during the 2015 outburst. The best-fitting model (solid line) is composed of four harmonics with background subtracted rms ampli-tudes of 14.31(6)%, 1.53(6)%, 0.72(6)%, and 0.26(6)%. Two cycles are shown for clarity.
Folding the entire EPIC-pn observation around the best-fitting value of the spin frequency, we obtained the 0.3−10 keV pulse profile shown in Fig.4. It was successfully modelled by four harmonic components, similar to the pulse profile observed in 2009 (Papitto et al. 2010).
We searched for coherent pulsations in the hard X-rays ISGRI band, considering the data observed by ISGRI from 2015 March 22 at 08:56:29 to April 9 at 05:52:01 UTC. We converted the arrival times of the events recorded by ISGRI at the solar system barycentre using the position derived by Chandra, and then to the line of nodes using the ephemeris listed in Table3. We employed a customary software dedicated to phase-resolved spectroscopy of X-ray binaries with IBIS (Segreto & Ferrigno 2007) to extract the background subtracted pulse profile in the broad 20−100 keV energy band. We detected the signal at the pulsar spin frequency determined by XMM-Newton, but the low signal-to-noise ratio of the ISGRI data prevented us from obtain-ing an independent measurement. The pulse profile is shown in Fig.5. Fitting the profile with a constant and a sinusoid, we de-termined that the ratio between the sine amplitude and the con-stant is 14 ± 3%, in agreement with the value found byFalanga et al.(2011) during the 2009 outburst of this source. Splitting the energy range into two bands, we obtained amplitudes of 22 ± 6% and 12 ± 3% for the energy ranges 20−30 keV and 30−100 keV, respectively, suggesting a decrease in the pulsed emission at higher energy.
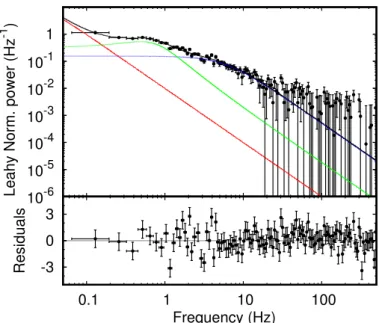
In order to study the aperiodic time variability, we produced a power density spectrum of the 0.5−10 keV EPIC-pn time se-ries with 59 µs time resolution (yielding a Nyquist frequency of 8468 Hz). We averaged the Leahy-normalized fast Fourier transforms performed over approximately 8 s intervals (for a to-tal of 9457 spectra, each extending down to 0.1 Hz). The re-sulting average power density spectrum was rebinned as a geo-metrical series with a ratio of 1.02. The 0.1−500 Hz spectrum was modelled with the sum of two flat-top noise components modelled with Lorentizian functions centred at ν = 0 with widths W1 = (3 ± 1) × 10−2 Hz and W2 = 11.5+/−1.3 Hz,
A. Papitto et al.: The 2015 outburst of IGR J17511–3057 2.5 3 3.5 4 4.5 0 0.5 1 1.5 2 ISGRI countrate (s -1 ) Pulse Phase
Fig. 5. Background subtracted pulse profile of IGR J17511–3057 in the 20−100 keV energy band extracted from 221 ks of dead-time cor-rected on-axis equivalent exposure time in the IBIS/ISGRI data (from 2015-03-22 08:56:29 to 04−09 05:52:01 UTC); the vertical axis dis-plays equivalent count per second for on-axis pointing.
10-6 10-5 10-4 10-3 10-2 10-1 1 0.1 1 10 100
Leahy Norm. power (Hz
-1 ) -3 0 3 0.1 1 10 100 Frequency (Hz) Residuals
Fig. 6.Average Leahy normalized power spectrum of the EPIC-pn time series (top panel). A counting noise constant level of 1.9993(4) is sub-tracted to the power. The two flat-top noise components are plotted with a red and a blue solid line, and the discrete feature centred at ν3= 0.5 ± 0.1 Hz as a green solid line (see text for details). The spike at
the pulsar spin frequency was removed for display purposes. The bot-tom panelshows residuals in units of the standard deviation σ.
and a discrete feature centred at ν3 = 0.5 ± 0.1 Hz with width
W3 = 1.2 ± 0.2 Hz, giving a fit χ2 of 611.2 for 522 degrees
of freedom. We searched for kHz quasi-periodic oscillations (QPOs), fitting a Lorentzian with quality factor fixed to a value of 4, but found no significant QPO with a 3σ upper limit of 1% on the rms amplitude, a value lower than that characterizing the high-frequency QPOs reported byKalamkar et al.(2011). The average power spectrum and residuals with respect to the best-fit model are plotted in Fig.6.
0 500 1000 1500 0 20 40 60 80 (a) EPIC pn countrate (s -1 ) 0 1 2 3 4 0 20 40 60 80 (b) kT (keV) 0 2 4 6 8 0 20 40 60 80 (c) R (km) 0 0.1 0.2 0 20 40 60 80 (d) Arms
Time since burst onset (s)
Fig. 7.0.3−10 keV light curve of the first type-I X-ray burst oserved by XMM-Newton during the 2015 observation (panel a)). The burst on-set took place at MJD 57108.01023. The temperature and the apparent radius (evaluated considering a distance to the source of 6.9 kpc) are plotted in panels b) and c). Panel d) shows the rms amplitude of pulsa-tions at the spin frequency of the pulsar (see Table3).
3.3. Type-I X-ray bursts
During the XMM-Newton observation, three type-I X-ray bursts with very similar properties were detected. The light curve of the first burst is displayed in panel a of Fig.7. The start times of the three bursts were T1 = 57 108.01023(1) MJD, T2 =
57 108.34130(1) MJD, and T3 = 57108.67847(1) MJD. The
burst rise times were ≈1 s, and were followed by exponential decays which started a few seconds after the maxima. The mea-sured decay e-folding times were τ1= 12.1(2) s, τ2= 12.6(2) s,
and τ3= 12.4(2) s for the three bursts. The time elapsed between
consecutive bursts was∆t1 = 28.6 ks and ∆t2= 29.1 ks.
We extracted the EPIC-pn burst spectra removing the two brightest pixel columns to minimize the effect of pile up, and subtracted the spectrum of the persistent emission as the back-ground. Close to the burst peak, spectra were extracted over 2 s intervals; at later times the exposure was increased to ensure that the counting statistics allowed a meaningful spectral modelling. Spectral channels were rebinned in the same way as the persis-tent spectrum. The spectra extracted over the different intervals were simultaneously fit by an absorbed black body with variable temperature and radius, resulting in a χ2fit of 510.9 (for 556
de-grees of freedom), 559.43 (522), and 589.16 (518) for the three bursts. The 0.5−10 keV burst flux attained a maximum value of (1.5 ± 0.1) × 10−8 erg cm−2 s−1. The temperature decreased
steadily from '3 keV during the burst evolution (see panel b of Fig.7), while the apparent radius of the emitting region peaked A71, page 7 of10
at '6 d6.9km ten seconds after the burst onset, and then decayed
smoothly (see panel c of Fig.7).
Coherent oscillations at the pulsar spin frequency were de-tected at a somewhat lower rms amplitude ('10 per cent) than that of persistent pulsations; see panel d of Fig.7). Considering that the burst emission was up to 25 times brighter than the per-sistent flux, such a decrease of the pulse amplitude could not be ascribed to the increase of the unpulsed flux, but suggests instead that the oscillations detected during the burst were different than the coherent signal observed during quiescence. Pulsations were detected close to the burst peak and during the burst decay. The phase of burst oscillations measured over 5 s intervals is gen-erally consistent within the uncertainties with the phase of the persistent profile, even if deviations of up to 0.2 in phase are observed close to the burst peaks.
Two bursts were detected by INTEGRAL, with trigger times of T4 = 57 116.43276(2) MJD and 57 120.11919(2) MJD. From
the JEM-X light curves, we measured a peak count rate of 344.6+/−47.6 c/s (3−20 keV) and 177.5+/−38.8 c/s (3−20 keV), respectively, for the two bursts. Because JEM-X spectra can-not be extracted for time intervals shorter than 8 s, we esti-mated the peak flux by comparing the above count rates with that of the Crab in the same energy band as obtained from the INTEGRAL calibration observations performed in the satellite revolution 1520 (on 2015 March 19). We obtained a 3−20 keV X-ray flux of 1.3+/−0.2 Crab and 0.7+/−0.1 Crab, respectively. These translate into ∼3.0 × 10⁻⁸ erg cm−2 s−1 and ∼1.6 ×
10−8erg cm−2s−1. The e-folding decay times of the two bursts
measured from the JEM-X lightcurves were 7.3 ± 0.1 s and 6.0 ± 0.1 s.
4. Discussion
During the outburst detected in early 2015, IGR J17511–3057 at-tained a peak flux of '0.6−0.7 × 10⁻⁹erg cm−2s−1(0.5−10 keV, unabsorbed, see Sect. 3.1). This value is compatible with the peak flux observed in the last outburst detected in 2009 (Bozzo et al. 2010). Assuming a bolometric correction factor of ∼2 (estimated from the ratio between the flux estimated in the 0.5−100 keV and 0.5−10 keV energy band; see Table 2), the observed peak flux corresponds to a 0.5−100 keV luminosity of '8 × 1036d
6.9 erg s−1. The outburst flux decayed over ≈25 d
before the source was no longer detectable. The spectral shape observed by Swift-XRT was roughly constant, with a softening of the spectrum at the end of the outburst.
Similarly to the 2009 outburst (Papitto et al. 2010;Falanga et al. 2011;Ibragimov et al. 2011), and to other AMPSs (Patruno & Watts 2012), the X-ray spectrum of IGR J17511–3057 ob-served during the 2015 outburst was dominated by a hard com-ponent described by a power law with index Γ ' 1.6−1.8, and a cut-off at a temperature of >∼20 keV. The emission ob-served by XMM-Newton and INTEGRAL during the 2015 out-burst was modelled as thermal Comptonization of soft photons with temperature kTs >∼ 1 keV, off a cloud of hot electrons
(kTe>∼ 20 keV). Two thermal components were detected at soft
X-rays, and interpreted as radiation coming from an accretion disk truncated a few tens of km from the NS surface and from the NS surface itself. Signatures of disk reflection such as a broad-ened (σ ≈ 1 keV) line centred at an energy compatible with ionized iron was also observed in the XMM-Newton spectrum.
X-ray pulsations at the spin period of IGR J17511–3057 were detected by the XMM-Newton EPIC-pn at an RMS ampli-tude of '15 per cent in the 0.5−10 keV band, and by INTEGRAL at an amplitude of 14 per cent in the 20−100 keV band. Up to
four harmonics were needed to model the pulse profile observed in the soft X-ray band, similar to the case of the 2009 outburst (Papitto et al. 2010). We searched for kHz quasi-periodic oscil-lations like those reported byKalamkar et al.(2011), but did not find any hint in the Fourier power spectrum.
The relatively short exposure (∼70 ks) over which pulsations were detected prevented us from studying the frequency evolu-tion driven by the accreevolu-tion of matter. Only a loose upper limit on the spin frequency derivative of ∼10−11Hz s−1 could be ob-tained. On the other hand, the expected spin-up rate driven by accretion torques is ˙ν ' 1 2πI∗ R∗LX √ GM∗ p Rin, (2)
where M∗, R∗, and I∗ are the NS mass, radius, and moment
of inertia, respectively; Rin is the disk truncation radius; and
LX is the accretion luminosity. The accretion luminosity
de-rived from the flux observed in the 0.5−100 keV band is LX =
8.1 × 1036d6.9 erg s−1. Evaluating Eq. (2) for a disk truncated
at the corotation radius (Rc = 42.8 m 1/3
1.4 km for IGR J17511–
3057), and taking M∗ = 1.4 M , R∗ = 10 km, and I =
1045 g cm2 yields ˙ν ' 2 × 10⁻¹³ Hz s−1, two orders of
magni-tude lower than the upper limit we were able to set based on the XMM-Newton observation alone. A spin-up at an average rate of ˙ν09 = (1.45 ± 0.16) × 10−13 Hz s−1 was indeed reported
byRiggio et al.(2011b) for the 2009 outburst, when the source emitted a luminosity similar to that observed during the 2015 outburst.
Assuming that the spin frequency observed by XMM-Newton during a ≈70 ks exposure is a good tracer of the actual spin frequency of the pulsar, we can derive constraints on the evo-lution of the spin frequency of the pulsar during the ∆tq =
1991 d elapsed between the end of 2009 outburst (MJD 55 113; see Fig. 1 of Riggio et al. 2011b), and the beginning of the 2015 outburst (MJD 57 104; Bozzo et al. 2015a). In 2009, XMM-Newton measured an average spin frequency of ν09 =
244.83395121(4) Hz (Papitto et al. 2010), and the frequency de-crease between this value and that measured in 2015 outburst is ∆ν = (ν15−ν09) = (−1.0 ± 0.5) × 10−7 Hz. To evaluate
the effect on this value of the positional uncertainty we maxi-mized the difference between the frequency shift evaluated using Eq. (1) for the 2009 and the 2015 outburst, respectively, obtain-ing σpos∆ν = 0.5 × 10⁻⁷Hz. Adding in quadrature this term to the statistical uncertainty yields an estimate of the frequency change ∆ν = (−1.0 ± 0.7) × 10−7Hz, compatible with zero within less
than 2σ. A spin-down rate of a few × 10−15 Hz s−1 has been
observed from all four of the AMSPs for which pulsations have been detected during consecutive outbursts so far (Hartman et al. 2008, 2009, 2011; Patruno et al. 2012; Patruno 2010; Papitto et al. 2011;Riggio et al. 2011a;Patruno et al. 2009). It is there-fore useful to quote the measured 3σ upper limit on the spin frequency decrease of IGR J17511–3057 (|∆ν| < 3 × 10⁻⁷Hz), and the corresponding limit on the average rate of spin frequency variation (|˙ν| < 1.7 × 10⁻¹⁵Hz s−1).
A more conservative upper limit of the magnitude of the spin frequency derivative of IGR J17511–3057 during quiescence was obtained taking into account that the pulsar spun up during the ≈18 d elapsed since the 2009 XMM-Newton observation and the end of that outburst (Riggio et al. 2011b), and assuming that it did the same during the nearly three days which occurred since the 2015 outburst beginning and the XMM-Newton observation. Considering the spin-up rate derived by Riggio et al. (2011b) (˙ν09= (1.45 ± 0.16) × 10−13Hz s−1), we estimated a frequency
A. Papitto et al.: The 2015 outburst of IGR J17511–3057 increase of ∆νaccr ' (+2.6 ± 0.3) × 10−7 Hz taking place at
the end of the 2009 outburst and at the beginning of the 2015 outburst. Adding this value to the upper limit on the measured frequency change, we obtained an upper limit on the spin-down rate of the pulsar during quiescence of |∆ν| < |∆νaccr −∆ν| <
6 × 10⁻⁷Hz. The corresponding limit on the spin-down rate is |˙ν| < 3.5 × 10⁻¹⁵Hz s−1.
Assuming that the main torque operating on AMSPs dur-ing quiescence was due to electromagnetic spin-down, the upper limit on the spin-down rate can be translated into a constraint on the strength of the magnetic dipole moment. Considering the re-lation derived bySpitkovsky(2006) for the spin-down of a force-free rotating magnetosphere, it is possible to estimate the NS magnetic dipole moment, µ, needed to produce a certain spin-down as
µ =" I∗c3˙ν
(1+ sin2α)(2π)2ν3
#1/2
, (3)
here, α is the magnetic inclination angle. Setting α = 30◦, and considering the conservative upper limit on the spin-down rate estimated earlier (|˙ν| < 3.5 × 10⁻¹⁵ Hz s−1) yielded an upper limit of µ < 3.6 × 1026G cm3.
In principle, the torque acting on a pulsar that is propelling away the inflowing matter through centrifugal inhibition of ac-cretion (the so-called propeller effect, Illarionov & Sunyaev 1975) is an alternative explanation of the spin-down of AMSP during quiescence. Assuming that an accretion disk surrounds the pulsar even during quiescence and is truncated at a radius Rin
exceeding the co-rotation radius Rc, the propeller spin-down
torque is Nsd = ˙Md
√
GMRin[(Rin/Rc)2/3− 1] (see e.g. Eq. (17)
of Papitto & Torres 2015, evaluated for completely anelastic propeller interaction). Assuming Rin = 80 km, a disk mass
ac-cretion rate of ≈1.5 × 10⁻¹¹ M yr−1 is required to explain a
spin-down rate of '3 × 10⁻¹⁵Hz s−1 in terms of the propeller
effect. The propeller luminosity associated with such a value is Lprop ' 2.5 × 1034 erg s−1 (see Eq. (18) of Papitto & Torres 2015). No estimates of the high-energy emission during quies-cence are available for IGR J17511–3057. However, such a value exceeds the X-ray emission observed from other AMSPs in qui-escence by up to two orders of magnitude, and we deem it un-likely. A value of the X-ray luminosity in excess of ≈1033erg s−1
would then be taken as an indication of the presence of strong outflows from the system, as was done byPapitto et al.(2014) andPapitto & Torres(2015) to interpret the emission of two tran-sitional millisecond pulsars in the accretion disk state.
We detected three consecutive type-I X-ray bursts during the XMM-Newton observation performed in 2015. Two more were detected by INTEGRAL, but the much longer time elapsed between them (≈3.5 d) indicates that they were not consec-utive. No evidence of burst radius expansion was detected in the three bursts. The peak flux observed during the bursts pre-sented here (∼1.5 × 10⁻⁸ erg cm−2s−1in the 0.5−10 keV band,
∼3 × 10⁻⁸ erg cm−2 s−1 in the 3−20 keV) is not larger than the value reported by Altamirano et al. (2010) for the burst seen during the 2009 outburst (6.7 × 10⁻⁸ erg cm−2 s−1). As a consequence, the non-observation of photospheric radius expansion during the bursts analysed here could not yield a tighter constraint on the source distance than that reported by
Altamirano et al.(2010, 6.9 kpc). During the 2009 event, eigh-teen bursts were detected, each characterized by an exponen-tial decay timescale of '10 s (Altamirano et al. 2010; Bozzo et al. 2010;Papitto et al. 2010;Falanga et al. 2011). The depen-dence of the burst recurrence time trec on the persistent X-ray
flux was studied byFalanga et al.(2011), who found a depen-dence trec ∝ Fpers−1.1. Using the relation plotted in their Fig. 10, at
a bolometric flux of '1.4 × 10⁻⁹erg cm−2s−1(like the value de-duced from the simultaneous XMM-Newton-INTEGRAL spec-tral modelling, see Table 2), a recurrence time of '9 h is ex-pected. This is only slightly longer than the recurrence time observed by XMM-Newton in 2015 ('8 h).
5. Conclusions
We have presented an analysis of XMM-Newton, INTEGRAL and Swift observations performed during the outburst detected from IGR J17511–3057 during early 2015, the second observed from the pulsar after the discovery outburst in 2009. The out-burst profile, spectral and out-burst properties were remarkably sim-ilar to those observed during the last accretion event detected in 2009, suggesting that the properties of the accretion flow did not change much in the two episodes. The frequency of the coherent signal detected by XMM-Newton three days after the beginning of the outburst was compatible with the value measured by the same observatory during the 2009 outburst. Therefore, a detailed assessment of the spin evolution of the pulsar during the time elapsed between the two outbursts was not possible. However, taking into account the accretion driven spin-up observed dur-ing the 2009 outburst, and assumed for the 2015 outburst, we derived an upper limit of 3.5 × 10⁻¹⁵Hz s−1on the spin-down
rate during quiescence. Electromagnetic spin-down of a NS with a magnetic field weaker than 3.5 × 10⁸G (at the equator of the NS and assuming a magnetic inclination of 30◦) can account for
this inferred spin-down. A magnetic field of the same order has also been inferred for other AMSPs. Observations of future out-bursts will allow us to derive more stringent constraints on the long-term spin evolution of the pulsar, and will also enable us to derive a first estimate of the orbital period.
Acknowledgements. We thank N. Schartel, who accepted the XMM-Newton ToO
observation in the Director Discretionary Time, and the XMM-Newton team who performed and supported this observation. This work is also based on observa-tions with INTEGRAL, an ESA project with instruments and science data centre funded by ESA member states (especially the PI countries: Denmark, France, Germany, Italy, Switzerland, Spain), and with the participation of Russia and the USA. This work was partly done in the framework of the grant SGR2014-1073 and AYA2015-71042-P. A.P., E.B., D.F.T., and C.F. acknowledge the International Space Science Institute (ISSI-Bern) which funded and hosted the international team “The disk-magnetosphere interaction around transitional mil-lisecond pulsars”. A.P. acknowledges support via an EU Marie Skłodowska-Curie fellowship under grant No. 660657-TMSP-H2020-MSCA-IF-2014, and partial support from “NewCompStar”, COST Action MP1304. P.R.
acknowl-edges contract ASI-INAF I/004/11/0. J.J.E.K. acknowledges support from the
ESA research fellowship programme.
References
Alpar, M. A., Cheng, A. F., Ruderman, M. A., & Shaham, J. 1982,Nature, 300,
728
Altamirano, D., Watts, A., Linares, M., et al. 2010,MNRAS, 409, 1136
Archibald, A. M., Stairs, I. H., Ransom, S. M., et al. 2009,Science, 324, 1411
Archibald, A. M., Bogdanov, S., Patruno, A., et al. 2015,ApJ, 807, 62
Baldovin, C., Kuulkers, E., Ferrigno, C., et al. 2009,ATel, 2196, 1
Bisnovatyi-Kogan, G. S., & Komberg, B. V. 1974,Sov. Astron., 18, 217
Bozzo, E., Ferrigno, C., Falanga, M., et al. 2010,A&A, 509, L3
Bozzo, E., Kuulkers, E., Bazzano, A., et al. 2015a,ATel, 7275, 1
Bozzo, E., Papitto, A., Sanna, A., et al. 2015b,ATel, 7852, 1
Burrows, D. N., Hill, J. E., Nousek, J. A., et al. 2005,Space Sci. Rev., 120, 165
Courvoisier, T., Walter, R., Beckmann, V., et al. 2003,A&A, 411, L53
Fabian, A. C., Rees, M. J., Stella, L., & White, N. E. 1989,MNRAS, 238, 729
Falanga, M., Kuiper, L., Poutanen, J., et al. 2011,A&A, 529, A68
Hartman, J. M., Patruno, A., Chakrabarty, D., et al. 2008,ApJ, 675, 1468
Hartman, J. M., Patruno, A., Chakrabarty, D., et al. 2009,ApJ, 702, 1673
Hartman, J. M., Galloway, D. K., & Chakrabarty, D. 2011,ApJ, 726, 26
Hiemstra, B., Méndez, M., Done, C., et al. 2011,MNRAS, 411, 137
Ibragimov, A., Kajava, J. J. E., & Poutanen, J. 2011,MNRAS, 415, 1864
Illarionov, A. F., & Sunyaev, R. A. 1975,A&A, 39, 185
Jansen, F., Lumb, D., Altieri , B., et al. 2001,A&A, 365, L1
Kalamkar, M., Altamirano, D., & van der Klis, M. 2011,ApJ, 729, 9
Lebrun, F., Leray, J. P., Lavocat, P., et al. 2003,A&A, 411, L141
Lund, N., Budtz-Jørgensen, C., Westergaard, N. J., et al. 2003, A&A, 411,
L231
Lyne, A. G., & Graham-Smith, F. 1990, Pulsar astronomy (Cambridge, England and New York: Cambridge University Press), Cambridge Astrophysics Series, 285
Markwardt, C. B., Altamirano, D., Swank, J. H., et al. 2009,ATel, 2197, 1
Nowak, M. A., Paizis, A., Wilms, J., et al. 2009,ATel, 2215, 1
Paizis, A., Nowak, M. A., Rodriguez, J., et al. 2012,ApJ, 755, 52
Papitto, A., & Torres, D. F. 2015,ApJ, 807, 33
Papitto, A., Riggio, A., Di Salvo, T., et al. 2010,MNRAS, 407, 2575
Papitto, A., Riggio, A., Burderi, L., et al. 2011,A&A, 528, A55
Papitto, A., Ferrigno, C., Bozzo, E., et al. 2013,Nature, 501, 517
Papitto, A., Torres, D. F., & Li, J. 2014,MNRAS, 438, 2105
Papitto, A., de Martino, D., Belloni, T. M., et al. 2015,MNRAS, 449, L26
Patruno, A. 2010,ApJ, 722, 909
Patruno, A., Altamirano, D., Hessels, J. W. T., et al. 2009,ApJ, 690, 1856
Patruno, A., Bult, P., Gopakumar, A., et al. 2012,ApJ, 746, L27
Patruno, A., & Watts, A. L. 2012, ArXiv e-prints [arXiv:1206.2727]
Protassov, R., van Dyk, D. A., Connors, A., Kashyap, V. L., & Siemiginowska,
A. 2002,ApJ, 571, 545
Radhakrishnan, V., & Srinivasan, G. 1982,Current Science, 51, 1096
Riggio, A., Burderi, L., Di Salvo, T., et al. 2011a,A&A, 531, A140
Riggio, A., Papitto, A., Burderi, L., et al. 2011b,A&A, 526, A95
Ross, R. R., & Fabian, A. C. 2005,MNRAS, 358, 211
Roy, J., Ray, P. S., Bhattacharyya, B., et al. 2015,ApJ, 800, L12
Segreto, A., & Ferrigno, C. 2007, in The Obscured Universe, Proc. VI INTEGRAL Workshop, July 2–8, 633
Spitkovsky, A. 2006,ApJ, 648, L51
Stewart, I. M. 2009,A&A, 495, 989
Ubertini, P., Lebrun, F., Di Cocco, G., et al. 2003,A&A, 411, L131
Vaughan, S., Goad, M. R., Beardmore, A. P., et al. 2006,ApJ, 638, 920
Wijnands, R., & van der Klis, M. 1998,Nature, 394, 344
Zdziarski, A. A., Johnson, W. N., & Magdziarz, P. 1996,MNRAS, 283, 193
˙