1 INTRODUCTION
Frozen ground is soil or rock with a temperature be-low 0°C. The thermo-hydro-mechanical processes induced by freezing and thawing of pore fluid within soils are complex and can have significant mutual geotechnical interaction (Nishimura et al., 2009). As the temperature decreases the ice content increas-es and the ice becomincreas-es a bonding agent between soil particles or blocks of rock increasing the strength of the soil/rock mass and modifying the pore water pressures and the effective stress on the soil skele-ton, which, in turn, induces mechanical deformation. At the same time, any changes in the hydraulic and mechanical boundary conditions can affect the ther-mal processes by advection and changes of ice and water contents (Gens, 2010).
Natural freezing occurs seasonally in many areas of the globe, and can adversely affect the engineer-ing performance of roads and pavements as ice lens form and grow. In cold regions, perennially frozen ground (or “permafrost”) remains at a temperature below 0°C continuously from year to year. Several distinct features are associated with perennially fro-zen ground such as ice-wedge and thermokarst to-pography. Engineering considerations require an understanding of the freezing process, the effects of thawing frozen ground, seasonal frost heave and set-tlement and how useful aspects of frozen ground can be utilized. These include stability, high strength, and water tightness that can be utilized in frozen
earth structures for construction purposes (Ander-sland & Landany, 2004).
On the other hand, man-made or Artificial Ground Freezing (AGF) is a controllable process and can be used profitably by civil and mining engineers to temporarily provide structural support and/or to exclude groundwater from an excavation until con-struction of the final lining provides permanent safe-ty. The process was originally applied mainly to ver-tical openings, such as shafts or pits, but, with the increasing ability to drill and install freezing tubes horizontally, other excavation works, such as tun-nels, were considered. Besides protecting excava-tions, AGF has also been used to stabilize slopes, to sample coarse grained soil, to construct temporary access roads, and to maintain permafrost below overhead pipeline foundations and below heated buildings (Harris, 1995).
AGF is one of the construction techniques that were extensively adopted during construction of Line 1 of Napoli Underground, to ensure stability and waterproofing of the platform tunnels and in-clined passageways during excavation below the ground water table through loose granular soils of pyroclastic origin (Pozzolana) and a fractured soft rock (Neapolitan Yellow Tuff) (Viggiani & de Sanc-tis, 2009; Cavuoto et al., 2011; Russo et al., 2012). AGF was carried out by driving freeze tubes into the ground parallel to the tunnel length around the future excavation section, and then circulating a
re-Coupled phenomena induced by freezing in a granular material
F. Casini, A. Gens & S. Olivella
ETCG, Universitat Politecnica de Catalunya, Barcelona, Spain
G.M.B. Viggiani
DICII, UNiversità di Roma Tor Vergata, Roma, Italy
ABSTRACT: Artificial Ground Freezing (AGF) is a controllable process that can be used by engineers to sta-bilise temporarily the ground, provide structural support and/or exclude groundwater from an excavation until construction of the final lining provides permanent stability and water tightness. AGF is often carried out based on an observational approach, while a full understanding of the freezing process and of the generation of freezing-induced heave and settlements is still far from being achieved. In this work, the process of ground freezing is studied using a constitutive model that encompasses frozen and unfrozen behaviour within a uni-fied effective-stress-based framework and employs a combination of ice pressure, liquid water pressure and total stress as state variables. The parameters of the constitutive model are calibrated against experimental da-ta obda-tained from samples retrieved during construction of Napoli underground, in which AGF was extensively used to excavate in granular soils and weak fractured rock below the ground water table.
frigerating fluid into the tubes until the temperature of the ground around the tubes was below the freez-ing point of the groundwater. Freezfreez-ing was activat-ed with nitrogen and maintainactivat-ed with brine. The contractor specified that excavation should be under-taken within 1 m thick frozen collars with external surfaces at a temperature of -10 °C. The growth of the frozen body was monitored with temperature sensors located along chains parallel to the freeze pipes. Due to the complexity of the works, the con-struction of the line was accompanied by an intense programme of monitoring designed to measure and/or control the effects of construction on adjacent structures, and, for the extension and completeness of the monitoring, represented a unique opportunity to collect field data on the performance of AGF.
Several Authors have attempted to back analyse and interpret different aspects of the freezing pro-cess. Viggiani & de Sanctis (2009) analysed transi-ent heat propagation numerically using the finite el-ement code ABAQUS. The thermal properties of the soil were obtained by back analysis of an instru-mented trial field in which the ground temperature around the freezing holes was measured during cy-cles of freezing and thawing. An attempt to predict ground heave on freezing and subsequent settle-ments on thawing with a decoupled approach, was also carried out by finite element analyses imposing freezing-induced volume strains to the ground (De Santis, 2006).
Colombo (2010) also tackled the problem of heat propagation, comparing the results of a theoretical analyses due to Sanger & Sayles (1979) and those obtained by finite element analyses. In this case the thermal properties of the ground were assigned based on literature data. Both the analytical and FEM approach were adopted to analyse realistic lay-out of freezing tubes similar to those used during construction of Napoli Underground and the results compared with experimental data.
Papakonstantinou et al (2012) examined the tem-perature histories monitored within the ground dur-ing the freezdur-ing process numerically, in this case tak-ing into account the thermo-hydraulic coupltak-ing. The influence of a number of parameters, including the spacing between the freeze pipes and the thermal conductivity of the ground was investigated to gain an understanding of the thermal behaviour of the ground during activation of artificial freezing with nitrogen.
The goal of this work is that of studying the freez-ing process considerfreez-ing the full thermo-hydraulic-mechanic coupling; to this purpose a research project bringing together constitutive modelling, laboratory tests and field data has been started as an interna-tional co-operation involving UPC Barcelona, Uni-versità di Roma Tor Vergata and technical person-nel, and engineers involved in the design and construction of Napoli underground. The final goal
of the work is that to be able to model the construc-tion process, thus gaining confidence in the design of other works from the engineering point of view.
This paper presents the first results obtained using a fully thermo-hydro-mechanical (THM) model (Nishimura et al. 2009), calibrated against experi-mental data obtained under temperature controlled conditions on Pozzolanas retrieved from the subsoil in Municipio Station. The testing programme was carried out by Tecno-in SpA (www.tecnoin.it/en) as part of the geotechnical investigation for the works of Napoli underground.
2 CONSTITUTIVE MODEL ADOPTED
The THM model developed by Olivella et al (1994, 1996) and Gens et al (1998) for high temperature problems involving gas phase has been extended to low temperature problems by Nishimura et al (2009). In this case, the gas phase is replaced by a second solid phase representing ice. The formulation was implemented in CODE_BRIGHT (Olivella et al. 1996).
2.1 Freezing retention model
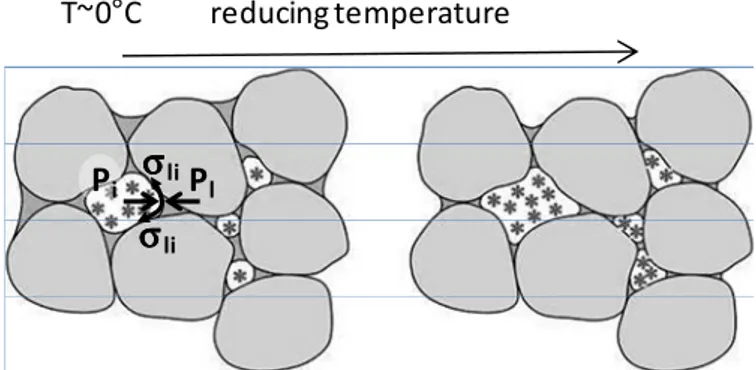
The freezing storage mechanism, which links the saturation degree of the liquid phase Sl (unfrozen water) to the thermodynamic properties of the soil, must be defined. As the temperature decreases, a liquid-ice surface tension, σli, develops at the inter-face of the two phases, which must be balanced by the difference of the pressures in frozen and liquid water, Pi and Pl as schematically shown in Figure 1.
T~0°C reducing temperature σ σσ σli Pi Pl σ σσ σli
Figure 1. Suction development at ice water interface.
The equilibrium between the liquid water and ice phases is described by the Clausius-Clapeyron equa-tion, derived from the equilibrium of the chemical potential between two phases. The integrated form of the equation using the atmospheric pressure and a temperature T = 273.15 °K as references is given by:
) 15 . 273 ln( i ρ l l ρ i ρ i T l P P = − (1)
where l is the specific latent heat of fusion, and ρi and ρl are the mass densities of the frozen and liq-uid water respectively.
The van Genuchten (1980) equation is used to represent the freezing retention model:
m m P P P S − − − + = 1 1 l i 1 l (2)
where m is a material constant and P is the ice entry value. This is related to the air entry value in un-saturated condition as P = Paσli/σla where σla andσli are the liquid-air and liquid-ice surface tensions, and
Pa the air entry value.
The suction, defined as s = Pi-Pl, depends on temperature, T, and liquid pressure, Pl:
) 15 . 273 ln( i l 1 l i l i T l P P P s ρ ρ ρ − − = − = (3)
Substituting equation (3) into equation (2) it is pos-sible to obtain the relation between Sl and T.
Finally, the relative permeability is obtained from the van Genuchten equation together with the fol-lowing relation linking the relative permeability to the saturation degree of the liquid phase:
(
)
− − = m m r S S k l 1 1 l1/ (4) 2.2 Mechanical modelThe stress variables adopted in the formulation are the net stress, σij,n:
) , max( l i ij n ij, =σ − P P σ (5)
and the suction s, see equation (3).
The Barcelona Basic Model (BBM, Alonso et al, 1990) has been extended to describe the essential features of frozen-unfrozen soils where σij,n
repre-sent the net stress and s the suction, to obtain the Barcelona Freezing Model (BFM)
The yield function is given by:
(
n 0) (
n0 n)
2 p p p ks p M q= ⋅ + + s ⋅ − (6)in which q is the deviatoric stress, pn is the mean net stress, pn0 is the net pre-consolidation pressure, and
ps0, k, and M are material constants.
The loading-collapse curve (LC), describing the evolution of pre-consolidation pressure with suction, is given by: κ λ κ λ − − ∗ = ) 0 ( 0 n0 c n c p p p p (7) where:
( ) (
⋅[
−r)
(
− s)
+r]
=λ
β
λ
0 1 exp (6)and λ(0), κ, pc, β, and r are all material constants. For further details the reader is referred to Alonso et
al. (1990), Nishimura et al. (2009) and Gens (2010).
3 LABORATORY TESTS
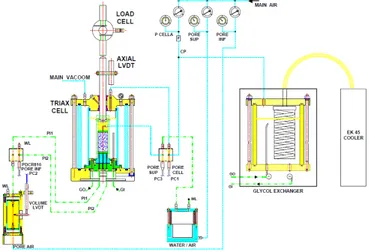
The tests were performed using a double walled tri-axial cell originally developed by Tecno-in SpA which works under temperature controlled condi-tions, see Figure 2.
The cell fluid (glycol), acts also as the refrigerat-ing medium and is circulated in an inner cylinder containing the sample, while the outer cylinder is kept under vacuum to limit condensation. The load-ing ram moves vertically in a sleeve seal, which is connected to an LVDT for the measurement of verti-cal displacements. The axial load is measured using an external load cell fixed under the cross bar of the loading frame. Tests are generally performed at con-trolled displacement rate. There are three independ-ent pressure circuits, one controlling the cell pres-sure and two controlling the pore water prespres-sure in the sample. A probe placed in the middle of the samples monitors its temperature. Further details on the experimental set-up are given by de Sanctis (2007).
Figure 2. Experimental set-up (after Cantone et al., 2006). The laboratory tests were performed to characterise the mechanical behaviour of the natural soils at low temperatures. Undisturbed samples were retrieved from the site of Muncipio station at different depths, for a total of 10 samples in the granular deposits (Pozzolanas) and 9 samples from the underlying soft rock (Neapolitan Yellow Tuff). The tests included unconfined and triaxial compression tests and
indi-rect extension tests on unfrozen, frozen and fro-zen/unfrozen samples.
3.1 Experimental results
Figure 3 shows the stress paths followed by three samples of Pozzolana in the p:T and p:q planes.
Figure 3. Stress path followed in test in the p-T and p-q planes. The main phases of the tests are:
- drained isotropic compression to mean total stress
p = 200 ÷ 350 kPa;
- freezing to temperatures T = -5 ÷ -10 °C over a time of about five hours followed by an equaliza-tion stage at constant temperature;
- axial loading at controlled displacement rate of 10-6 mm/s for tests TX1 and TX2 and 10-7 mm/s for test TX3;
- thawing after axial loading under maintained dis-placement.
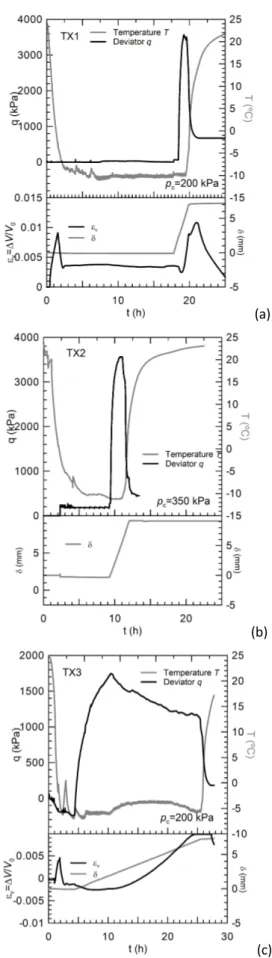
Figure 4 reports the results of the three tests in terms of deviatoric stress, q, volumetric strain, εv,
temperature, T, and axial displacement, δ, versus time, t.
The volume strain recorded during all tests indi-cates a tendency for the sample to increase its vol-ume during the initial part of the freezing stage. This is followed by an apparent decrease of the vol-ume strain before reaching an approximately con-stant value during equalisation. It must be noted, however, that the water in the drainage circuit freez-es and so the external measurements of volume strain are not reliable below 0 °C. Different methods to measure the volume strain of the sample are being developed to overcome this problem.
The peak deviatoric stress, qp, obtained from the
shearing stage of the two tests at T = -10 °C are al-most the same (qp = 3565 kPa in test TX1, at a cell
pressure pc = 200 kPa, and qp = 3562 kPa for test
TX2, at pc = 350 kPa) indicating that, in this range of
stress, the effect of confining pressure is negligible compared to the bonding effect of the ice.
The shearing stage of test TX3 was carried out at a temperature ranging between -6 and -4°C, see Fig-ure 4(c). In this case, the peak deviatoric stress, ob-tained for δ = 2 mm and at a temperature T = -6 °C, was qp = 1740 kPa, after which the temperature
in-creased up to -4°C and the deviatoric stress de-creased to 1200 kPa.
(a)
(b)
(c)
Figure 4. Experimental results: (a) TX1, (b) TX2, and (c) TX3
During the shearing stage the external system for volume strain measurements records a small contrac-tion of the sample followed by dilacontrac-tion as the peak deviatoric stress is attained. For the reasons outlined above, however, the reliability of these measure-ments of volume strain is questionable.
4 MODELLING
Table 1 reports the values of the parameters adopted to define the freezing retention model, together with the residual degree of saturation of liquid water, Slres
and the initial porosity of the soil, n. Table 2 summa-rises the values of the parameters of the Barcelona Freezing Model adopted in the numerical simula-tions.
The parameters defining the freezing retention model and the loading collapse curve were calibrated using literature data obtained by Nicotera (2000) and Picarelli et al (2007) on Pozzolanas similar to those under examination although retrieved from different sites. Parameters M and G were obtained by back-analysis of the behaviour of unfrozen samples re-ported in de Sanctis (2007), while the remaining pa-rameters were calibrated against the experimental re-sults reported herein.
Table 1. Parameters of Freezing Retention Model (FRM)
P(kPa) m Slres Kintr (m2) n 5.2 0.366 0.10 10-13 0.5 Table 2. Parameters of Barcelona Freezing Model (BFM) κ κs λ(0) r β pc k M G
MPa MPa
0.02 0.002 0.13 1.3 58 10 1.2 1.3 40 Axis-symmetric coupled THM analyses were per-formed to validate the BFM under different tempera-tures and mean confinement stress, using the mesh shown in Figure 5. A step of 24 hour of linearly de-creasing temperature to T = -5 or -10º C was applied to the top and right boundary of the mesh, both al-lowed to move during freezing. The initial pore wa-ter pressure in the sample at the beginning of freez-ing was set to zero, and the top and lateral boundaries of the mesh were drained. Axial loading was carried out imposing a constant rate of vertical displacement, vp, to the top boundary of the mesh.
Figure 5. Geometry of the finite element mesh used in the analysis and boundary conditions applied.
Figure 6 shows the contours of temperature, T (°C), liquid water pressure, Pl (MPa), porosity, n, and
equivalent degree of saturation Seq (=Sl+(ρiw/ρlw)Si)
at a specific time (t = 14h) for the simulation of the freezing stage of test TX3.
0.1 -0.3 -0.1 -0.5 -0.7 -0.02 -0.22 -0.42 -0.62 0.51 0.52 0.53 Pl(MPa) T (°C) n Seq 0.99 0.97 0.95 0.93 (a) (b) (c) (d)
Figure 6. Test TX3 - Results of numerical simulations: freezing stage.
The model reproduces correctly the advancement of the freezing front from the boundary of the sample towards its centre, with a gradient ∆T/∆r ≈ -1.2/0.019 (º/m), see Figure 6(a). Due to the decreas-ing temperature, the liquid water pressure becomes negative where the freezing front advances, see Fig-ure 6(b). Also, in the frozen area, there is a marked increase of porosity induced by phase transformation (from water to ice) coupled with the changes of liq-uid water pressure, see Figure 6(c), and a corre-sponding decrease of liquid water saturation, see Figure 6(d).
Figure 7. Measured and predicted stress strain behaviour in triaxial compression.
Figure 7 shows the deviatoric stress versus axial strain curves obtained from the numerical simulation of the shearing stage of all three tests, together with the experimental results. Consistently with the ex-perimental conditions, the imposed displacement
rate in the simulation of test TX3 was one order of magnitude less than that adopted in the simulation of tests TX1 and TX2. Also, the values of the initial unfrozen over consolidation mean effective stress in the numerical simulation of the tests on different samples were not the same (p′c=400 kPa for samples
TX1 and TX3, and p′c=330 kPa for sample TX2).
This is due to the different depth of retrieval of the different samples.
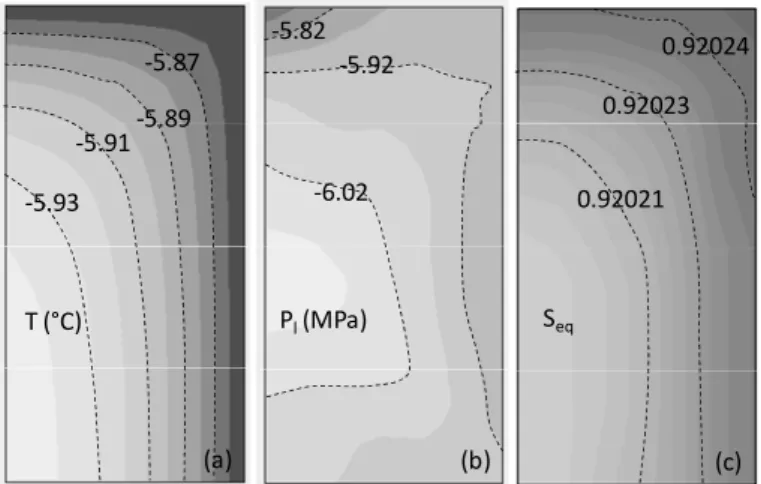
The agreement between model predictions and experimental data is very satisfactory both for the samples tested at the same temperature with two dif-ferent confining stress (TX1 and TX2) and for those tested at the same confining stress at two different temperatures (TX2 and TX3). -5.87 -5.91 -5.93 T (°C) -5.89 (a) -5.82 Pl(MPa) -5.92 -6.02 (b) Seq 0.92024 0.92023 0.92021 (c)
Figure 8. Test TX3 - Results of numerical simulations: thawing stage.
The final thawing stage under maintained displace-ments was also simulated numerically for all tests. Figure 8 shows the computed contours of tempera-ture, T (°C), liquid water pressure, Pl (MPa), and
equivalent degree of saturation, Seq, at a specific time
in the simulation of the thawing stage for test TX3. The model correctly reproduces the advancement of the thawing front from the boundary of the sample to its centre with a gradient ∆T/∆r ≈ 0.01/0.19 (º/m). Due to the increasing temperature, the liquid pres-sure increases as the thawing front advances. The liquid water pressure is higher in the upper part of the sample due to the axial load transmitted by the top platen.
In this step of increasing temperature (εa>0.03)
the model reproduces quite well the observed behav-iour during axial loading.
5 CONCLUSIONS AND PERSPECTIVE
This is paper has illustrated the first results of a re-search into the fundamentals of frozen soil behav-iour, bringing together constitutive modelling, labor-atory tests and field data. A fully coupled thermo-hydraulic-mechanical model extended to low tem-perature problems has been validated in freezing and
thawing against experimental data obtained in triaxi-al compression at different temperatures and con-finement pressures. The performance of the model is satisfactory during all stages of the test, including drained compression, freezing, equalisation, axial loading in frozen conditions, and thawing.
Further work, currently under way, includes mod-ifications to the temperature controlled triaxial equipment to measure volume strains of frozen soil and change the freezing mechanism such that the freezing front will proceed from the centre of the sample towards its boundaries, with an effect on the hydraulic boundary conditions. From the point of view of constitutive modelling modifications to the present formulation are being examined to include the viscous behaviour of the ice phase, mechanical degradation on cycles of freezing and thawing, and the adoption of the Bishop stress as a constitutive variable.
6 ACKNOWLEDGMENTS
The financial support of the European Commis-sion for the first author through the “ Marie Curie In-tra European Fellowship” (EU FP7-NuMAGF, grant agreement 272073) is acknowledged. The authors are grateful to Studio Cavuoto, Tecno-in SpA and professor Alessandro Mandolini for their technical support as well as their permission to publish re-search results.
REFERENCES
Alonso, E. E., Gens, A. & Josa, A. (1990). A constitutive mod-el for partially saturated soils. Géotechnique 40(3): 405– 430.
Andersland, O.B. & Ladanyi, B. (2004). Frozen ground
engi-neering. Wiley and Sons Inc., New Jersey.
Cantone, A., De Sanctis, L. & Mandolini, A. (2006). Interventi di protezione degli scavi di gallerie mediante congelamento. Attività sperimentali nella Stazione Muncipio della Metro-politana di Napoli. Incontro Annuale dei Ricercatori di
Ge-otecnica, Pisa, Italy.
Cavuoto, F., Corbo, A., Fico, R., De Risi, A. & Giannelli, F. (2011). La metropolitana di Napoli: la galleria di scavalco della stazione Toledo. Confronto tra misure dei cedimenti e analisi numeriche. In: XXIV Convegno Nazionale di
Ge-otecnica, Napoli:1-9.
Colombo, G. (2010). Il congelamento artificiale del terreno negli scavi della metropolitana di Napoli. Rivista Italiana di
Geotecnica, XLIV(4), 42-62.
de Sanctis, L. (2007). Protezione degli scavi di gallerie medi-ante congelamento. Rapporto tecnico CONSORZIO
IKOTEKNE: 1-119.
De Santis, D. (2006). Osservazione sperimentale e analisi nu-merica degli interventi di protezione dello scavo con AGF. Master Thesis, Università di Roma Tor Vergata (in Italian) Gens, A. (2010). Soil-enviroment interactions in geotechnical
engineering. Géotechnique 60(1): 3-74.
Gens, A., Garcia-Molina, A. J., Olivella, S., Alonso, E. E. & Huertas, F. (1998). Analysis of a full scale in situ test
simu-lating repository conditions. Int. J. Numer. Anal. Methods
Geomech. 22(7): 515–548.
Harris, J.S. (1995). Ground freezing in practice. Thomas Teld-ford Ltd, London
Nicotera, M.V. (1998). Effetti del grado di saturazione sul comportamento di una pozzolana del napoletano. PhD
The-sis, Università di Napoli Federico II (in Italian).
Nishimura, S., Gens, A., Olivella, S. & Jardine, R.J. (2009). THM-coupled finite element analysis of frozen soil: formu-lation and application. Géotechnique 59(3): 159-171. Olivella, S., Carrera, J., Gens, A. & Alonso, E. E. (1994).
Non-isothermal multiphase flow of brine and gas through saline media. Transp. Porous Media 15(3): 271–293.
Olivella, S., Gens, A., Carrera, J. & Alonso, E. E. (1996). Nu-merical formulation for a simulator ‘CODE_BRIGHT’ for thecoupled analysis of saline media. Engng Comput. 13(7): 87–112.
Papakonstantinou, S., Anagnostou, G. & Pimentel, E. (2012). Evaluation of ground freezing data from the Naples subway.
Proceedings of the ICE: Geotechnical Engineering. DOI: 10.1680/geng.10.00099
Picarelli, L., Evangelista, A., Rolandi, G., Paone, A., Nicotera, M.V., Olivares, L., Scotto Di Santolo, A., Lampitiello, S. & Rolandi, M. (2007). Mechanical properties of pyroclastic soils in Campania Region. 1st International Workshop on
Characterisation and Engineering Properties of Natural Soils;Singapore 3-4: 2331-2383.
Russo, G., Viggiani, C. &Viggiani, G.M.B. (2012). Geotech-nical design and construction issues for lines 1 and 6 of the Naples underground. Geomechanik und Tunnelbau 5(3): 300-311.
Sanger, F.J. & Sayles, F.H. (1979). Thermal and rheological computations for artificially frozen ground construction. Engineering Geology, 13: 311-337
van Genuchten, M. Th. (1980). A closed-form equation for predicting the hydraulic conductivity of unsaturated soils.
Soil Sci. Soc. Am. J. 44: 892–898.
Viggiani, G.M.B. & de Sanctis, L. 2009. Geotechnical aspects of underground railway construction in the urban environ-ment: The examples of Rome and Naples. Geological
Soci-ety Engineering Geology Special Publication 22(1): 215-240.
www.tecnoin.it/en/