Characterization of Embryonic Stem (ES)
Neuronal Differentiation Combining
Atomic Force, Confocal and DIC
Microscopy Imaging
Maria Elisabetta Ruaro, Jelena Ban and Vincent Torre
International School for Advanced Studies
(SISSA-ISAS), via Bonomea 265, Trieste
Italy
1. Introduction
The nervous system development is of tremendous fundamental importance, but it is immensely challenging because of the complexity of both its architecture and function (Staii et al., 2011). Understanding the formation of this ordered complexity is one of the greatest challenges of modern science. Mechanisms by which progenitor cells differentiate and acquire their cell identity are just beginning to be fully understood (Gilbert, 2000; Lai & Johnson, 2008).
A potent tool for studying differentiation and development in vitro has been offered to researchers by the isolation of mouse embryonic stem (ES) cells derived from the inner cell mass of blastocyst-stage embryos more than 20 years ago (Evans & Kaufman, 1981; Martin, 1981). Two unique characteristics distinguish them from all other organ-specific stem cells identified to date. First, they can be maintained and expanded as pure populations of undifferentiated cells for extended periods of time retaining normal karyotypes. Second, they are pluripotent, capable to generate every cell type in the body. The pluripotent nature of mouse ES cells was formally demonstrated by their ability to contribute to all tissues of adult mice, including the germline, following their injection into host blastocysts (Bradley et al., 1984). In addition to their developmental potential in vivo, ES cells display a remarkable capacity to form all differentiated cell types in culture (Keller, 2005).
In vitro differentiation of embryonic stem (ES) cells recapitulates early events in the development of the mammalian nervous system: ES cells can both generate and respond in
vitro to signals that normally regulate embryonic development (Fraichard et al., 1995; Keller, 2005). This knowledge has been transported in vitro designing several different protocols that have evolved to promote neuroectoderm differentiation (Cai & Grabel, 2007; Keller, 2005). Each of the three major neural cell types of the central nervous system—neurons, astrocytes, and oligodendrocytes—can be generated, and relatively pure populations of each can be isolated when cultured under appropriate conditions (Okabe et al., 1996; Barberi et al., 2003). In addition to the generation of these different neural populations, conditions have been established for the development of different subtypes of neurons. Thus neurons
of different parts of the neural tube were successfully generated including spinal motoneurons, midbrain dopaminergic neurons, spinal cord interneurons, Purkinje and granule cells of cerebellum, hypothalamus and finally cortical pyramidal cells (Gaspard & Vanderhaeghen, 2010).
These neurons do not only have the correct morphology and express specific markers but they are also functional: electrophysiological data from ES-derived neurons with different protocols validate their functional differentiation in vitro and there are evidence of the formation of synapse between ES-derived neurons or between an ES-derived neuron and a mature neuron in organotypic slices as well as integration of ES-derived neurons in vivo. Moreover, networks formed by ES-derived neurons display functional properties remarkably similar to those of hippocampal neurons (Ban et al., 2007 and references herein). The isolation of human ES cells in 1998 (Thomson et al., 1998) dramatically elevated the interest in the therapeutic promises of ES cells differentiation, in particular for brain repair. Therefore ES have emerged as a powerful tool in neurobiology, helping address longstanding questions in an entirely novel way (Gaspard & Vanderhaeghen, 2011).
If the cell is to become a neuron, the next decision is what type of neuron it will be. After fate is determined, still another decision gives the neuron a specific target (Gilbert, 2000). Neurons find their targets by protruding axons driven by the motile apparatus of growth cones. The surface of growth cones contains receptors for extracellular guidance cues that integrate this information into directional movement towards the target cell (Grzywa et al., 2006). Filamentous (F)-actin is the primary cytoskeletal element that maintains the growth cone shape and is essential for proper axon guidance, whereas microtubules are essential for giving the axon structure and serve an important function in axon elongation (Dent & Gertler, 2003). Thus growth cones act as sensors, signal transducers and motility devices and understanding their fate is a key question.
While the role of guidance molecules (Dickson, 2002) for growth cone movements, underlying signalling of both the F-actin and microtubules is well established (Dent & Gertler, 2003; Schaefer et al., 2002), relatively little is known about the three-dimensional structure of growth cones, which is difficult to determine in vivo in the mouse embryo and impossible in the human embryo (Keller, 2005).
Cellular three-dimensional structures can be analyzed with different imaging techniques. Despite the enormous advancements brought about by electron and scanning probe microscopy, about 80% of all microscopy investigations in the life sciences are still carried out with conventional lenses and visible light. Taking advantage of the optical transparency of cells, light microscopy uniquely provides noninvasive imaging of the interior of cells (Hell, 2007).
Discovered and first patented in 1957 by Marvin Minsky, confocal microscope, a predecessor to today's widely used confocal laser scanning microscopy (CLSM) has allowed a major advance in biological imaging of cell structure and physiology in thick specimens, in three dimensions and in time. CLSM offers high-quality three-dimensional fluorescent images over conventional wide-field optical microscopy, due to its ability to control the depth of a focal plane to eliminate out-of-focus light or glares in specimens and its capability to collect serial (i.e., z-stack) optical images for thick specimens without the need for physical sectioning of the tissue. In this way, thin, optical sections with greater resolution and contrast and with greater sensitivity than conventional, wide-field microscopes are produced (Dailey et al., 1999; Park et al., 2010; Pawley, 2006).
Confocal laser scanning microscopy (CLSM) utilizes the optical pathway of a regular optical microscope and in combination with immunofluorescence histochemistry has been widely used to simultaneously map the distribution and localization of different cellular components (extracellular and intracellular macro-molecules, including proteins, nucleic acids and lipids, as well as intracellular ions such as calcium) helping to understand intracellular mechanisms (Dailey et al., 1999; Rajwa et al., 2004). Moreover, it is possible to monitor the process and dynamics of living cells with high temporal resolution (Hell, 2007; Park et al., 2010).
The 200 nm resolution limit of the CLSM is restricted by the diffraction limits of the microscope objective and does not permit accurate evaluation of the sample height. The z-resolution of CLSM for any given wavelength is always at least 2 times less than the corresponding xy-resolution thus restricting a detailed structural image that can be achieved when exploring biological samples (Doak et al., 2008; Rajwa et al., 2004).
Great advances in optical microscopy such as near field scanning optical microscopy (NSOM), stimulated emission depletion microscopy (STED), photoactivated localization microscopy (PALM), and stochastic optical reconstruction microscopy (STORM) have been achieved to overcome the optical diffraction limit (Hell, 2007 and 2009; Schermelleh et al., 2010), but there are still constraints for realizing time-resolved dynamics or three dimensional imaging (Park et al., 2010). These techniques provide an excellent spatial resolution in the xy plane also in live specimens but relying on the presence of fluorophores cannot provide information on the overall morphology of cells.
State-of-the-art transmission and scanning electron microscopy techniques are technically demanding, relatively costly, and time-consuming. Moreover, the possibility to specifically label and visualize multiple cellular structures or components in one specimen is still limited. Furthermore, chemical fixation, contrasting procedures and/or physical sectioning can cause artifacts and exclude the option to observe living cells (Schermelleh et al., 2010). With the discovery of Atomic force microscopy (AFM), amazing progress has been made in the imaging of biomolecules with sub-nanometer resolution (Binnig et al., 1986; Engel et al. 1997; Fotiadis et al., 2002; Kasas et al, 1993; Lal & John, 1994; Müller et al., 1999), comparable to scanning electron microscopy. To date, AFM has been used increasingly and is progressively becoming a usual benchtop technique. The volume of scientific publications citing AFM increases continuously and papers with a biological emphasis reached more than 21% of total publications (as in 2006) (Parot et al., 2007).
AFM is a scanning probe device, which generates an image by systematically scanning a sharp tip mounted on the end of a flexible cantilever over the samples’ surface. The tip interacts with the surface causing the cantilever to bend. A laser beam acting as an optical lever is deflected from the end of the cantilever to a position sensitive photo-diode that measures the cantilever deflection. In this way a topographic map of the surface is generated (Doak et al., 2008). AFM can be used in ambient air or under liquid and provides an unprecedented way to image the morphological structure of the surfaces of cells and other biological samples, i.e. it images the surfaces where most of the regulatory biochemical and other signals are directed (Lal & John, 1994). By functionalizing the cantilever tip with appropriate molecules, (Reddy et al., 2004; Li et al., 2006), it is possible to localize specific molecules on the surface of the cell and to obtain a high resolution map of their localization. Furthermore, AFM, by measuring forces within and between biological molecules, can provide additional
biophysical information on molecular characteristics by acting as a sensor that quantifies the interaction forces between the tip and sample as they are brought into and out of contact (Butt et al., 2005, as cited in Doak et al., 2008).
In the case of neurons, the majority of AFM imaging has focused on the cell body, axon, and synaptic vesicles, whereas less attention has been paid to the growth cone and its underlying cytoskeletal structures (Grzywa et al., 2006; Laishram et al., 2009; McNally et al., 2005; Parpura et al., 1993; Xiong et al., 2009; Yunxu et al., 2006). In particular the morphological characterization at nanometer scale of ES-derived growth cones with AFM is largely unexplored.
As a stand-alone technique, AFM can provide unique biophysical and ultra-structural information on a sample, but a limitation is the difficulty in correlating structural or mechanical features with functionality (Kellermayer et al., 2006; Doak et al., 2008). Therefore it is necessary to combine AFM imaging with other techniques to obtain functional information. In particular, with fluorescent confocal microscopy specific subcellular components can be stained allowing functional studies.
AFM microscopy is a scanning method and therefore cannot be used to investigate the motion of large biological samples at a high temporal resolution, which are better viewed with conventional video imaging with CCD cameras (Cojoc et al., 2007; Niell and Smith, 2004; Schaefer et al., 2002) or time-lapse confocal microscope (Dailey et al., 1999; Fishell et al., 1995). It is possible to follow moving biological structures with AFM only when small details such as filopodia are imaged (McNally et al., 2005), or the temporal resolution is substantially decreased (Yunxu et al., 2006).
Here we describe how combining three different imaging techniques (time-lapse DIC imaging, AFM on both fixed and living neurons and fluorescence confocal microscopy) used separately, at different times, on different instruments - but on the same samples it was possible to provide a morphological characterization of ES-derived growth cones related to their movement (Ban et al., 2011) and hypothesize a possible functional role of the fragmented structures observed only in a fraction of growth cones.
2. Combined AFM, confocal and DIC imaging for characterization of
ES-derived neuronal growth cones
2.1 Morphological characterization of ES-derived growth cones
AFM imaging on more that one hundred fixed cells (n=119) revealed different morphologies of ES-derived growth cones, as shown in Figure 1.
ES-derived neuronal precursors were obtained using the protocol described previously (Ban et al., 2007). Cells were plated on coverslips and induced to differentiate for 24 hours. During this period of culture, ES-derived neurons extended neurites with growth cones moving forward, retracting and exploring the environment with their filopodia. The structure of the differentiating growth cones was analyzed by AFM in contact mode in liquid. Cells were plated at a density of 3x10⁴ cells/cm2 in order to obtain isolated growth cones to avoid overlapping structures. This low density, however, is sufficient for the neuronal survival in culture.
At this stage of differentiation, very different structures were observed with the diameter of growth cones that varied from 1.5 to 28 m and height that varied from 65 to 593 nm. They could be classified in three different morphological groups: in the first one (Figure 1D-I) they appeared swollen and smooth, with several filopodia spreading from the central domain. The
height differed substantially from one growth cone to another but in this group (68% of growth cones analyzed) it always exceeded 200nm. In the second group (21% of cases) growth cones were flat with few or no filopodia (Figure 1A-C) and their height was consistently below 200nm. In the third group (11% of cases) growth cones showed a ruffled and fragmented structure with several holes (Figure 1J-L). The height of these growth cones was also below 200nm, and their thickness almost vanished in some regions. All these structural details were not recognizable with optical microscope due to their small dimensions.
Fig. 1. High resolution AFM images of ES-derived growth cones fixed after 24 h of
differentiation. Growth cones could have flat and rough (A-C), swollen and smooth (D-I) or fragmented (J-L) structures. Scale bar, 2µm.
Although during image acquisition the AFM tip interacts with the cell surface and could modify or damage the cell membrane, we demonstrated that the fragmented structures were not an artifact of AFM scanning by acquiring a series of images of a compact growth cone at increasing tapping forces of 200, 1000 and 3000 pN respectively. In 4 independent experiments performed, the height profile of the growth cones at varying forces showed a decrease in height caused by a compression of the cell structures, probably due to the
residual cell elasticity, after the fixation procedure. However, when the imaging force was restored to the initial value of 200pN, the cell morphology was exactly the same as in the first scan and no damage was introduced (Ban et al., 2011).
Holes and fragments of growth cones were not fixation artefacts. In fact, using three different fixation methods both fragmented and compact growth cones were present on the same coverslip and sometimes on neighbouring cells. Fragmented structures were also observed in growth cones of living neurons analyzed by AFM: in 6 out of 23 imaged cells the growth cones retracted leaving behind fragments with variable dimensions. In 3 cases holes in the growth cones were observed and in one case the holes were already present at the first scan. The physiological dynamics was poorly affected by AFM scans and the cantilever tip did not damage the growth cones since in majority of cases (14 out of 23 imaged cells) their compact structure was preserved during the scanning period even though cycles of protrusion and retraction were observed. Moreover, fragmentation observed under living conditions (13% of cases) had comparable proportion in respect to what observed with fixed cells (11% of cases). Altogether, these observations suggested that the fragments observed on the fixed cells were originated before fixation and that fragmentation is a physiological phenomenon (Ban et al., 2011).
We hypothesized that the different morphologies observed in the growth cones might correlate with different types of movement. For doing so we took advantage of the 3 techniques described to study the motion of living growth cones and trying to correlate it with structure and expression of specific subcellular components.
2.2 Preparation of coverslips
To be able to collect images with all these techniques (each of them with different performaces, resolution and collection modes) but from the same cell it was necessary to have a position marker on the sample.
In our case we prepared a home-made coverslips on which ES-derived neuronal precursors were plated and induced to differentiate. But commercial coverslips with numerical grid could serve the same purpose.
Coverslips with printed markers were prepared by optical lithography and metal evaporation on 24mm diameter glass coverslips. A polymeric photoresist was deposited on one side of the coverslips by spin coating. The indexed pattern was produced by UV exposure through a patterned optical mask. A 20nm titanium layer was finally deposited and stripped by lift-off techniques (Figure 2A).
In the free space between printed markers the movement of neurons and their growth cones could be clearly monitored (Figure 2B). Time-lapse DIC and AFM imaging can be performed on living cells while immunofluorescence assays (Figure 2C) and high resolution AFM (Figure 2D) can be done at very different time intervals after fixation (from few hours up to many months if samples are kept at +4°C in paraformaldehyde).
2.3 Correlation between movement and structure/function
Theoretically movement and structure could be analyzed imaging living cells with AFM. When performing AFM on living cells images could be obtained in tapping mode at 0.6 scan line per second and with a maximum of 256 scan lines. In this way the acquisition of AFM images required several minutes and, due to the movement of growth cones and to the fluidity of the membrane, a high resolution AFM image could not be achieved. Giving higher temporal resolution, time-lapse differential interference contrast (DIC) imaging was
used. Images with resolution between 512x512 and 1024x1024 pixels were acquired every 10 seconds, for a total of 80 frames (total duration 13 minutes and 20 seconds) and the motion of more than 100 growth cones was collected.
Fig. 2. (A) An example of a coverslip with printed markers and numbers. Scale bar, 100 m. (B) ES-derived growth cone (inset) imaged with DIC using a confocal microscope. Scale bar, 25 m. (C) Confocal image (1024x1024 pixels) of a growth cone stained for with an antibody against neural cell adhesion molecule (NCAM). Scale bar, 10 m. (D) AFM image (1024x1024 pixels) of the same growth cone. Scale bar, 5 m. Color bar from 0 to 350nm (From Kondra et al., 2009, Journal of Neuroscience Methods, ELSEVIER).
From the time-lapse analysis 4 different types of movements were observed: exploring (43/104), growing (16/104), retracting (17/104) and stasis (28/104). 29 of these cells were imaged with AFM. Cells were fixed immediately after video imaging, AFM with a resolution between 512x512 and 1024x1024 pixels was performed followed by staining with appropriate antibodies.
Filopodia of exploring growth cones (9 out of 29 cells) moved with a velocity up to 80 nm s-1 with an average value of 25±7 nm s-1 exploring very efficiently the surrounding free space independently in all directions. Some filopodia were continuously extending and retracting, changing rapidly in their length, while some others were freely exploring maintaining their shape. AFM imaging revealed a smooth and compact surface. The growth cones had average height of 852 ± 235 nm and their filopodia had a height varying between 67 and 219 nm (n=40; average height 98.8 ± 48.3nm).
Neurites of growing growth cones (5 out of 29 cells) could grow by 1-5 m in 2-10 minutes and in two cases a neurite grew up to 14 m in less than 2 minutes. As for exploring growth cones, in all cases AFM showed a compact and smooth surface. Filopodia height reached almost 2 m and their average length was 3.5 m (n=20).
Retracting growth cones (7 out of 29 cells) moved with a velocity ranging from 80 to 135 nm/sec, retracting their filopodia and the whole neurites from the original position. After fixation, AFM scanning revealed the presence of fragments near the tip of fast retracting growth cones. The confirm that these fragments were actual parts of the growth cone left behind by the neuron came from AFM imaging of living neurons. In all 6 retracting growth cones observed, fragments with an average diameter of 85 ± 27 nm and an average height of 75 ± 28 nm were detected.
Growth cones were classified as static (8 out of 29 cells) when the external contour of the growth cone remained in the same position and the length of their neurite did not change during DIC observation. These growth cones had an apparently intact shape when viewed with time-lapsed DIC images (Figure 2B), but their 3D shape was highly fragmented when viewed with AFM (Figure 2D). Static growth cones were thinner and rarely reached 200nm height.
When the same growth cone was analyzed with immunofluorescence - with actin and tubulin to follow cytoskeletal component underlying growth cone movement or neural cell adhesion molecule (NCAM) to visualize cell membrane contours - the two images were difficult to compare due to the different resolution (Figure 2C and D). Moreover, AFM and CLSM images contain different information: every pixel at location (x,y) in the AFM images provides a direct measurement in nm of the sample height while fluorescence images acquired with a confocal laser scanning microscope characterize the emitted fluorescence at the same location.
In order to integrate the information derived from AFM and immunofluorescence analyses it is important to properly align or superimpose these different images. This problem has been extensively studied in Computer Vision, where it is referred as “Registration“ of different images (Kondra et al., 2009).
2.4 Image registration
Image registration is the process of overlaying two or more images of the same scene taken at different times, different viewpoints, and/or by different imaging modalities. Differences between images are introduced because of different imaging conditions, such as different viewing points or light conditions or because of the use of two different microscopes, as in the case under consideration. Registration transforms one image – usually the sensed image – so that it becomes aligned to the reference image. Image registration is a crucial step in image analysis and can be solved using methods used in computer vision (Trucco & Verri, 1998), in which the final information is obtained by integrating various data sources like in image fusion (Zitova & Flusser, 2003). Images taken from different modalities may undergo a linear deformation in scale, translation, rotation and sometimes shearing i.e. affine deformation. The word registration is used with two different meanings (Hill et al., 2001). The first meaning is to determine a transformation of one image so that features in the sensed image can be put in a one-to-one correspondence to features in the reference image. The symbol T is used to represent this type of transformation. The second meaning of registration enables also the comparison of the intensity at corresponding positions. The symbol Ti is used to describe this second meaning of registration, which incorporates the concepts of re-sampling and interpolation.
T is a spatial mapping. The more complete mapping Ti maps both position and associated intensity value from image A to image B. Therefore Ti maps an image to an image, whereas T maps between coordinates of image A into coordinates of image B. To overlay two images that have been registered, or to subtract one from another, is necessary to know Ti, not just
T. Ti is only defined in the region of overlap of the image fields of view, and has to take into account of image sampling and spatial resolution.
Before doing the registration, it is necessary to select the correct type of transformation required for the images under consideration. The most widely used transformations are Linear, Affine and Projective. The linear transformation is used when shapes in the sensed image are unchanged, but are distorted by some combination of translation, rotation, and scaling. Straight lines remain straight, and parallel lines are still parallel. This is the case of the same biological sample viewed by two microscopes using different objectives and imaging systems, such as an AFM (Figure 2D) and a CLSM (Figure 2C). Registration using affine transformation is necessary when shapes in the sensed image are distorted also by shearing or a linear deformation. In this case, straight lines remain straight, and parallel lines remain parallel, but rectangles become parallelograms. Projective transformation is used when the scene appears tilted. Straight lines remain straight, but parallel lines converge toward vanishing points that might or might not fall within the image.
If we consider two images of the same biological sample, the first one acquired using AFM and the second using a CLSM, the two imaging systems differ because of different scale factors, by a rigid translation of their origin and a possible rotation of their axis. It is assumed that the two imaging systems do not introduce any deformation. Registration of the two images consists in the determination of the transformation parameter by aligning properly the two images.
The unknown parameters in the transformation matrix can be estimated either by matching a selected number of points or landmarks in the two images or by matching entire contours in the two images. The first method is used when it is possible to identify in the two images enough points corresponding to the same physical structure, such as the tip of a dendrite, or a small vesicle. The second method is used in presence of rounded biological structures, with no obvious marks and it is more convenient to put in correspondence two contours than isolated points.
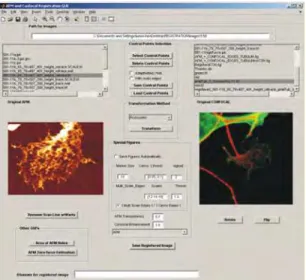
Fig. 3. Snapshot of the graphical user interface (From Kondra et al., 2009, Journal of Neuroscience Methods, ELSEVIER).
To apply these methods to the images derived from different microscopes we have implemented our Registration program using Matlab7.1 (The MathWorks Inc. http://www.mathworks.com) a standard tool common in the computer vision and biomedical community for statistical analysis and production of figures and images of analyzed data and results.
For a more detailed mathematical description of the different transformations and description of the program see Kondra et al., 2009, Appendix 1, 2 and 3).
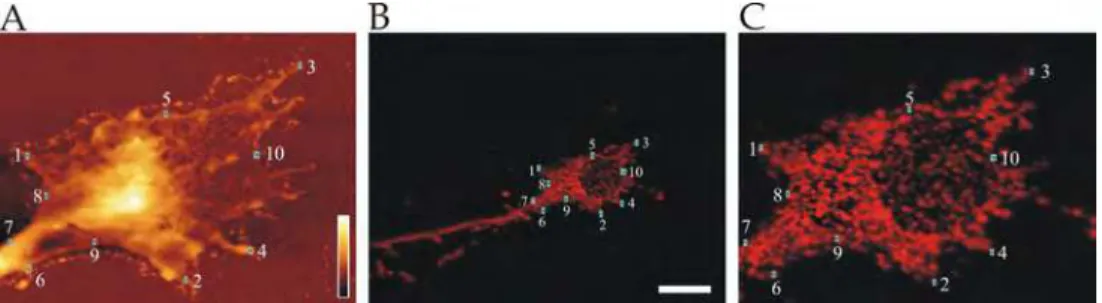
Corresponding points or contours in AFM image and confocal image were marked by hand using a friendly graphical user interface developed for this particular purpose (Figure 3). Registration by points selection method is illustrated in Figure 4. The operator identifies N (minimum 3) points in the AFM image (Figure 4A) that are put in correspondence with N points in the confocal image (Figure 4B). Corresponding points in Figure 4A and B are indicated by the same number. By using these correspondences the parameters determining the transformation T are obtained by solving a system of linear equation and the confocal image can be registered. In this way same physical points in the original AFM and in the new registered confocal image, shown in Figure 4C, have the same location.
To make more user friendly the selection of points, confocal image can be rotated in a sequence of 90 degrees and/or flipped to make a approximate alignment with AFM image (compare Figure 2C with Figure 4B). Control Point Selection Tool in Matlab was used to mark the control point pairs in the image to be registered, the input image (Figure 4B), and the image to which you are comparing it, the base image (Figure 4A) corresponding points were initially specified by pointing and clicking in the input and base images so that each point specified in the input image had a match in the base image.
Fig. 4. Example of registering images using points selection method. (A) AFM image of ES-derived growth cone. Color bar from 0 to 350nm. (B) Confocal image of the same ES-ES-derived growth cone. Scale bar, 10 m. (C) Registered confocal image (From Kondra et al., 2009, Journal of Neuroscience Methods, ELSEVIER).
The advantage of this tool is that, after the first three pairs are selected, it is sufficient to select a point in the input image and the Control Point Selection Tool estimates its match point in the base image or vice versa automatically, based on the geometric relationship of the previously selected control points. Another advantage of this tool is that if the image is not registered properly, it is possible to change the position of control points to get the exact superimposition.
The alternative method is registration by aligning contours with Procrustes Analysis. Procrustes was a robber in Greek mythology. He would offer travellers hospitality in his
road-side house, and the opportunity to stay the night in his bed that would perfectly fit each visitor. As the visitors discovered to their cost, however, it was the guest who was altered to fit the bed, rather than the bed that was altered to fit the guest (Hill et al., 2001). Let us consider that the AFM image is like the bed and is the guest. So using the Procrustes’ method means that confocal image is altered by scaling and/or rotating it to approximately fit AFM image. The number of landmarks available depends on the structure of the image, and there may be differences in opinion between scientists as to which landmarks are consistent and locatable. Marking of the corresponding points thus becomes difficult when there are few corners in the structure, and thus exact location of the points is impossible and can differ from observer to observer. This problem can be solved by marking many points along the contour of the structure in both images. The contours are then interpolated so that both of them contain the same number of equally spaced points (for mathematical description of transformation see Kondra et al., 2009).
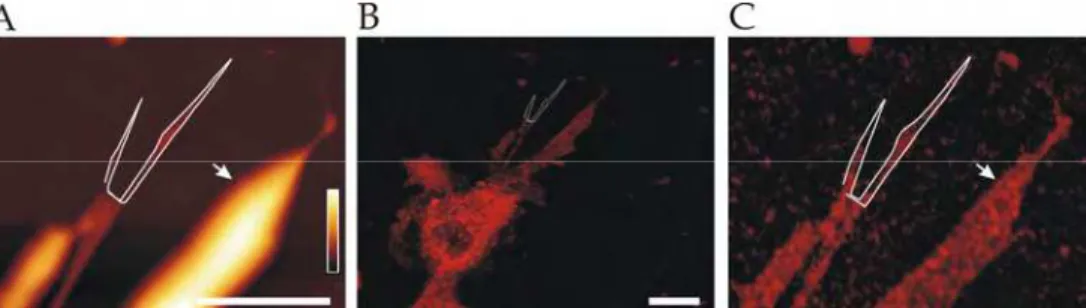
An example of this method is illustrated in Figure 5. A contour was marked by continuously clicking on points following the borderline of the structure of interest in AFM image (Figure 5A) and in the confocal image as well (Figure 5B). As a consequence of Procrustes analysis, confocal image was properly transformed and put in correspondence with AFM image (Figure 5C).
Fig. 5. Example of registering images using Procrustes Analysis. (A) AFM image of ES-derived growth cone. Scale bar, 10m. Color bar from 0 to 2200 nm. (B) Confocal image of the same ES-derived growth cone stained for neural cell adhesion molecule (NCAM). Scale bar, 10m. (C) Registered confocal image of membrane protein NCAM (From Kondra et al., 2009, Journal of Neuroscience Methods, ELSEVIER).
2.5 Identification of nanometric structures and subcellular component in static fragmented growth cones
With registration of confocal and AFM images it was possible to further analyze the composition of fragments characteristic of static and retracting growth cones. Their structure seemed compact when viewed with time-lapsed DIC images (Figure 6A), instead AFM (Figure 6B) revealed highly fragmented 3D shape. Profiles of AFM images of static growth cones showed isolated fragments with height that varied from 50 to 150 nm (Figure 6E). Registered confocal images demonstrated that they contain actin filaments but not tubulin and they are positive for neural cell adhesion molecule (NCAM) indicating that fragments left behind by growth cones are formed by chunks of actin filaments enveloped by the cell membrane (Figure 6C and D).
Height of fragments and of filopodia had a similar distribution varying from less than 30 nm up to 300 nm (Ban et al., 2011). Immobile growth cones not only were surrounded by detached fragments, but they also had holes. Growth cone regions surrounding these holes had a height varying from 20 to 90 nm and holes had an area varying between 0.03 to 0.650 m2. Fragments had a height varying from 40 to 400 nm with an area varying between 0.4 to 6m2.
During the time-lapse DIC imaging none of the neurons with static growth cones showed signs of membrane blebbing or cell shrinking typical of apoptotic cell indicating that the observed fragmentation was not associated with apoptosis. Moreover, nuclear staining by Hoechst revealed that none of the eight cells that were also analyzed by AFM and immunofluorescence after fixation had an apoptotic nucleus. We can therefore conclude that growth cone fragmentation is not part of the apoptotic process.
Fig. 6. Static growth cones. (A) DIC, (B) AFM topography and (C) registered confocal image of the same growth cone stained for F-actin (green), NCAM (red) and -tubulin III (blue). Scale bar, 5 m. (D) Confocal image of the inset shown in C. (E) Height profile along the white line shown in D.
3. Discussion
Three different imaging techniques used separately, at different times, on different instruments - but on the same samples and the possibility to compare AFM and confocal images due to the development of the registration method (Kondra et al., 2009) allowed us to obtain a morphological characterization of ES-derived growth cones.
Integrated AFM and CLSM instrument has been developed and it offers the advantage of parallel analysis of the same sample with nanometer-scale spatial resolution, frame/second temporal resolution, and chemical identification through fluorescence detection can be done simultaneously for live cells (Doak et al., 2008; Park et al., 2010).
In addition to optical microscopy, AFM can be combined with other instruments and techniques, such as microfluidic liquid cell (Schoenwald et al., 2010), patch-clamp (Pamir et al., 2008) or ultramicrotome (Efimov et al., 2007) providing a novel insights to further understanding of cellular structure-function relationships getting down to the scale of single molecule.
Although there are several studies where AFM is combined with confocal microscope (Doak et al, 2008; Moreno Flores & Toca-Herrera., 2009; Kassies et al., 2005; Owen et al., 2006; Park et al., 2010), our method is useful in cases where combined fluorescence (confocal) and atomic force microscope is not available. In addition, performing different assays separately permitted optimization of sample preparation for each experiment. For example, AFM on fixed cells was performed in contact mode, in liquid (phosphate buffer saline (PBS)) while for immunofluorescence assays, coverslips were mounted with commercial mounting medium, in order to reduce photobleaching during the repetitive number of confocal scans required to zoom in the region corresponding to the growth cone. Our AFM microscope was provided with fluorescence setup and we collected some fluorescent images while performing AFM. However, in PBS the samples bleached rapidly and the resulting images had poor definition.
The combination of AFM and fluorescence confocal microscopy on fixed cells, and of time-lapse DIC and AFM imaging on living cells allowed us to correlate morphology of ES-derived growth cones to their movement prior fixation providing therefore both structural and functional insights.
Growth cones actively exploring the environment before fixation had a smooth external surface. In contrast, growth cones which were immobile before fixation revealed a fragmented shape, composed of several nanoscale structures either partly attached or completely isolated from the rest of the growth cone. In addition, by using AFM on live specimen, fragmentation was observed in some of the retracting growth cones. Therefore the morphology of ES-derived growth cones depends on their overall motility.
Growth cones with micrometric size holes of retinal ganglion cell axons were previously observed in vivo (Godement et al., 1994; Mason & Erskin, 2000). They appear in the spread growth cones and are predicted to form from the fusion or contact of lamellar extensions of the growth cone as they enfold radial glial processes. However, although morphologically similar, these two findings reflect a different biological phenomenon: first because our observations were the result of a technical approach measuring at nanometric level and second, because we never found fragmented structures in growing growth cones.
The fragmentation can be related to growth cones pruning that occurs during the early development of the central nervous system, where an excessive outgrowth of projections need to be refined to achieve precise connectivity (Faulkner et al., 2007). The selective
elimination of neuronal cell processes, or neurites, is an essential step during normal development and occurs through retraction, degeneration, or a combination of both (Franze et al., 2009).
This phenomenon resembles the growth cone collapse induced by several factors like mercury (Leong et al., 2001), X-ray (Al-Jahdari et al., 2008) or semaphorin in the absence of growth factors (Tamagnone & Comoglio, 2004). The fragmentation of the growth cone we observed is a local phenomenon, similar to what observed for Lysophosphatidic acid (LPA) induction of collapse in vitro which, in contrast with other collapsing treatments, is reversible and not toxic (Saito, 1997). However, to our knowledge, this is the first time that this collapse-like phenomenon was observed to occur spontaneously.
Previous investigations have shown the formation of migration tracks resulting from the release of cellular material onto glass surfaces and artificial matrices for a number of cell types (Fuhr et al., 1998; Kirfel et al., 2004; Richter et al., 2000; Zimmermann et al., 2001). Macroaggregates left behind migrating keratinocytes contain high amounts of 1 integrin and parts of the fibronectin and laminin receptors. They lack, however, of any cytosolic proteins including actin and of the adhesion complex constituents talin and vinculin. In our experimental conditions, fragments left behind by growth cones are composed of cell membrane but also of cytoplasmic proteins such as F-actin, as it was reported for other migrating cells (Fuhr et al., 1998). Fragments could correspond to filopodia originally present on the growth cone in that position also because the height distribution of filopodia and fragments was similar, suggesting that they may be composed of similar building/dismantling blocks. The existence of building blocks could agree with a previous study (Parpura et al., 1993) where it was found that the height of an hippocampal growth cones corresponds to a multiple of the heights of individual filopodia possibly due to overlying actin bundles arising from different filopodia.
The release of a fragment might be energetically advantageous for faster retraction and/or change in growing direction compared to recycling of distal elements. However it cannot be excluded that fragments might act as guidance signals for neighboring neurons.
Vertebrate semaphorins are either secreted or associated with the cell surface. In vitro and in
vivo experiments have implicated semaphorins in the guidance of elongating axons and dendrites, as well as in axon branching, pruning and degeneration (Tamagnone & Comoglio, 2004). The primary role of Sema 3A in the nervous system is to repel growth cones from inappropriate areas and to help steer both axons and migrating cells along the correct trajectory (Brown & Bridgman, 2009). When added in bath, they cause rapid collapse of growth cones, followed by axon retraction (Kolpak et al., 2009).
The fragmentation of growth cones that have not established contact or by pruned contact here observed could therefore serve as a migrating track for other neurons, by exposing semaphorins or other membrane proteins that act as receptors and/or ligands for axon guidance.
4. Conclusion
The combination of AFM and fluorescence confocal microscopy on fixed cells, and of time-lapse DIC and AFM imaging on living cells allowed us to obtain a morphological characterization of ES-derived growth cones related to their movement providing both structural and functional insights.
In particular the registration method allowed to superimpose images taken from different modalities. Registration, however, is not restricted to confocal and AFM images but is a versatile tool for combined studies. The main advantage is that there is no need for sophisticated and combined microscopes but with conventional instruments and AFM, structural information at nanometer scale is combined with functional studies.
5. Acknowledgment
This work was supported by the EU projects: NEURO Contract n. 012788 (FP6-STREP, NEST) and NanoScale Contract n.214566 (FP7-NMP-2007-SMALL-1). In addition we need to acknowledge the financial support of a FIRB grant D.M.31/03/05 from the Italian Government, of Contr. RICN no.011936 BINASP from the European Community, of funds from the Istituto Italiano di Tecnologia (Research Unit IIT) and of the GRAND Grant from CIPE/FVG by the Friuli Venezia Giulia region.
6. References
Al-Jahdari, W.S.; Suzuki, Y.; Yoshida, Y.; Noda, S.E.; Shirai, K.; Saito, S; Goto, F. & Nakano, T. (2008). Growth cone collapse and neurite retractions: an approach to examine X-irradiation affects on neuron cells, Journal of Radiation Research (Tokyo), Vol.49, No.5, (September 2008), pp. 481-489
Ban, J.; Bonifazi, P.; Pinato, G.; Broccard, F.D.; Studer, L.; Torre V. & Ruaro, M.E. (2007). Embryonic stem cell-derived neurons form functional networks in vitro. Stem Cells, Vol.25, No.3, (March 2007), pp. 738-749
Ban, J.; Migliorini, E.; Di Foggia, V.; Lazzarino, M.; Ruaro, M.E. & Torre, V. (2011). Fragmentation as a Mechanism for Growth Cone Pruning and Degeneration. Stem
Cells and Development, Vol.20, No.6, (June 2011), pp.1031-1041
Barberi, T.; Klivenyi, P.; Calingasan, N.Y.; Lee, H.; Kawamata, H.; Loonam, K.; Perrier, A.L.; Bruses, J.; Rubio, M.E.; Topf, N.; Tabar, V.; Harrison, N.L.; Beal, M.F.; Moore, M.A. & Studer, L. (2003). Neural subtype specification of fertilization and nuclear transfer embryonic stem cells and application in parkinsonian mice. Nature
Biotechnology, Vol. 21, No. 10, (October 2003), pp.1200-1207
Binnig, G.; Quate, C.F. & Gerber, C. (1986). Atomic force microscope. Physical Review Letters, Vol.56, No.9, (March 1986), pp. 930-933
Bradley, A.; Evans, M.; Kaufman, M.H. & Robertson, E. (1984). Formation of germ-line chimaeras from embryo-derived teratocarcinoma cell lines. Nature, Vol.309, No.5965, (May 1984), pp. 255-256
Brown, J.A. & Bridgman, P.C. (2009). Disruption of the cytoskeleton during Semaphorin 3A induced growth cone collapse correlates with differences in actin organization and associated binding proteins. Developmental Neurobiology, Vol.69, No.10 (September 2009), pp.633-646
Cai, C. & Grabel, L. (2007). Directing the differentiation of embryonic stem cells to neural stem cells. Developmental Dynamics, Vol.236, No.12, (December 2007), pp. 3255-3266 Cojoc, D.; Difato, F.; Ferrari, E.; Shahapure, R.B.; Laishram, J.; Righi, M.; Di Fabrizio, E.M. &
the involvement of cytoskeletal components. PLoS ONE, Vol.24, No.10, (October 2007), e1072
Dailey, M.; Marrs, G.; Satz, J. & Waite, M. (1999). Concepts in imaging and microscopy. Exploring biological structure and function with confocal microscopy. Biological
Bullettin, Vol.197, No.2, (October 1999), pp. 115-122
Dent, E.W. & Gertler, F.B. (2003). Cytoskeletal dynamics and transport in growth cone motility and axon guidance. Neuron, Vol. 40, No.2 (October 2003), pp. 209-227 Dickson, B.J. (2002). Molecular mechanisms of axon guidance. Science, Vol.298, No.5600,
(December 2002), pp. 1959-1964. Erratum in: Science, Vol.299, No.5606, (January 2003), pp. 515
Doak, S.H.; Rogers, D.; Jones, B.; Francis, L.; Conlan, R.S. & Wright, C. (2008). High-resolution imaging using a novel atomic force microscope and confocal laser scanning microscope hybrid instrument: essential sample preparation aspects.
Histochemistry and Cell Biology, Vol.130, No.5, (November 2008), pp. 909-916
Efimov, A.E.; Tonevitsky, A.G.; Dittrich, M. & Matsko, N.B. (2007). Atomic force microscope (AFM) combined with the ultramicrotome: a novel device for the serial section tomography and AFM/TEM complementary structural analysis of biological and polymer samples. Journal of Microscopy, Vol.226, Pt3, (June 2007), pp. 207-217 Engel, A.; Schoenenberger, C.-A. & Muller, D.J. (1997). High resolution imaging of native
biological sample surfaces using scanning probe microscopy. Current Opinion in
Structural Biology, Vol.7, No.2, (April 1997), pp. 279-284
Evans, M.J. & Kaufman, M.H. (1981). Establishment in culture of pluripotential cells from mouse embryos. Nature, Vol.292, No.5819, (Jul 1981), pp. 154-156
Faulkner, R.L.; Low, L.K. & Cheng, H.J. (2007). Axon pruning in the developing vertebrate hippocampus. Developmental Neuroscience, Vol.29, No.1-2 (December 2006), pp. 6-13 Fishell, G.; Blazeski, R.; Godement, P.; Rivas, R.; Wang, L.C. & Mason, C.A. (1995). Optical
microscopy. 3. Tracking fluorescently labeled neurons in developing brain. FASEB
Journal, Vol.9, No.5, (March 1995), pp. 324-34
Fotiadis, D.; Scheuring, S.; Müller, S.A.; Engel, A. & Müller, D.J. (2002). Imaging and manipulation of biological structures with the AFM. Micron, Vol.33, No.4, (January 2002), pp. 385-397
Fraichard, A.; Chassande, O.; Bilbaut, G.; Dehay, C.; Savatier, P. & Samarut, J. (1995). In vitro differentiation of embryonic stem cells into glial cells and functional neurons.
Journal of Cell Science, Vol.108, No.10, (October 1995), pp. 3181-3188
Franze, K.; Gerdelmann, J.; Weick, M.; Betz, T.; Pawlizak, S.; Lakadamyali, M.; Bayer, J.; Rillich, K.; Gögler, M.; Lu, Y.B.; Reichenbach, A.; Janmey, P. & Käs, J. (2009). Neurite branch retraction is caused by a threshold-dependent mechanical impact.
Biophysical Journal, Vol.97, No.7, (October 2009), pp. 1883-1890
Fuhr, G.; Richter, E.; Zimmermann, H.; Hitzler, H.; Niehus, H. & Hagedorn, R. (1998). Cell traces--footprints of individual cells during locomotion and adhesion. Biological
Chemistry, Vol.379, No.8-9 (August-September 1998), pp. 1161-1173
Gaspard, N. & Vanderhaeghen, P. (2010). Mechanisms of neural specification from embryonic stem cells. Current Opinion in Neurobiology, Vol.20, No.1, (February 2010), pp. 37-43
Gaspard, N. & Vanderhaeghen, P. (2011). From stem cells to neural networks: recent advances and perspectives for neurodevelopmental disorders. Developmental
Medicine & Child Neurology, Vol.53, No.1, (January 2011), pp. 13-17
Gilbert, S.F. (2000). Neural crest cells and axonal specificity, In: Developmental Biology. Sunderland, MA, Sinauer, pp. 407-441. ISBN-10: 0-87893-243-7
Godement, P.; Wang, L.C. & Mason, C.A. (1994). Retinal axon divergence in the optic chiasm: dynamics of growth cone behaviour at the mideline. Journal of Neuroscience, Vol.14, No.11 Pt2 (November 1994), pp. 7024-7039. Erratum in: Journal of
Neuroscience, Vol.15, No.3 Pt1, (March 1995), followi
Grzywa, E.L.; Lee, A.C.; Lee, G.U. & Suter, D.M. (2006). High-resolution analysis of neuronal growth cone morphology by comparative atomic force and optical microscopy. Journal of Neurobiology, Vol.66, No.14, (December 2006), pp.1529-1543 Hell, S.W. (2007). Far-field optical nanoscopy. Science, Vol.316, No. 5828, (May 2007), pp.
1153-1158
Hell, S.W. (2009). Microscopy and its focal switch. Nature Methods, Vol.6, No.1, (January 2009), pp. 24-32
Hill, D.L.; Batchelor, P.G.; Holden, M. & Hawkes, D.J. (2001) Medical image registration.
Physics in Medicine and Biology, Vol46, No.3, (March 2001), pp. R1-45
Kasas, S.; Gotzos, V. & Celio, M.R. (1993). Observation of living cells using the atomic force microscope. Biophysical Journal, Vol.64, No.2, (February 1993), pp. 539-544
Kassies, R.; van der Werf, K.O.; Lenferink, A.; Hunter, C.N.; Olsen, J.D.; Subramaniam, V. & Otto, C. (2005). Combined AFM and confocal fluorescence microscope for applications in bio-nanotechnology. Journal of Microscopy, Vol.217, No. 1 (January 2005), pp. 109-116
Keller, G. (2005). Embryonic stem cell differentiation: emergence of a new era in biology and medicine. Genes &Development, Vol.19, No.10, (May 2005), pp. 1129-1155 Kellermayer, M.S.; Karsai, A.; Kengyel, A.; Nagy, A.; Bianco, P.; Huber, T.; Kulcsár, A.;
Niedetzky, C.; Proksch, R. & Grama, L. (2006). Spatially and temporally synchronized atomic force and total internal reflection fluorescence microscopy for imaging and manipulating cells and biomolecules. Biophysical Journal, Vol.91, No.7, (October 2006), pp.2665-2677
Kirfel, G.; Rigort, A; Borm, B. & Herzog, V. (2004). Cell migration: mechanisms of rear detachment and the formation of migration tracks. European Journal of Cell Biology, Vol.83, No.11-12, (December 2004), pp.717-724
Kolpak, A.L.; Jiang, J.; Guo, D.; Standley, C.; Bellve, K.; Fogarty, K. & Bao, Z.Z. (2009). Negative guidance factor-induced macropinocytosis in the growth cone plays a critical role in repulsive axon turning. Journal of Neuroscience, Vol.29, No.34 (August 2009), pp.10488-10498
Kondra, S.; Laishram, J.; Ban, J.; Migliorini, E.; Di Foggia, V.; Lazzarino, M.; Torre, V. & Ruaro, M.E. (2009). Integration of confocal and atomic force microscopy images.
Journal of Neuroscience Methods, Vol.177, No.1, (February 2009), pp. 94-107
Lai, H.C. & Johnson, J.E. (2008). Neurogenesis or neuronal specification: phosphorylation strikes again! Neuron, Vol.58, No.1, (April 2008), pp.3-5
Laishram., J.; Kondra, S.; Avossa, D.; Migliorini, E.; Lazzarino, M. & Torre, V. (2009). A morphological analysis of growth cones of DRG neurons combining atomic force
and confocal microscopy. Journal of Structural Biology, Vol.168, No.3, (December 2009), pp. 366-377
Lal, R. & John, S.A. (1994). Biological applications of atomic force microscopy. American
Journal of Physiology, Vol.266, No.1, (January 1994), pp. C1-21
Leong, C.C.; Syed, N.I. & Lorscheider, F.L. (2001). Retrograde degeneration of neurite membrane structural integrity of nerve growth cones following in vitro exposure to mercury. Neuroreport, Vol.12, No.4, (March 2001), pp. 733-737
Li, G.; Xi, N. & Wang, D.H. (2006). Probing membrane proteins using atomic force microscopy. Journal of Cellular Biochemistry, Vol.97, No.6, (April 2006), pp. 1191-1197 Martin, G.R. (1981). Isolation of a pluripotent cell line from early mouse embryos cultured in medium conditioned by teratocarcinoma stem cells. Proceedings of the National
Academy of Sciences of the United States of America, Vol.78, No.12, (December 1981), pp. 7634-7638
Mason, C. & Erskine, L. (2000). Growth cone form, behavior, and interactions in vivo: retinal axon pathfinding as a model. Journal of Neurobiology, Vol.44, No.2 (August 2000), pp. 260-270. Erratum in: Journal of Neurobiology, Vol.45, No.2, (November 2000), p. 134
McNally, H.A.; Rajwa, B.; Sturgis, J. & Robinson, J.P. (2005). Comparative three-dimensional imaging of living neurons with confocal and atomic force microscopy. Journal of
Neuroscience Methods, Vol.142, No.2, (March 2005), pp. 177-184
Moreno Flores, S. & Toca-Herrera, J.L. (2009). The new future of scanning probe microscopy: Combining atomic force microscopy with other surface-sensitive techniques, optical microscopy and fluorescence techniques. Nanoscale, Vol.1, No.1, (October 2009), pp. 40-49
Müller, D.J.; Fotiadis, D.; Scheuring, S.; Müller, S.A. & Engel, A. (1999). Electrostatically balanced subnanometer imaging of biological specimens by atomic force microscope. Biophysical Journal, Vol.76, No.2, (February 1999), pp. 1101-1111
Niell, C.M. & Smith, S.J. (2004). Live optical imaging of nervous system development.
Annual Review of Physiology, Vol.66, (March 2004), pp. 771-798
Okabe, S.; Forsberg-Nilsson, K.; Spiro, A.C.; Segal, M. & McKay, R.D. (1996). Development of neuronal precursor cells and functional postmitotic neurons from embryonic stem cells in vitro. Mechanisms of Development, Vol.59, No.1, (September 1996), pp. 89-102
Owen, R.J.; Heyes, C.D.; Knebel, D.; Röcker, C. & Nienhaus, G.U. (2006). An integrated instrumental setup for the combination of atomic force microscopy with optical spectroscopy. Biopolymers, Vol.82, No.4, (July 2006), pp. 410-414
Pamir, E.; George, M.; Fertig, N. & Benoit, M. (2008). Planar patch-clamp force microscopy on living cells. Ultramicroscopy, Vol.108, No.6, (May 2008), pp. 552-557
Park, J.W.; Park, A.Y.; Lee, S.; Yu, N.K.; Lee, S.H. & Kaang, B.K. (2010). Detection of TrkB receptors distributed in cultured hippocampal neurons through bioconjugation between highly luminescent (quantum dot-neutravidin) and (biotinylated anti-TrkB antibody) on neurons by combined atomic force microscope and confocal laser scanning microscope. Bioconjugate Chemistry, Vol.21, No.4, (Aprile 2010), pp. 597-603
Parot, P.; Dufrêne, Y.F.; Hinterdorfer, P.; Le Grimellec, C.; Navajas, D.; Pellequer, J.L. & Scheuring, S. (2007). Past, present and future of atomic force microscopy in life sciences and medicine. Journal of Molecular Recognition, Vol.20, No.6, (November 2007), pp. 418-431
Parpura, V.; Haydon, P.G. & Henderson, E. (1993). Three-dimensional imaging of living neurons and glia with the atomic force microscope. Journal of Cell Science, Vol.104, Pt2, (February 1993), pp. 427-32
Pawley, J.B. (2006). Handbook of biological confocal microscopy, Third Edition, Springer, available from: http://www.springerlink.com/content/978-0-387-25921-5#section=746525&page=1&locus=0
Rajwa, B.; McNally, H.A.; Varadharajan, P.; Sturgis, J. & Robinson, J.P. (2004). AFM/CLSM data visualization and comparison using an open-source toolkit. Microscopy
Research and Technique, Vol.64, No.2, (June 2004), pp. 176-184
Reddy, C.V.; Malinowska, K.; Menhart, N. & Wang, R. (2004). Identification of TrkA on living PC12 cells by atomic force microscopy. Biochimica et Biophysica Acta, Vol.1667, No.1, (November 2004), pp. 15-25
Richter, E.; Hitzler, H.; Zimmermann, H.; Hagedorn, R. & Fuhr, G. (2000). Trace formation during locomotion of L929 mouse fibroblasts continuously recorded by interference reflection microscopy (IRM). Cell Motility and the Cytoskeleton, Vol.47, No.1, (September 2000), pp.38-47
Saito S. (1997). Effects of lysophosphatidic acid on primary cultured chick neurons.
Neuroscience Letters, Vol.229, No.2, (June 1997), pp. 73-76
Schaefer, A.W.; Kabir, N. & Forscher, P. (2002). Filopodia and actin arcs guide the assembly and transport of two populations of microtubules with unique dynamic parameters in neuronal growth cones. Journal of Cell Biology, Vol.158, No.1, (July 2002), pp. 139-152
Schermelleh, L.; Heintzmann, R. & Leonhardt, H. (2010). A guide to super-resolution fluorescence microscopy. Journal of Cell Biology, Vol.190, No.2, (July 2010), pp. 165-175
Schoenwald, K.; Peng, Z.C.; Noga, D.; Qiu, S.R. & Sulchek, T. (2010). Integration of atomic force microscopy and a microfluidic liquid cell for aqueous imaging and force spectroscopy. Review of Scientific Instruments, Vol.81, No.5, (May 2010):053704 Staii, C.; Viesselmann, C.; Ballweg, J.; Williams, J.C.; Dent, E.W.; Coppersmith, S.N. &
Eriksson, M.A. (2011). Distance dependence of neuronal growth on nanopatterned gold surfaces. Langmuir, Vol.27, No.1, (January 2011), pp. 233-239
Tamagnone, L. & Comoglio, P.M. (2004). To move or not to move? Semaphorin signalling in cell migration. EMBO Reports, Vol.5, No.4, (April 2004), pp. 356-361
Thomson, J.A.; Itskovitz-Eldor, J.; Shapiro, S.S.; Waknitz, M.A.; Swiergiel, J.J.; Marshall, V.S. & Jones, J.M. (1998). Embryonic stem cell lines derived from human blastocysts.
Science, Vol.282, No.5391, (November 1998), pp. 1145-1147. Erratum in: Science, Vol.282, No.5395, (December 1998), p. 1827
Trucco, E. & Verri, A. (1998). Introductory Techniques for 3-D Computer Vision. 1998; Prentice Hall, New Jersey, USA.
Xiong, Y.; Lee, A.C.; Suter, D.M. & Lee, G.U. (2009). Topography and nanomechanics of live neuronal growth cones analyzed by atomic force microscopy. Biophysical Journal, Vol.96, No.12, (June 2009), pp. 5060-5072
Yunxu, S.; Danying, L.; Yanfang, R.; Dong, H. & Wanyun, M. (2006). Three-dimensional structural changes in living hippocampal neurons imaged using magnetic AC mode atomic force microscopy. Journal of Electron Microscopy (Tokyo), Vol.55, No.3, (June 2006), pp. 165-172
Zimmermann, H.; Richter, E.; Reichle, C.; Westphal, I.; Geggier, P.; Rehn, U.; Rogaschewski, S.; Bleiss, W. & Fuhr, G. (2001). Mammalian cell traces: morphology, molecular composition, artificial guidance and biotechnological relevance as a new type of “bionanotube”. Applied Physics, Vol.73, No.1 , (May 2001), pp. 11-26
Zitova, B. & Flusser, J. (2003). Image registration methods: a survey. Image and Vision
ISBN 978-953-307-632-4 Hard cover, 506 pages
Publisher InTech
Published online 12, October, 2011 Published in print edition October, 2011
InTech Europe
University Campus STeP Ri Slavka Krautzeka 83/A 51000 Rijeka, Croatia Phone: +385 (51) 770 447 Fax: +385 (51) 686 166 www.intechopen.com
InTech China
Unit 405, Office Block, Hotel Equatorial Shanghai No.65, Yan An Road (West), Shanghai, 200040, China Phone: +86-21-62489820
Fax: +86-21-62489821
The ultimate clinical implementation of embryonic stem cells will require methods and protocols to turn these unspecialized cells into the fully functioning cell types found in a wide variety of tissues and organs. In order to achieve this, it is necessary to clearly understand the signals and cues that direct embryonic stem cell differentiation. This book provides a snapshot of current research on the differentiation of embryonic stem cells to a wide variety of cell types, including neural, cardiac, endothelial, osteogenic, and hepatic cells. In addition, induced pluripotent stem cells and other pluripotent stem cell sources are described. The book will serve as a valuable resource for engineers, scientists, and clinicians as well as students in a wide range of disciplines.
How to reference
In order to correctly reference this scholarly work, feel free to copy and paste the following:
Maria Elisabetta Ruaro, Jelena Ban and Vincent Torre (2011). Characterization of Embryonic Stem (ES) Neuronal Differentiation Combining Atomic Force, Confocal and DIC Microscopy Imaging, Embryonic Stem Cells - Differentiation and Pluripotent Alternatives, Prof. Michael S. Kallos (Ed.), ISBN: 978-953-307-632-4, InTech, Available from: http://www.intechopen.com/books/embryonic-stem-cells-differentiation-and-pluripotent- alternatives/characterization-of-embryonic-stem-es-neuronal-differentiation-combining-atomic-force-confocal-and-d