Expansion size and presence of CCG/CTC/CGG sequence interruptions
in the expanded CTG array are independently associated to
hypermethylation at the DMPK locus in myotonic dystrophy type
1 (DM1)
Massimo Santoro
a, Luana Fontana
b, Marcella Masciullo
c, Maria Laura Ester Bianchi
d, Salvatore Rossi
d,
Emanuele Leoncini
e, Giuseppe Novelli
b, Annalisa Botta
b,1, Gabriella Silvestri
d,⁎
,1a
Fondazione Don Carlo Gnocchi, Via Capecelatro 66, 20148 Milan, Italy
b
Department of Biomedicine and Prevention, University of Tor Vergata, Via Montpellier 1, 00133 Rome, Italy
cIRCCS Fondazione Santa Lucia, Via Ardeatina, 306, 00142 Rome, Italy
dDepartment of Geriatrics, Neuroscience and Orthopedics, Institute of Neurology, UCSC, Largo F. Vito 1, 00168 Rome Italy e
Institute of Public Health, Section of Hygiene, UCSC, Largo F. Vito 1, 00168 Rome, Italy
a b s t r a c t
a r t i c l e i n f o
Article history: Received 8 July 2015
Received in revised form 9 September 2015 Accepted 16 September 2015
Available online 21 September 2015
Keywords:
Myotonic dystrophy type 1 Variant expansions Methylation High resolution melting DMPK
SIX5
A differential CpG methylation profile upstream of the expanded CTG array at the DMPK locus has been reported in patients with myotonic dystrophy type 1 (DM1), suggesting that hypermethylation might modulate DM1 phe-notype, possibly affecting expression levels of DMPK and/orflanking genes. To clarify this issue, we characterized by methylation sensitive high resolution melting (MS-HRM) the CpG methylation pattern of DNA sequences flanking the pathological CTG expansion in 13 childhood-onset, 37 juvenile/adult-onset, 7 congenital DM1 pa-tients carrying uninterrupted CTG expansions and in 9 DM1 papa-tients carrying variant expansions vs 30 controls. Association of methylation status with disease features (nCTG, age, sex, MIRS, disease duration) was also assessed. Finally, DMPK and SIX5 expression levels were evaluated in leukocytes from controls, methylated and unmethylated DM1 patients.
We found hypermethylation involving upstream sequences of DM1 locus in patients with uninterrupted CTG ex-pansionsN1000 CTG and affected by a congenital or childhood onset form. Besides the n(CTG) and early disease onset, hypermethylation was also significantly associated with maternal transmission.
On the other hand, hypermethylation involved the 3′ of the CTG array in DM1 patients carrying variant expan-sions. DMPK and SIX5 expression did not significantly differ in methylated vs unmethylated DM1 patients. Our results suggest that either the inherited size of the expanded allele and the presence of interruptions at the 3′ end are associated with a highly polarized pattern of CpG methylation at the DM1 locus and that, at least in leu-kocytes, DM1 locus hypermethylation would not significantly affect DMPK or SIX5 expression.
© 2015 Elsevier B.V. All rights reserved.
1. Introduction
Myotonic dystrophy type 1 (DM1, dystrophia myotonica, Steinert's disease; OMIM 160900), the most common form of adult-onset muscu-lar dystrophy in humans, is characterized by muscle weakness, wasting and myotonia[1].
The clinical spectrum of DM1 patients is highly variable including congenital and childhood onset cases with the most severe phenotype characterized mainly by cognitive impairment, the adult-onset where the core features are facial weakness, myotonia and distal muscle weak-ness, and the late-onset or oligosymptomatic patients where only limit-ed features are found[1].
The disease is caused by an expansion of repetitive CTG sequences in the 3′ untranslated region of DMPK gene on chromosome 19q13.3[2,3]. Unaffected individuals have 5–37 CTG repeats, whereas DM1 patients Abbreviations: MIRS, muscular impairment rating scale; CTG, cytosine–thymine–
guanine; DM1, myotonic dystrophy type 1; cDM1, congenital myotonic dystrophy type 1; DMPK, Dystrophia myotonica protein kinase gene; SIX5, SIX Homeobox 5 gene; CUG-BP1, CUG RNA-binding protein; MBNL-1, muscleblind-like (Drosophila) 1 protein; MS-HRM, methylation sensitive high resolution melting; CpG, cytosine-guanine; CTCF, CCCTC-binding factor.
⁎ Corresponding author at: Department of Geriatrics, Neuroscience and Orthopedics, Center for Neuromuscular Disorders, Catholic University of Sacred Heart, L.go F. Vito, 1, Rome, Italy.
E-mail addresses:[email protected](M. Santoro),[email protected]
(L. Fontana),[email protected](M. Masciullo),[email protected]
(M.L.E. Bianchi),[email protected](S. Rossi),[email protected]
(E. Leoncini),[email protected](G. Novelli),[email protected](A. Botta),
[email protected](G. Silvestri).
1
These authors contributed equally to this work.
http://dx.doi.org/10.1016/j.bbadis.2015.09.007
0925-4439/© 2015 Elsevier B.V. All rights reserved.
Contents lists available atScienceDirect
Biochimica et Biophysica Acta
j o u r n a l h o m e p a g e : w w w . e l s e v i e r . c o m / l o c a t e / b b a d i shave 50 to several thousand CTG repeats, with a variable degree of so-matic mosaicism in tissues[1]. The present consensus is that expanded non-coding CTG tract is transcribed, and the expression of long CUG se-quences in the mutant DMPK transcripts contribute to DM1 pathology through a RNA gain of function mechanism[4]. The DMPK expanded transcript accumulates in the nucleus in ribonuclear foci and interferes with RNA-binding proteins, leading to decreased functional levels of muscleblind-like proteins (MBNLs)[5–8]which are sequestered in the foci, and also increasing the steady-state levels of CELF1 (CUGBP1 and ETR-3-like factor)[9]. The main consequence of this toxic RNA function in DM1 tissues is a widespread splicing mysregulation of multiple genes (“spliceopathy”) in which embryonic isoforms are expressed in adult muscle, heart and brain with potential serious and life-threatening manifestations[10].
In addition to“spliceopathy,” RNA toxicity in DM1 may trigger dif-ferent pathogenic mechanisms including dysregulation of transcription and microRNA metabolism, defects in protein translation/turnover and activation of cellular stress and apoptotic pathways[11–14].
A role for epigenetic alterations in DM1 has also been proposed, ei-ther as a mechanism to explain intergenerational or somatic repeat in-stability or as an explanation for the altered expression of the DMPK transcript itself and of adjacent genes[15].
The DM1 CTG repeat lies in a gene-enriched region of chromosome 19 and is embedded in a large 5.5 kb CpG island contiguous with the promoter region of the downstream SIX5 gene[16,17].
The CTG repeat itself is surrounded by two binding sites for the chro-matin insulator CTCF, a multifunctional zincfinger protein that binds to DNA influencing gene expression, nucleosome positioning and chroma-tin packaging[18]. Additional complexity arises with production of an an-tisense transcript that initiates within the SIX5 promoter and extends back through the DM1 repeat, producing a CAG-containing RNA able to induce transcriptional silencing (RITS) and heterochromatin formation
[18]. Thus, large CTG expansions and their accompanying chromatin changes can potentially trigger three alternative pathogenic pathways: decreased gene expression due to RITS, loss of CTCF binding and aberrant transcription around CTG repeat, transcription of long CAG-containing RNA that may be toxic independently of DMPK expression[18].
About epigenetic methylation of DM1 locus, available data are very limited and controversial.
By methylation-sensitive restriction analysis, an early study on leu-kocytes DNA of DM1 patients, including both congenital, adult-onset forms and controls, showed that the SacII site at the DMPK locus located over 1 kb upstream of the CTG repeat results constitutively methylated, without evidence of genomic imprinting or hypermethylation for DM1 alleles[19].
In contrast, later studies documented hypermethylation of expand-ed DM1 alleles in correspondence of several CpG sites upstream of the CTG repeat but not involving the methylation sensitive CTCF binding site[20,21]. These studies obtained conflicting results concerning corre-lations between the methylation status of DM1 allele in leukocytes and age at onset, disease severity or n(CTG)[19–21]. More recently, López Castel et al.,[22]assessed methylation, using a more sensitive bisulphite sequencing PCR, not in leukocytes but in fetal and adult DM1 autoptic tissue samples as well in tissues of a DM1 transgenic mouse[22]. Using this approach, tissue-, age- and DNA region specific variations in CpG methylation of the expanded alleles were specifically observed in DM1 tissues, polarized in the region upstream to the CTG expanded tract. This study suggested that hypermethylation would be age depen-dent, being higher in fetal vs adult tissues, and also documented inter and intra-individual variability in methylation levels not obviously re-lated to the size of n(CTG) present in tissues. On the other hand, expres-sion of DMPK and of adjacent genes in correlation to methylation status was not assessed in this study[22].
The CTG repeat at DMPK locus is usually uninterrupted in both healthy and expanded alleles, however so called“variant” repeats containing un-stable CCG, CTC and CGG sequence interruptions at the 3′-end of the CTG
array can be detected in a low percentage (3–5% of cases) of DM1 patients
[23–26]. The presence of interruptions within an otherwise homogeneous tract of repeats has been associated with a number of TREDs including FRAXA[27], SCA1[28], SCA2[29]and FRDA[30,31]. In general, repeat in-terruptions lead to a stabilizing effect because of their ability to disrupt the formation of unusual DNA structures formed by“pure” repetitive se-quences[32]. No data are available regarding their in cis effects on the epi-genetic changes occurring at the DM1 locus. Based on these premises, we designed this study in order to 1) assess the methylation status upstream and downstream of the unstable CTG tract at DM1 locus, encompassing CTCF binding sites, in leukocytes DNA obtained from the largest cohort of DM1 patients reported so far, including both uninterrupted and variant expansions (n = 66) in comparison to age-matched controls (n = 30), 2) verify if any association exists between methylation status at DM1 locus in leukocytes and specific clinical and molecular disease features, and 3) evaluate the effects of methylation on DMPK and SIX5 gene expres-sion in leukocytes.
We used methylation sensitive-high resolution melting (MS-HRM) technique, a novel approach that allows semi-quantitative assessment of methylation levels in a locus-specific manner comparing the melting profiles between methylated and unmethylated DNA.
2. Materials and methods 2.1. Patients
Genetically confirmed DM1 patients were selected from the large collection studied primarily for diagnostic purposes at Catholic and Tor Vergata Universities (Rome, Italy) over the years.
This cohort includes 66 DM1 patients (age 38.6 ± 12.5 years), and 30 age-matched healthy controls (age 40.3 ± 13.8 years). The study design fulfilled the guidelines of the Ethical Boards of our Institutions. 2.2. DNA extraction
Genomic DNA was extracted from peripheral blood leukocytes using “salting-out” modified method[33]. 10 ml of anti-coagulated blood (EDTA) were resuspended in 50 ml polypropylene centrifugation tubes with 40 ml of lysis buffer (0.32 M sucrose, 10 mM Tris, 5 mM MgCl2and 1% TritonX). After centrifugation (4 °C) at 5000 rpm for
30 min, the pellet was digested overnight at 37 °C with Kern solution (10 mM Tris–HCl, 400 mM NaCl and 2 mM EDTA) 0.2 ml of 10% SDS and 0.5 ml of a protease K solution (1 mg protease K in 1% SDS and 2 mM Na2EDTA). After digestion was complete, 1 ml of saturated NaCl
(approximately 6 M) was added to each tube and shaken vigorously for 15 s, followed by centrifugation (4 °C) at 7000 rpm for 30 min. The precipitated protein pellet was left at the bottom of the tube and the su-pernatant containing the DNA was transferred to another 15 ml poly-propylene tube. Exactly 2 volumes of room temperature absolute ethanol was added and the tubes inverted several times until the DNA precipitated.
The precipitated DNA strands were removed with a plastic spatula or pipette and transferred to a 1.5 ml microcentrifuge tube containing 100–200 μl TE buffer (10 mM Tris–HCl, 0.2 mM Na2EDTA, pH 7.5). The
DNA was allowed to dissolve 2 h at 37 °C before quantitating. The genomic DNA was quantified by the Qubit® 2.0 Fluorometer (Invitrogen, Carlsbad, CA, USA) according to the manufacturer's instructions.
2.3. Bisulphite conversion
Bisulphite treatment of DNA converts all unmethylated cytosines to uracil, leaving methylated cytosines unaltered. Genomic DNA (2μg in 20 μl) was treated with EZ DNA Methylation-Gold Kit (Zymo Research, Irvine, CA, USA) according to the manufacturer's instructions.
After bisulphite conversion, the genomic DNA was quantified by the Qubit® 2.0 Fluorometer (Invitrogen, Carlsbad, CA, USA) according to the manufacturer's instructions.
2.4. Methylation sensitive high resolution melting (MS-HRM)
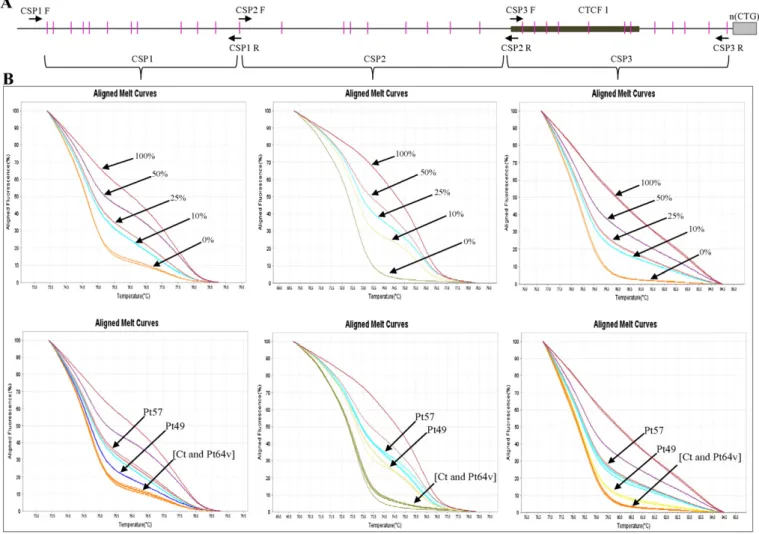
High resolution melting technology is based on the comparison of the melting profiles of sequences that differ in base nucleotide compo-sition. The PCR product originating from the methylated allele will have different GC content from PCR product derived from unmethylated variant of the same locus[34]. The DMPK gene region studied is detailed inFig. 1A.
In order to reduce the complexity of the melting profile and to max-imize the melting temperature (Tm) difference between methylated and unmethylated allele, we amplified sequence around 70–60 bp di-viding the upstream region of CTG array into three amplicons indicated as CSP1(11 CpG sites), CSP2 (8 CpG sites) and CSP3 (11 CpG sites) (Fig. 1A) and the downstream region into two amplicons indicated as CSP4 (8 CpG sites) and CSP5 (5 CpG sites) (Fig. 2A).
Primers for bisulphite-modified DNA were designed using Methyl Primer Express Software v1.0 (Applied Biosystems, Foster City, CA, USA) (Supplementary Table S1). The standard curve to quantify methyl-ation percentages were established at 0%, 10%, 25%, 50%, and 100%
methylation using the EpiTect PCR Control DNA kit (Qiagen, Germany). The standard curve with known methylation ratio was included in each run. MS-HRM was performed using StepOnePlus thermocycler (Applied Biosystems, Foster City, CA, USA). The reaction mix (total volume of 20μl), contained 20 nanograms (ng) of bisulphite-treated DNA, 0.5 μM of either forward/reverse primers and 1× of MeltDoctor HRM Master Mix (Applied Biosystems, Foster City, CA, USA). Thermal cycling consisted of enzyme activation of 10 min at 95 °C, followed by 40 cycles of each PCR step: (denaturation) 95 °C for 15 s and (annealing/extension) 60 °C for 1 min. Finally, melt curve/dissociation: denaturation at 95 °C for 10 s, an-nealing at 60 °C for 1 min, high resolution melting at 95 °C for 15 s and annealing at 60 °C for 1 min.
To obtain the methylation percentage of each sample, DNA melting curves were analyzed using high resolution melting software 3.1 (Ap-plied Biosystems, Foster City, CA, USA) that compare the melting profile of each samples with standard curve. Each sample was assessed in triplicate.
2.5. CpG methylation analysis by SacII, HpaII and HhaI restriction enzymes In order to discriminate the presence of methylation from the non-expanded DM1 alleles (upstream and downstream of CTG array), we performed on methylated DM1 samples (detected by HRM) a PCR
Fig. 1. Methylation analysis of the region upstream of the CTG repeat at the DMPK locus by HRM. A) Genomic structure upstream of the CTG repeat. The CpG islands are pictured as pink bars, CTCF1 binding site as black box, CTG repeat region as gray box and intronic sequences as thick black line. The PCR primers used in this study are indicated as arrows. DNA bisulphite treated from leukocytes of DM1 patients was amplified using CSP1F/CSP1R for CSP1(11 CpG sites) tract, CSP2F/CSP2R for CSP2 (8 CpG sites) tract and CSP3F/CSP3R for CSP3 (11 CpG sites) tract. B) Up-panel, aligned melt curve profiles of standard templates (0%, 25%, 50% and 100%); lower panel aligned melt curve profiles of representative sample of DM1 patients studied [Pt49 (adult onset DM1 with uninterrupted CTG expansions), Pt57 (congenital DM1 with uninterrupted CTG expansions), Pt64v (DM1 with variant CTG expansions carrying CCG inter-ruptions at 3′-end of the CTG array) and a healthy control]. The corresponding melting profiles are indicated by arrows. HRM documented hypermethylation of expanded alleles at the region upstream of the CTG repeat in cDM1 and DM1 patients with large expansion; no methylation of this region was detected in the DM1 patient with variant expansions (Pt64v) and in the control.
amplification combined with restriction enzymes methylation sensitive digestion (SacII, HpaII and HhaI). Upstream region of the CTG repeat: 50 ng of genomic DNA were amplified in a reaction volume of 20 μl, using 2.5 units of MyTaq DNA polymerase (Bioline, USA), 5× MyTaq re-action buffer (Bioline, USA), 20 mM of each primers forward (SDM-F) 5′ GCTCCAGTCCTGTGATCCGGG-3′ and reverse MDYZ2A[35].
Cycling conditions were: 2 min/95 °C, initial denaturation; 15 s/95 °C, 30 s/65 °C, 30 s/72 °C for 30 cycles; 10 min/72 °C,final extension. The PCR products were digest with 3 units of SacII (unique site 42 bases upstream of the CTG repeat) for 2 h at 37 °C. Downstream region of the CTG repeat: we performed the same PCR amplification protocol but using MDY1D and MDYZ2A primers[35]. The PCR products were digest with 3 units of each HpaII/HhaI (in the downstream region of the CTG repeat are present two HpaII sites and one HhaI site) restriction enzymes in double digestion. All PCR products were run in 2% agarose-gel electrophoresis.
2.6. Quantitative Real-Time PCR (qRT-PCR)
We performed a standard qRT-PCR analysis to determine relative mRNA transcript levels of DMPK and SIX5 in a representative sample of DM1 patients (Pt1, Pt17, Pt22, Pt28, Pt32, Pt52, Pt53, Pt56, Pt62 and Pt64) and seven healthy controls after informed consent.
Total RNA was extracted from peripheral blood leukocytes using TRIzol reagent (Invitrogen, Carlsbad, CA, USA), according to the manufacturer's instructions. First strand cDNA was synthesized using
1 μg of total RNA DNase I treated, 100 ng oligo(dt)12–18 primer
(Invitrogen), 0.5 mM dNTPs and 200 units SuperScript II reverse tran-scriptase (Invitrogen) at 42 °C for 1 h.
qRT-PCR was performed using TaqMan Universal Master Mix II (Applied Biosystems) and TaqMan probe assays for DMPK (Hs00189385_m1, Applied Biosystems), for SIX5 (Hs01650774_m1, Ap-plied Biosystems) andβ-actin (Hs99999903_m1, Applied Biosystems). Thermal cycling conditions on StepOnePlus thermocycler (Applied Biosystems) consisted of holding stage at 50 °C for 2 min and 95 °C for 10 min followed by 40 cycles of each PCR step: (denaturation) 95 °C for 15 s and (annealing/extension) 60 °C for 1 min.
The relative fold-change 2−ΔΔCTmethod was used to determine the relative quantitative gene expression compared withβ-actin as endog-enous control. All PCR reactions were performed in triplicate and a neg-ative control was included that contained primers without cDNA. Data were expressed as the mean ± standard error (SE).
2.7. Statistical analysis
A descriptive analysis was conducted to show the characteristics of the DM1 patients at the time of diagnosis. For statistical analysis, we di-vided our DM1 cohort into methylated patients, when subjects had 5% methylation or more in at least one of the 5 amplicons studied in the CTG array, and unmethylated patients, if the subjects had no methylation Fig. 2. Methylation analysis of the region downstream of the CTG repeat at the DMPK locus by HRM. A) Genomic structure downstream of the CTG repeat. The CpG islands are pictured as pink bars, CTCF2 binding site as black box, CTG repeat region as gray box and intronic sequences as thick black line. The PCR primers used in this study are indicated as arrows. DNA bisulphite treated from leukocytes of DM1 patients was amplified using CSP4F/CSP4R for CSP4 (8 CpG sites) tract, CSP5F/CSP5R for CSP5 (5 CpG sites) tract. B) Up-panel, aligned melt curve profiles of standard templates (0%, 25%, 50% and 100%); lower panel aligned melt curve profiles of representative sample of DM1 patients (Pt49, Pt57, Pt64v) and a healthy control. The corresponding melting profiles are indicated by arrows. In the downstream region (CSP4, CSP5) HRM documented hypermethylation of expanded alleles only in the DM1 patient with variant expansions (Pt64v), whereas no methylation of this region was detected in DM1 and cDM1 patients with uninterrupted CTG expansions as well as in the control.
at all. For disease onset we arbitrarily divided DM1 patients into two groups (onset≤18 or N18 years).
Chi-square and Fisher's exact tests were used to compare the distribu-tions of numerical (age, lower value of nCTG range detected in leukocytes, MIRS) or categorical variables (gender, disease onset, transmission of the mutation) between methylated and unmethylated patients respectively; p values ofb0.05 were considered to indicate significant differences.
We then performed a logistic regression analysis to assess the effect of selected covariates (gender, disease onset, transmission of the mutation, nCTG, MIRS) on methylation status. Final adjusted odds ratio (AORs) were adjusted for disease onset and transmission of the mutation.
Statistical analysis was performed using Stata software (StataCorp. 2013. Stata Statistical Software: Release 13. College Sta-tion, TX: StataCorp LP).
3. Results
3.1. CpG methylation in DM1 patients with pure CTG expansions Methylation analysis was focused upon regions immediately flanking unstable CTG tract: these include 30 CpG sites upstream and 13 CpG sites downstream from the CTG repeat, respectively (Figs. 1A and2A). The standard melting curves obtained for different ratios of methylated-to-unmethylated templates (0%, 10%, 25%, 50% and 100%) are shown (Figs. 1B and2B, upper panels). The aligned melt curve pro-files of standard methylated genomic DNA and of representative DM1 and control samples are also displayed (Figs. 1B and2B, lower panels). In agreement with previous data[19–22], we found that in controls DMPK locus is invariably unmethylated, either upstream and down-stream of the CTG array (data not shown).
In DM1 patients carrying uninterrupted CTG expansions we also found hypermethylation (15%–50%) involving the upstream region of the CTG repeat in particular hypermethylation was found in all congen-ital, in six out of thirteen childhood onset and in only six out of thirty-seven adult-onset DM1 patients (Fig. 1B;Table 1).
Methylated DM1 patients harbored larger CTG expansions than unmethylated ones (pb 0.001). Hypermethylation was also significant-ly associated with onset of symptoms≤18 years (p b 0.001), and mater-nal origin of the expanded allele (pb 0.001). In contrast, neither disease
severity measured by MIRS nor patients' age showed a significant asso-ciation with methylation status of DM1 locus.
The AORs (95% CI) were 9.42 (1.66–53.44) and 21.91 (3.16–151.76) for disease onset and transmission of the mutation, respectively (Table 2).
3.2. CpG methylation in DM1 patients with variant expansions
In order to investigate if the presence of the CCG, CTC and CGG se-quence interruptions in the 3′-end of the CTG array might lead to mod-ifications in the levels and/or pattern of methylation, we performed MS-HRM on nine DM1 patients with variant repeats previously diagnosed in our laboratories[26](Table 3). Six of them also showed high methyla-tion levels (range 15%–50%) that, however, did not involve the CpG is-land at the 5′ end of the repeat, as observed in “uninterrupted” DM1 patients, but only the region downstream of the CTG array (Fig. 2B;
Table 3). Interestingly, these patients had a number of CGG interrup-tions along the CTG array more abundant compared to variant unmethylated patients (Table 3).
3.3. CpG methylation is limited to the DMPK expanded allele
To test whether the methylation detected by MS-HRM in DM1 sam-ples was specific to the disease allele, we digested PCR products using methylation-sensitive enzymes SacII, HpaII and HhaI.
We amplified the region of interest in our methylated DM1 samples using SDM-F (forward) and MDYZ2A (reverse) primers annealing on the opposite sides of the CTG repeat and capable of amplifying only the non-expanded DMPK allele by short-PCR conditions[35](Fig. 3A, upper panel). These two primers amplify a PCR fragment from the non-expanded allele (397 bp) which includes a SacII site, located 42 bp upstream of the CTG tract (Fig. 3A, upper panel).
SacII digestion, indeed produced two PCR bands of 335 bp and 62 bp (Fig. 3A, lower panel), being indicator of a non-methylated template. In variant DM1 patients, we used MDY1D (forward) and MDYZ2A (re-verse) primers[35], by short-PCR conditions to amplify the region of a 303 bp fragment that contain two HpaII and one HhaI sites downstream of the CTG tract only from wild-type alleles (Fig. 3B, upper panel). Dou-ble digestion of PCR products with HpaII/HhaI raised four fragments of 150 bp, 110 bp, 23 bp and 20 bp indicating that amplified fragment from the wild-type allele is not methylated also in these patients (Fig. 3B, lower panel). We conclude that the high levels of CpG methyl-ation detected by MS-HRM depend exclusively from expanded alleles. Table 1
Sociodemographic characteristics of 57 DM1 patients by methylation status. Methylated group (n = 19) Unmethylated group (n = 38) p value n % n % Gender Women 7 36.8% 17 44.7% 0.569 Men 12 63.2% 21 55.3%
Age at initial symptoms
Adult 6 31.6% 31 81.6% b0.001 Child 6 31.6% 7 18.4% Congenital 7 36.8% 0 0.0% Mutation Paternal 2 11.8% 21 67.7% b0.001 Maternal 15 88.2% 10 32.3% nCTG b1000 6 31.6% 38 100.0% b0.001 ≥1000 13 68.4% 0 0.0% MIRS 1 1 5.3% 2 5.3% 0.254 2 1 5.3% 7 18.4% 3 10 52.6% 18 47.4% 4 5 26.3% 11 28.9% 5 2 10.5% 0 0.0%
MIRS = Muscular Impairment Rating Scale[36].
Table 2
Univariate and multivariate analysis of selected variables and methylation status of DM1 patients.
Univariate analysis Multivariate analysis
OR CI 95% OR# CI 95%
Gender
Women Ref Ref
Men 1.39 0.45–3.30 0.70 0.13–3.89 Disease onset
Adult Ref Ref
Child 9.59 2.70–34.11 9.42 1.66–53.44 Mutation
Paternal Ref Ref
Maternal 15.75 3.00–82.54 21.91 3.16–151.76 nCTG b1000 Ref Ref ≥1000 nc§ nc§ MIRS 1.55 0.79–3.05 1.26 0.45–3.53 OR, odds ratio; CI, confidence interval; MIRS = Muscular Impairment Rating Scale[36].
#
Odds ratio adjusted for disease onset, and mutation.
§
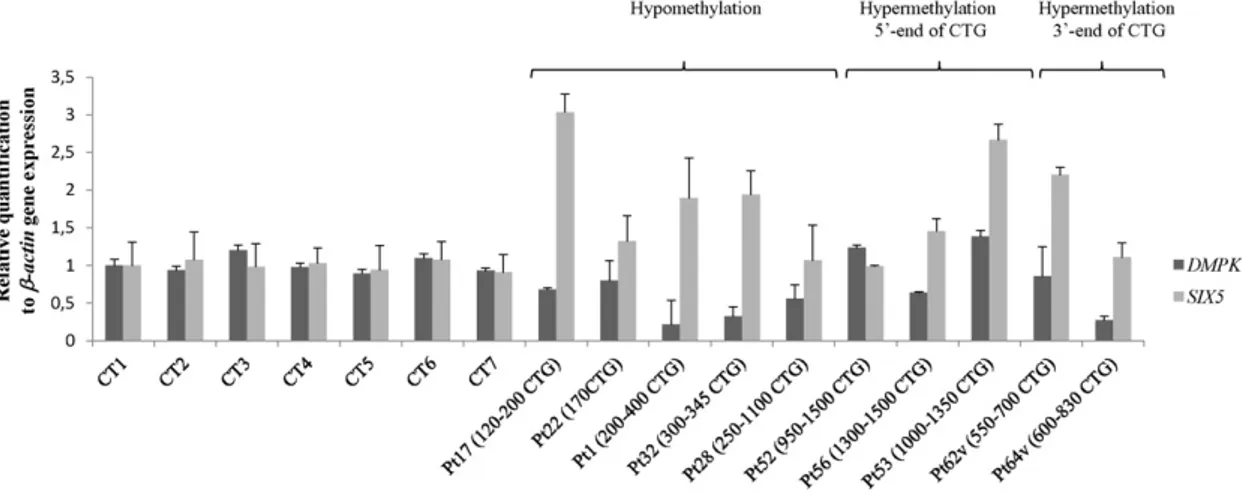
3.4. qReal-Time PCR analysis of DMPK and SIX5 genes expression Three out offive unmethylated DM1 patients (Pt17, Pt1 and Pt32) showed a 2–3 fold increase in the expression levels of SIX5 compared to controls, while in the other two (Pt22 and Pt28) the levels were nor-mal (Fig. 4). A 50% reduction in DMPK RNA levels was found in three pa-tients (Pt1, Pt28 and Pt32) compared with controls, while in the other two patients (Pt17 and Pt22) DMPK RNA levels were normal (Fig. 4).
Two cDM1 patients with hypermethylation at the 5′-end of the CTG array (Pt52 and Pt56) showed expression levels of SIX5 and DMPK com-parable to controls, while in one of them (Pt53) SIX5 RNA levels were 2-fold higher (Fig. 4).
Of the two variant DM1 patients studied, one (Pt62v) showed higher levels of SIX5, whereas the other (Pt64v) showed a reduction in the ex-pression levels of DMPK compared to controls (Fig. 4).
T-Student's test documented a significant difference in the ex-pression of both DMPK (p = 0.03) and SIX5 (p = 0.006) in all DM1 patients vs controls, however the expression of the two genes did
not correlate with the CpG methylation levels of the CTG array. (DMPK p = 0.1; SIX5 p = 0.4).
4. Discussion
The role and the pathogenic consequences of epigenetic modi fica-tions associated with pathological expansion of the CTG array at DM1 locus are still poorly understood. In order to clarify this issue, in this work we assessed the CpG methylation profile of the regions upstream and downstream of the CTG expanded tract in a well characterized co-hort of 66 DM1 patients, being the largest reported so far and including also DM1 patients carrying variant expansions with CCG/CTC/CGG in-terruptions at the 3′-end of the expanded CTG array.
Differently from previous studies[19–22]that used methylation-sensitive restriction analysis to assess methylation at the 5′ side of DM1 locus, we used MS-HRM which allowed us to accurately estimate the percentage of methylation in the region of interest, including also those CpG sites not detected by MS-restriction analysis. MS-HRM Table 3
DM1 patients with interruptions in the primary structure of the 3′-end of the CTG array and methylation status. Patient
(Pt)
n(CTG) Age of examination (years)
Disease onset MIRS Parental origin of mutation
CSP4 (%)
CSP5 (%)
Sequence of the interruptions
Pt58 118 37 Adult 3 Maternal 0% 0% (CTG)32CCG(CTG)2CCG(CTG)6(CCG)2(CTG)2CCG(CTG)5CCG(CTG)25(CTG)31 (CCG)2(CTG)2CCG(CTG)22CCG(CTG)34(CCG)2(CTG)2CCGCTC(CTG)4 Pt59 400–580 61 Adult 3 Paternal 25–50% 0% (CCGCTG)7TCGCTG(CCGCTG)7(CTG)20 Pt60 450–550 24 Asymptomatic 1 Maternal 25–50% 10–25% (CTG)16CCG (CTG)2(CCGCTG)4CTG[(CCGCTG)4CCG]2(CCGCTG)5(CTG)22 Pt61 475–640 33 Adult 2 Paternal 0% 0% (CTG)2G (CTG)9G (CTG)20(CTG)23TTG(CTG)4 Pt62 550–700 65 Adult 3 Paternal 25–50% 10–25% (CTG)5(CCGCTGCTG)46 Pt63 600–700 35 Adult 2 Paternal 0% 0% (CTG)68CCG(CTG)9 Pt64 600–830 55 Adult 2 Paternal 25–50% 25–50% (CTG)9(CCGCTGCTG)61 Pt65 740–930 51 adult 3 Paternal 10–25% 0% (CCGCTG)2(CCG)2(CTG)3(CCGCTG)3(CTG)7(CCGCTG)18 Pt66 970 32 Child 3 Maternal 25–50% 25–50% (CTG)12CCG (CTG)6CCG(CTG)5CCG(CTG)5
MIRS = Muscular Impairment Rating Scale[36]. CSP4 and CSP5 amplicons are referred to the methylation percentage into downstream region of CTG array.
Fig. 3. Analysis of methylation allele specificity. A and B) Upper panel, genomic structure of the CTG array. The CTG repeat region is presented as black box and intronic sequences as thick black line. The PCR primers are indicated as arrows while the restriction fragments as dashed lines. A) Upstream primer (S-DM F) and downstream primer (MDYZ2A)[35]produced a PCR product (397 bp) from only the non-expanded CTG allele. Following SacII digestion the presence of two bands (335 bp and 62 bp, lower panel) revealed that this site in the non-expanded allele was not methylated in the DM1 and cDM1 patients (Pt49 and Pt57, respectively) which by HRM analysis showed high levels of upstream methylation. B) MDY1D and MDYZ2A primers[35]produced a PCR product of 303 bp. Double digestion with HpaII/HhaI showed four PCR products of 150 bp, 110 bp, 23 bp and 20 bp (lower panel) indicating that this site in the non-expanded allele was not methylated in the DM1 with variant expansions (Pt64v and Pt59v) which by HRM analysis showed high levels of downstream methylation. Thus, the high levels of CpG methylation detected by HRM (upstream and downstream of the CTG array) were exclusively present on the expanded DM1 allele.
technique is based on the comparison of the melting profile of se-quences that differ in base composition[34]. In fact, the PCR product originating from the methylated allele have a different sequence consti-tution (GC content) from the PCR product derived from unmethylated variant of the same locus. As a consequence, both products have distinct melting temperature and melting profiles[34]. This technique allows to obtain detailed information about global methylation (not single CpG islands) levels of the sequence amplified with similar results to those obtained by pyrosequencing[37].
So far, only one study[22]analyzed the sites of CpG methylation up-stream and downup-stream to the CTG repeats by direct sequencing. Al-though this method is probably the most accurate, because it allows analyzing any single CpG islands, it has very high costs especially if it has to be applied to the study of large genomic regions of a broad pop-ulation, like the one reported in this study.
By MS-HRM, we confirmed that DM1 is associated with changes in the methylation levels of the expanded allele[19–22]. For uninterrupted al-leles, we documented that hypermethylation occurs only in the upstream region of the CTG repeat, and this modification was significantly associat-ed with larger nCTG (N1000) and earlier age at onset (b18 years) (Table 2): indeed, we found hypermethylation in all congenital DM1, in about half of childhood onset DM1 patients but only in six out of thirty-seven adult onset DM1 patients (Table 1).
Taken together thesefindings would suggest that methylation might be an early occurring phenomenon in DM1 patients carrying uninter-rupted alleles, possibly driven by the inherited size of the expanded al-lele. In this regard, the association of hypermethylation with congenital or childhood onset forms, both of which share predominant cognitive manifestations, would suggest that this epigenetic modification might affect by still unknown mechanisms, the expression of genes regulating brain development or synaptic plasticity.
Hypermethylation at DM1 locus was significantly associated with ma-ternal transmission of the DM1 mutation. In this regard the exclusively maternal transmission of the congenital forms[1]could have represented a bias, although our cohort of patients included the whole phenotypic spectrum of DM1, and multivariate analysis supports a specific association between methylation and mutation maternally transmitted (Table 2).
Recent literature data supports age-associated global hypomethyla-tion as a hallmark of aging in most somatic tissues, suggesting that DNA methylation can be used to predict the age of an organism based on tis-sue methylation profiles[38]. Consistently, in DM1 methylation levels at the DMPK locus are lower in adult tissues compared with matching tis-sues of fetuses[22].
On the other hand, methylation status shows inter and intra-individual variability not obviously related to the size of n(CTG) in
tissues[22], and this can explain the lack of correlation between meth-ylation levels in leukocytes and age found in our cohort of study.
Our data suggest that not only the size but also the structure of the expanded CTG array would influence methylation status at DMPK locus. In fact, in most variants DM1 patients with CCG/CTC/CGG inter-ruptions, hypermethylation of CpG islands showed an opposite pattern compared to uninterrupted expanded alleles, occurring exclusively at the 3′ end of the CTG array.
Since CAG repeats but not CGG repeats can stall the methyltransfer-ase DNMT1[39], CGG/CTC/CCG repetitions interspersed into the CTG array of the variant DM1 alleles might interfere with insulation against CpG methylation spreading to downstream regions exerted by the pure CTG stretch. Intriguingly hypermethylated variant DM1 showed a num-ber of CGG interruptions along the CTG array more abundant compared to variant unmethylated patients (Table 3). Alternatively, different CCG, CTC and CGG sequence interruptions within the CTG array might in flu-ence the methylation levels of variant expanded DM1 alleles possibly af-fecting their higher DNA structure.
Regarding the putative effects of hypermethylation of DM1 locus, the regions analyzed in this study contains CTCF binding sites which, at other genomic loci, has been shown to serve as a boundary element between highly methylated and unmethylated genomic regions impor-tant for epigenetically regulated processes such as X-inactivation, ge-netic imprinting or gene transcription[40].
The expanded repeat therefore demarcates an upstream bound-ary of methylation which could have a functional involvement in the transcriptional regulation of the entire 19q13.3 region, including SIX5 and the DMPK gene itself. Data about the expression levels of DMPK andflanking genes in DM1 tissues are controversial but in general SIX5 (formerly known as DMHAP) is less affected compared to DMPK[41–44].
In our study, SIX5 was even upregulated and DMPK was reduced in leukocytes of all DM1 patients compared to controls, but these changes were independent from the methylation status of the DM1 allele. How-ever, we cannot exclude that DMPK or SIX5 expression might be specif-ically impaired by higher methylation levels occurring in tissues other than leukocytes.
In conclusion, we demonstrated that inherited n(CTG) size and pres-ence of CCG/CTC/CGG sequpres-ence interruptions in the expanded CTG array are independently associated to hypermethylation at the DMPK locus in DM1. Hypermethylation of large expanded alleles, described in our study, may have a functional significance as modifying factors in the phenotype of patients by modulating local gene expression in dif-ferent tissues[22,45]. The availability of an additional collection of DM1 tissue samples are needed to clarify this important point.
Fig. 4. Real-Time qRT-PCR analysis of SIX5 and DMPK mRNA expression. qRT-PCR to determine relative mRNA transcript levels of SIX5 and DMPK in child/adult onset DM1 patients (Pt1, Pt17, Pt22, Pt28 and Pt32, hypomethylation), cDM1 patients (Pt52, Pt53 and Pt56, hypermethylation at 5′-end of CTG expansion), DM1 with CCG interruptions at the 3′-end of the expanded CTG array (Pt62v and Pt64v, hypermethylation at 3′-end of CTG expansion) and 7 healthy controls. Values were normalized to expression levels of β-actin and were the mean of three experiments ±standard error (SE).
A better understanding of the precise cascade of processes induced by expanded trinucleotide repeats (TNRs) and, importantly, the starting point of these changes, could provide therapeutic targets to alleviate disease progression and limit further TNR expansion.
Supplementary data to this article can be found online athttp://dx. doi.org/10.1016/j.bbadis.2015.09.007.
Transparency Document
TheTransparency documentassociated with this article can be found, in online version.
Conflicts of interest
All the authors deny anyfinancial support and conflict of interest re-garding this research activity.
Acknowledgments
This work was supported by grants from the Italian Ministry of Sci-entific Research (grant number D1-2013), by “Uncovering Excellence 2014” grant from Tor Vergata University of Rome assigned to Botta Annalisa (grant number 5-MDESM-PLAT) and by ASI, CoReA project n. 2013-084-R.0.
References
[1] P.S. Harper, Myotonic Dystrophy, third ed. WB Saunders, London, 2001.
[2] M. Mahadevan, C. Tsilfidis, L. Sabourin, G. Shutler, C. Amemiya, G. Jansen, C. Neville, M. Narang, J. Barcelo´, K. O'Hoy, et al., Myotonic dystrophy mutation: an unstable CTG repeat in the 3′ untranslated region of the gene, Science 255 (1992) 1253–1255.
[3] J.D. Brook, M.E. McCurrach, H.G. Harley, A.J. Buckler, D. Church, H. Aburatani, K. Hunter, V.P. Stanton, J.P. Thirion, T. Hudson, et al., Molecular basis of myotonic dys-trophy: expansion of a trinucleotide (CTG) repeat at the 3′ end of a transcript encoding a protein kinase family member, Cell 68 (1992) 799–808.
[4] A.F. Klein, E. Gasnier, D. Furling, Gain of RNA function in pathological cases: focus on myotonic dystrophy, Biochimie 11 (2011) 2006–2012.
[5] J.W. Miller, C.R. Urbinati, P. Teng-Umnuay, M.G. Stenberg, B.J. Byrne, C.A. Thornton, M.S. Swanson, Recruitment of human muscleblind proteins to (CUG)(n) expansions associ-ated with myotonic dystrophy, EMBO J. 19 (2000) 4439–4448.
[6] M. Pascual, M. Vicente, L. Monferrer, R. Artero, The muscleblind family of proteins: an emerging class of regulators of developmentally programmed alternative splic-ing, Differentiation 74 (2006) 65–80.
[7] A. Mankodi, C.R. Urbinati, Q.P. Yuan, R.T. Moxley, V. Sansone, M. Krym, D. Henderson, M. Schalling, M.S. Swanson, C.A. Thornton, Muscleblind localizes to nu-clear foci of aberrant RNA in myotonic dystrophy types 1 and 2, Hum. Mol. Genet. 10 (2001) 2165–2170.
[8] T.H. Ho, N. Charlet-B, M.G. Poulos, G. Singh, M.S. Swanson, T.A. Cooper, Muscleblind proteins regulate alternative splicing, EMBO J. 23 (2004) 3103–3112.
[9] A.N. Ladd, N. Charlet, T.A. Cooper, The CELF family of RNA binding proteins is impli-cated in cell-specific and developmentally regulated alternative splicing, Mol. Cell. Biol. 21 (2001) 1285–1296.
[10]R.J. Osborne, C. Thornton, RNA-dominant diseases, Hum. Mol. Genet. 15 (2006) 162–169.
[11] E. Loro, F. Rinaldi, A. Malena, E. Masiero, G. Novelli, C. Angelini, V. Romeo, M. Sandri, A. Botta, L. Vergani, Normal myogenesis and increased apoptosis in myotonic dys-trophy type-1 muscle cells, Cell Death Differ. 17 (2010) 1315–1324.
[12]S. Gambardella, F. Rinaldi, S.M. Lepore, A. Viola, E. Loro, C. Angelini, L. Vergani, G. Novelli, A. Botta, Overexpression of microRNA-206 in the skeletal muscle from myo-tonic dystrophy type 1 patients, J. Transl. Med. 8 (2010) 48.
[13]B. Udd, R. Krahe, The myotonic dystrophies: molecular, clinical, and therapeutic challenges, Lancet Neurol. 11 (2012) 891–905.
[14]A. Botta, A. Malena, E. Tibaldi, L. Rocchi, E. Loro, E. Pena, L. Cenci, E. Ambrosi, M.C. Bellocchi, M.A. Pagano, G. Novelli, G. Rossi, H.L. Monaco, E. Gianazza, B. Pantic, V. Romeo, O. Marin, A.M. Brunati, L. Vergani, MBNL142 and MBNL143 gene isoforms, overexpressed in DM1-patient muscle, encode for nuclear proteins interacting with Src family kinases, Cell Death Dis. 4 (2013) e770.
[15]C.E. Pearson, K. Nichol Edamura, J.D. Cleary, Repeat instability: mechanisms of dy-namic mutations, Nat. Rev. Genet. 6 (2005) 729–742.
[16] M. Alwazzan, E. Newman, M.G. Hamshere, J.D. Brook, Myotonic dystrophy is associ-ated with a reduced level of RNA from the DMWD allele adjacent to the expanded repeat, Hum. Mol. Genet. 8 (1999) 1491–1497.
[17]C. Boucher, K. Johnson, Triplet repeats in neuromuscular disorders, Ann. Med. 27 (1995) 3–5.
[18] G.N. Filippova, C.P. Thienes, B.H. Penn, D.H. Cho, Y.J. Hu, J.M. Moore, T.R. Klesert, V.V. Lobanenkov, S.J. Tapscott, CTCF-binding sitesflank CTG/CAG repeats and form a methylation-sensitive insulator at the DM1 locus, Nat. Genet. 28 (2001) 335–343.
[19]D.J. Shaw, S. Chaudhary, S.A. Rundle, S. Crow, J.D. Brook, P.S. Harper, H.G. Harley, A study of DNA methylation in myotonic dystrophy, J. Med. Genet. 30 (1993) 189–192.
[20] P. Steinbach, D. Gläser, W. Vogel, M. Wolf, S. Schwemmle, The DMPK gene of severe-ly affected myotonic dystrophy patients is hypermethylated proximal to the largesevere-ly expanded CTG repeat, Am. J. Hum. Genet. 62 (1998) 278–285.
[21] C. Spits, S. Seneca, P. Hilven, I. Liebaers, K. Sermon, Methylation of the CpG sites in the myotonic dystrophy locus does not correlate with CTG expansion size or with the congenital form of the disease, J. Med. Genet. 47 (2010) 700–703.
[22] A. López Castel, M. Nakamori, S. Tomé, D. Chitayat, G. Gourdon, C.A. Thornton, C.E. Pearson, Expanded CTG repeat demarcates a boundary for abnormal CpG methyla-tion in myotonic dystrophy patient tissues, Hum. Mol. Genet. 20 (2011) 1–15.
[23]Z. Musova, R. Mazanec, A. Krepelova, E. Ehler, J. Vales, R. Jaklova, T. Prochazka, P. Koukal, T. Marikova, J. Kraus, M. Havlovicova, Z. Sedlacek, Highly unstable sequence interruptions of the CTG repeat in the myotonic dystrophy gene, Am. J. Med. Genet. A 149A (2009) 1365–1374.
[24]C. Braida, R.K. Stefanatos, B. Adam, N. Mahajan, H.J. Smeets, F. Niel, C. Goizet, B. Arveiler, M. Koenig, C. Lagier-Tourenne, J.L. Mandel, C.G. Faber, C.E. de Die-Smulders, F. Spaans, D.G. Monckton, Variant CCG and GGC repeats within the CTG expansion dramatically modify mutational dynamics and likely contribute toward unusual symptoms in some myotonic dystrophy type 1 patients, Hum. Mol. Genet. 19 (2010) 1399–1412.
[25] M. Addis, M. Serrenti, C. Meloni, M. Cau, M.A. Melis, Triplet-primed PCR is more sen-sitive than southern blotting-long PCR for the diagnosis of myotonic dystrophy type 1, Genet. Test. Mol. Biomarkers 16 (2012) 1428–1431.
[26] M. Santoro, M. Masciullo, R. Pietrobono, G. Conte, A. Modoni, M.L.E. Bianchi, V. Rizzo, M.G. Pomponi, G. Tasca, G. Neri, G. Silvestri, Molecular, clinical, and muscle studies in myotonic dystrophy type 1 (DM1) associated with novel variant CCG expansions, J. Neurol. 260 (2013) 1245–1257.
[27] E.E. Eichler, J.J. Holden, B.W. Popovich, A.L. Reiss, K. Snow, S.N. Thibodeau, C.S. Richards, P.A. Ward, D.L. Nelson, Length of uninterrupted CGG repeats determines instability in the FMR1 gene, Nat. Genet. 8 (1994) 88–94.
[28] S.S. Chong, A.E. McCall, J. Cota, S.H. Subramony, H.T. Orr, M.R. Hughes, H.Y. Zoghbi, Gametic and somatic tissue-specific heterogeneity of the expanded SCA1 CAG re-peat in spinocerebellar ataxia type 1, Nat. Genet. 10 (1995) 344–350.
[29] S. Choudhry, M. Mukerji, A.K. Srivastava, S. Jain, S.K. Brahmachari, CAG repeat insta-bility at SCA2 locus: anchoring CAA interruptions and linked single nucleotide poly-morphisms, Hum. Mol. Genet. 10 (2001) 2437–2446.
[30]M. Cossée, M. Schmitt, V. Campuzano, L. Reutenauer, C. Moutou, J.L. Mandel, M. Koenig, Evolution of the Friedreich's ataxia trinucleotide repeat expansion: founder effect and permutations, Proc. Natl. Acad. Sci. U. S. A. 94 (1997) 7452–7457.
[31]L. Montermini, E. Andermann, M. Labuda, A. Richter, M. Pandolfo, F. Cavalcanti, L. Pianese, L. Iodice, G. Farina, A. Monticelli, M. Turano, A. Filla, G. De Michele, S. Cocozza, The Friedreich ataxia GAA triplet repeat: premutation and normal alleles, Hum. Mol. Genet. 6 (1997) 1261–1266.
[32]C.E. Pearson, E.E. Eichler, D. Lorenzetti, S.F. Kramer, H.Y. Zoghbi, D.L. Nelson, R.R. Sinden, Interruptions in the triplet repeats of SCA1 and FRAXA reduce the propen-sity and complexity of slipped strand DNA (S DNA) formation, Biochemistry 37 (1998) 2701–2708.
[33]S.A. Miller, D.D. Dykes, H.F. Polesky, A simple salting out procedure for extracting DNA from human nucleated cells, Nucleic Acids Res. 16 (1988) 1215.
[34] T.K. Wojdacz, A. Dobrovic, L.L. Hansen, Methylation-sensitive high-resolution melt-ing, Nat. Protoc. 3 (2008) 1903–1908.
[35] M. Gennarelli, M. Pavoni, P. Amicucci, G. Novelli, B. Dallapiccola, A single polymerase chain reaction-based protocol for detecting normal and expanded alleles in myoton-ic dystrophy, Diagn. Mol. Pathol. 7 (1998) 135–137.
[36] J. Mathieu, H. Boivin, D. Meunier, M. Gaudreault, P. Bégin, Assessment of a disease-specific muscular impairment rating scale in myotonic dystrophy, Neurology 56 (2001) 336–340.
[37] F. Migheli, A. Stoccoro, F. Coppedè, W.A. Wan Omar, A. Failli, R. Consolini, M. Seccia, R. Spisni, P. Miccoli, J.C. Mathers, L. Migliore, Comparison study of MS-HRM and py-rosequencing techniques for quantification of APC and CDKN2A gene methylation, PLoS One 8 (2013) e52501.
[38]M.J. Jones, S.J. Goodman, M.S. Kobor, DNA methylation and healthy human aging, Aging Cell (2015 Apr 25) ([Epub ahead of print]).
[39] A. Bacolla, S. Pradhan, R.J. Roberts, R.D. Wells, Recombinant human DNA (cytosine-5) methyltransferase. II. Steady-state kinetics reveal allosteric activation by methyl-ated DNA, J. Biol. Chem. 274 (1999) 33011–33019.
[40]G.N. Filippova, Genetics and epigenetics of the multifunctional protein CTCF, Curr. Top. Dev. Biol. 80 (2008) 337–360.
[41] M.G. Hamshere, E.E. Newman, M. Alwazzan, B.S. Athwal, J.D. Brook, Transcriptional abnormality in myotonic dystrophy affects DMPK but not neighbouring genes, Proc. Natl. Acad. Sci. U. S. A. 94 (1997) 7394–7399.
[42]C.A. Thornton, J.P. Wymer, Z. Simmons, C. McClain, R.T. Moxley, Expansion of the myotonic dystrophy CTG repeat reduces expression of theflanking DMAHP gene, Nat. Genet. 16 (1997) 407–409.
[43] T.R. Klesert, A.D. Otten, T.D. Bird, S.J. Tapscott, Trinucleotide repeat expansion at the myotonic dystrophy locus reduces expression of DMAHP, Nat. Genet. 16 (1997) 402–406.
[44] M. Eriksson, T. Ansved, L. Edström, M. Anvret, N. Carey, Simultaneous analysis of ex-pression of the three myotonic dystrophy locus genes in adult skeletal muscle sam-ples: the CTG expansion correlates inversely with DMPK and 59 expression levels, but not DMAHP levels, Hum. Mol. Genet. 8 (1999) 1053–1060.
[45] J.R. Brouwer, A. Huguet, A. Nicole, A. Munnich, G. Gourdon, Transcriptionally repres-sive chromatin remodelling and CpG methylation in the presence of expanded CTG-repeats at the DM1 locus, J. Nucleic Acids 2013 (2013) 567435.