Università di Pisa
DIPARTIMENTO DI RICERCA TRASLAZIONALE E DELLE NUOVE
TECNOLOGIE IN MEDICINA E CHIRURGIA
Scuola di Specializzazione in Radiodiagnostica
Direttore: Prof Carlo Bartolozzi
Tesi di specializzazione
The diagnostic accuracy of MDCT in evaluating T and
N parameters in preoperative non-cardial gastric cancer
Il Relatore
Chiar.mo Prof. Carlo Bartolozzi
La Candidata
Abstract
Abstract
Abstract
Abstract
Purpose. Purpose. Purpose.Purpose. The aim of this study was to evaluate diagnostic accuracy of currently used MDCT criteria in the tumor and nodal staging of non-cardial gastric cancer and to identify more accurate criteria, especially in order to reach a better accuracy in the nodal staging, comparing MDCT evaluation with pathological results.
Materials and methods. Materials and methods. Materials and methods.
Materials and methods. Nineteen patients with non-cardial gastric cancer underwent to MDCT for staging in our department and then to surgery within the next 7 to 72 days (average 20 days). Only patients with an optimal gastric distension at the MDCT and who did not take neoadjuvant therapy were considered. The gold standard was the pathological evaluation. MDCT was performed using a 64-detector row CT scanner; images were obtained before and after the intravenous administration of non-ionic contrast material, exactly in the arterial and venous phases; if necessary, a later phase and/or an acquisition in lateral or prone position were made. T and N-staging were blinded evaluated according to currently used CT criteria; subsequently another not blinded N-staging evaluation was made, in order to identify new criteria to improve staging diagnostic accuracy.
Results. Results. Results.
Results. Tumor volume significantly correlates with pT and maximum tumor thickness with pT2 and pT3; none of these variable have shown a relation with pN. T-staging overall diagnostic accuracy ranges from 0.62 and 0.89 and was comparable between a series of imaging of 2.5mm slice thickness/2.5mm reconstruction interval and a series of 2.5mm slice thickness/1.25mm reconstruction interval.
According to different evaluation systems applied, N-staging accuracy ranges between 0.68 and 0.84, sensitivity between 0.69 and 0.93, specificity between 0.50 and 0.67, PPV between 0.79 and 0.82, NPV between 0.50 and 1.
Conclusions. Conclusions. Conclusions.
Conclusions. MDCT has a good diagnostic accuracy in T and N-staging of non-cardial gastric cancer that can be improved using volumetric MDCT acquisition with isotropic or near-isotropic voxel and subsequent Multiplanar Reformation (MPR).
Introduction
Introduction
Introduction
Introduction
Gastric cancer is the sixth most common cancer and the fourth cancer-related cause of death over the world, being most frequent in the eastern countries and in men. In 2012 the incidence was 12,1/100,000 worldwide and 8,2/100,000 in Italy, with a mortality rate of 8,9/100,000 worldwide and 5,6/100,000 in Italy1. Known main risk factors are Helicobacter pylori infection, smoking, salt, heavy alcohol consumption, red meat and fat diet, while fresh fruits, vegetables, selenium and vitamin C seem to be protective factors2. The wide regional variation in incidence can reflect differences in environmental, infective, smoking and dietary risk factors3.
About 10% of gastric carcinomas show familiar cluster but only 1-3% have an inherited genetic predisposition4.
According to the 7th edition of the TNM classification by American Joint Committee on Cancer (AJCC), we considered as gastric cancer only tumors whose epicentre is at least 5cm distal to the gastroesophageal junction (GEJ) or within 5cm of GEJ but does not extend into GEJ4. Though a retrospective study shows that the cardiac carcinoma involving GEJ or distal esophagus in the Chinese population is more accurately staged in order to prognosis if considered as stomach in origin rather than esophageal4, neoplastic involvement of gastric cardia, GEJ or distal esophagus may cause metastasis not only in perigastric and extraperigastric but also in mediastinal lymph nodes.
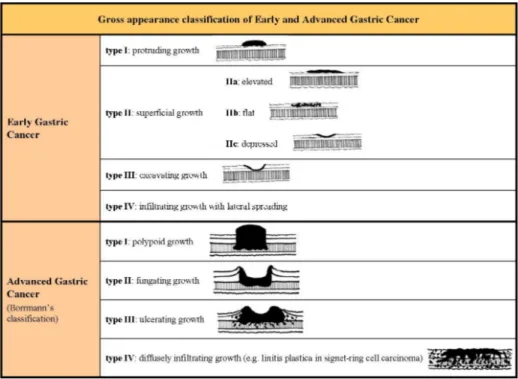
The gastric cancer is usually divided into two subclasses: the Early Gastric Cancer (EGC) and the Advanced Gastric Cancer (AGC). The EGC is defined as invasive gastric cancer confined to mucosa or submucosa (respectively T1a and T1b in the new Tumor Node Metastasis -TNM- classification5) irrespective of the presence of lymph node metastasis and tumor size4, while the AGC is defined as invasive gastric cancer invading at least muscolaris. EGC and AGC are also classified based on their gross appearance (fig 1).
subtypes, plus the indeterminate type as uncommon variant4. The 2010 WHO classification recognized four major histologic patterns (tubular, papillary, mucinous and poorly cohesive, the last one including signet-ring cell carcinoma) plus uncommon variants4; often elements of more histologic pattern coexist in the same neoplastic lesion and the classification is based on the predominant one (fig 2). The Lauren’s intestinal type (which corresponds to papillary, tubular and mucinous adenocarcinoma) is often related to environmental factors while the diffuse type (corresponding to poorly cohesive carcinoma) is more often associated with genetic abnormalities4. The most common histologic type of EGC are tubular and papillary, while AGC is often more heterogeneous with several co-existing histologic growth patterns4.
The TNM classification system represents one of the main prognostic factor in oncologic patients; the preoperative staging of gastric cancer is essential in order to stratify patients based on the prognosis and choose the best treatment for each of them. The cut-off to decide between medical or surgical treatment is the differentiation between T2 and T3 and between N0 and N+.
The only intent-to-healing treatment for patients with gastric cancer is the curative surgery with lymphadenectomy but only selected patients could benefit from this treatment.
In the last years MRI, PET, Endoscopic Ultrasound and MDCT were proposed to have a role in the preoperative staging of patients, but MDCT is the only diagnostic procedure to be readily available, quick in execution, with a wide field of view and with the possibility to evaluate all staging parameters in the same examination, including metastasis.
Many studies in the last twenty years analysed parameters evaluable on CT images to predict tumor and nodal status of patients before surgery. Radiologist should provide information about clinical T, N and M stage (cT, cN and cM respectively), but sometimes it is a difficult task for example due to errors in technical execution of the exam (i.e. not optimal arterial or venous phase acquisition), technology of available scanner CT or not good images quality due to the lack cooperation of the patients who moves during MDCT execution or refuses to drink water.
Our purpose is to evaluate the overall accuracy in MDCT T-staging and the ability to distinguish T2 from T3, the accuracy, sensitivity, specificity, PPV and NPV in assessing nodal status on imaging, eventually identifying criteria to improve the concordance with pathologic results.
Materials and methods
Materials and methods
Materials and methods
Materials and methods
Patients selection
In our department 19 patients with non-cardial gastric cancer underwent to staging with a MDCT examination during the period between April 2010 and January 2014 and then to radical surgery (8 man and 11 women; age range and mean age of 60-88 and 75 years, 63-83 and 75 years and 60-88 and 75 years overall the sample, for men and women respectively).
The time elapsed between MDCT and surgery ranged between 7 and 72 days (10-72 days for men and 7-53 days for women), average 20 days (23 days for men and 17 days for women).
Exclusion criteria were the absence of intent-to-curative surgery and a neoadjuvant treatment, due to the lack of a reliable comparison between the MDCT and the pathological evaluation, a non optimal protocol of study, especially the lack of a sufficient gastric distension, previous gastric surgery and gastric tumors different from carcinoma.
MDCT protocol
MDCT was performed using a 64-detector row CT scanner (LightSpeed VCT; GE Healthcare, Milwaukee, WI, USA). All patients underwent examination after at least 6 hours of fasting to empty the stomach and they were requested to drink at least 500 ml of water immediately before starting the exam in order to obtain a sufficient gastric distension for an optimal visualization of the tumor.
CT images were obtained before and after the intravenous administration of non-ionic contrast material, exactly in the arterial phase (better defined mucosal phase,
and in the venous phase (80 seconds after the contrast medium injection); if necessary, a later phase (180 seconds after the injection) and/or a lateral or prone acquisition were made.
All patients imaging include 2.5mm slice thickness with 2.5mm reconstruction interval (2.5/2.5mm) but, due to the retrospective study design, only for 13 of them were disposable also the series 2.5mm slice thickness with 1.25mm reconstruction interval (2.5/1.25mm). So there were 6 series of images: 2.5/2.5mm of all patients, 2.5/1.25mm of 13 patients and 2.5/2.5mm of the same 13 patients, each one in the arterial and venous phases.
Imaging evaluation
Images were retrospectively evaluated by a radiologist with five years of abdominal imaging experience blinded to the pathologic results. Gastric distension volume, tumor volume and maximum tumor thickness were calculated.
Gastric distension volume was calculated on images acquired during the venous phase with 2.5mm thickness and 2.5mm reconstruction interval.
Tumor volume was calculated on the arterial 2.5/2.5mm series (except for one patients due to the incomplete visualization of the lesion in this phase) while maximum tumor thickness was calculated separately on all series.
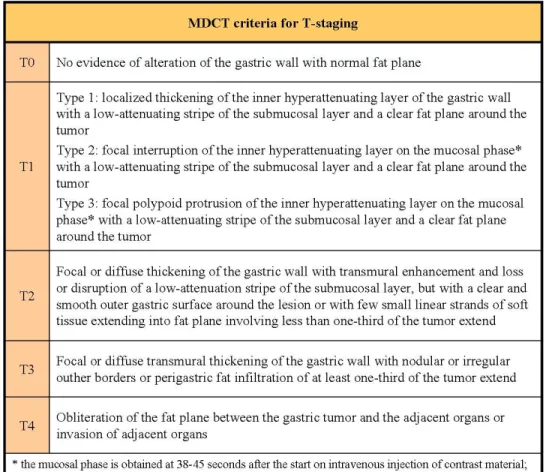
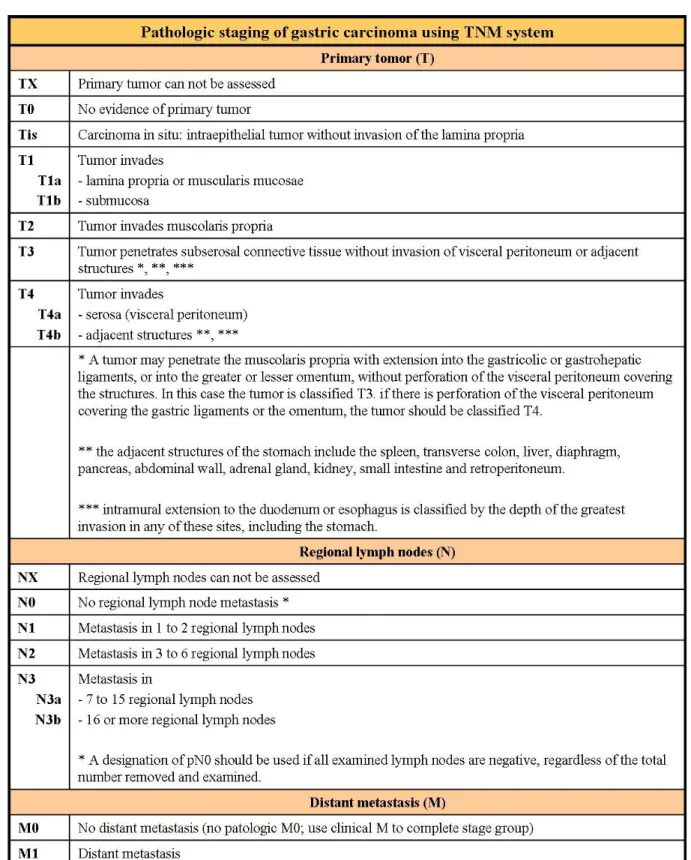
cT and cN-staging were based on the currently used MDCT criteria6, 7, 8 (fig 3a-b). Results were compared with the pathologic evaluation of specimens according to the 7th edition of TNM system5 (fig 4; for all patients nodal dissection involved at least 15 lymph node).
T-staging. All series of images were shuffle evaluated (2.5/2.5mm and 2.5/1.25mm both in the arterial and venous phases). For each series were separately evaluated only axial image and the combination of axial and Multi-Planar-Reformation (MPR) images and the overall accuracy for each one were calculated. Not detected lesions were classified cT1 according to previous studies9.
N-staging. Lymph nodes were evaluated three times on the venous 2.5/2.5mm series and classified as metastatic or not according to the three groups of criteria most commonly used. Accuracy, sensitivity, specificity, positive predictive value (PPV) and negative predictive value (NPV) were calculated.
Statistical analysis
To calculate correlation between tumor volume on imaging and patologic T-stage (pT), pT1a and p-T1b were grouped together and the evaluation was made for each couple of p-T using t-test. The same procedure was done to calculate correlation between maximum tumor thickness and pT, but the evaluation was made for each series.
To calculate correlation between tumor volume on imaging and pathologic N-stage (pN) only two groups were considered, N0 and N+ (N+ = N1+N2+N3a+N3b), and t-test was used.
Results
Results
Results
Results
In all patients included in this study, tumor were localized in the area between the lower part of the gastric body and the pyloric region; there were no tumors in the fundus nor in the upper part of the gastric body.
Gastric volumes ranged between 257 and 1289 ml (mean±st dev, 748±323 ml); only for three patients a volume lower than 500ml was measured.
Histopathologic results documented 3 pT1 (16% of the sample), 5 pT2 (26%) and 11 pT3 (58%).
Tumor volume significantly correlated with pT in all cases with a p-value ≤ 0.02 (tab 1); no relationship has been shown between tumor volume and pN (tab 2).
Maximum tumor thickness significantly correlated with pT2 and pT3 (tab 3a-b); there are not significant differences in pT1 vs pT2 subgroups on 2.5/2.5mm series. No relationship between maximum tumor thickness and pN was detected (Tab 4).
T-staging overall accuracy ranged from 0.72 and 0.89 for 2.5/2.5mm series and from 0.62 and 0.85 for 2.5/1.25mm series; accuracies in the 2.5/2.5mm subgroup (thirteen patients) and 2.5/1.25mm were comparable (tab 5).
According to the different evaluation systems applied, N-staging accuracy ranged between 0.68 and 0.84, sensitivity between 0.69 and 0.93, specificity between 0.50 and 0.67, PPV between 0.79 and 0.82, NPV between 0.50 and 1 (tab 6).
Discussion
Discussion
Discussion
Discussion
The majority of previous studies were made on Asian population, whose gastric cancer epidemiology is different from that of western countries, with Japan and Korea having the highest gastric cancer rate in the world10; in eastern countries the higher incidence of the tumor led to a more careful surveillance of population at risk and for these reasons there are wide sample in most studies and a number of early gastric cancer at diagnosis greater than that of the western countries (ranging from 30% to 70% and from 5% to 15% respectively10). The small size of our sample is justified by the lower Italian incidence of this tumor and the adopted exclusion criteria; furthermore patients classified T3 at the pathological analysis are more than half of the sample (11 of 19; 58%).
An high percentage of patients with gastric cancer have advanced disease at presentation with peritoneal or visceral metastasis (about 48% of cases in the UK) that preclude curative surgery, so were offered them palliative or supportive treatment11. MDCT has a low sensitivity (about 25%) and an high specificity (about 99%) in detecting peritoneal disease, with an improvement related to new technologies; due to its high false negative rate, patients without evidence of metastasis at imaging could undergo diagnostic laparoscopy with biopsy to assess peritoneal and visceral status, confirming or disproving the negative imaging11.
With regard to cT-staging using known morphologic criteria, according to previous reports, our results showed that MDCT overall accuracy (ranging between 0.69 and 0.89) is good but not excellent7, 9, 12, 13 (fig 5). We did not noticed significant differences between the sets of images 2.5/2.5mm and 2.5/1.25mm one, while we noticed a difference between sets of images acquired in arterial and venous phase, with a slight better accuracy for the second one. The evaluation of the images quality in our opinion justifies this apparently abnormal result: the correct arterial phase to obtain the maximum mucosal layer enhancement has to start 20 seconds after the maximum enhancement in the superior mesenteric artery; some acquisition of our set started too early, becoming vascular phase, due to the lack of use of system for contrast medium bolus timing or to slow bloodstream in elderly or cardiopath patients. The venous phase, instead, has a longer time duration, so a not perfect scanning temporization
does not always negatively influence the images quality. Furthermore the accuracy of venous MPR set of images was slightly higher than the others, in contrast with the significant difference documented by previous data14. This discrepancy could by justified by the different location of the lesions; in fact in our sample the majority of the lesions were localized in anatomical site not very influenced by partial volume artifacts. Therefore the venous phase acquisition and MPR are essential for cT-staging.
Errors in T-staging did not depend neither on the anatomical tumor localization (the sample is very homogeneous for this variable) nor on the insufficient gastric distension; in fact, despite a too wide distribution of gastric distension volumes, only one error was made for volume lower than 500ml and was not significant in order to treatment (it was a pT2 cT1). According to previous data9, they did not depend neither on the histologic pattern nor on the tumor grading.
Only two errors in cT-staging were significant: a pT1 overstaged to cT2 or cT3 depending on set of images, and a pT3 understaged to cT2 (fig 6); for this reason, we can conclude that despite overall not excellent accuracy, MDCT often gives sufficient information for a correct therapeutic planning.
Both tumor volume and maximum tumor thickness have been shown to correlate with pT; to measure thickness is easy and quick, while the volume calculation requires more time and is not feasible routinely but can help in cases of doubt or to support T-staging.
Our data did not document any relationship between tumor volume or maximum thickness and pathologic nodal status neither in pN3 patients, contrary to what was reported in previous work that demonstrated that the frequency of lymphatic metastasis is related to the size of the tumor, to its depth of penetration into the stomach wall and the T-stage, ranging from 2,2% in T1a to 64% in T315, justified by the abundance of lymphatic vessels in the gastric wall16. The discordance of our data could be justified by the different population in study (great part of the literature on gastric cancer is based on eastern countries) or the smallest sample, but above all in our study patients with lymph node metastasis at pathologic analysis were 66% of pT1, 60% of pT2 and 72% of pT3, percentages very distant from literature.
Lymph node status is an important prognostic factor in gastric cancer. In fact the 5-years survival rate after surgical treatment is 86,1% in patients with N0 gastric cancer and only 58,1%, 23,3 % and 5,9% in patients classified N1, N2 and N3 respectively15. For this reason many studies were made in the past twenty years with the aim of identifying pathological features of lymph nodes at imaging in order to reach a preoperative N-staging the most correct possible; this would allow to choose the most appropriate therapeutic planning not only in term of neoadjuvant therapy17 or directly surgery but also in deciding the extension of lymph node dissection (fig 7a-b).
Lymphadenectomy is associated with high morbidity and mortality so patients without nodal involvement could benefit from a nodal dissection not to much extensive15. In EGC lymph node metastasis represent the main determinant of patients survival and range from 8% to 20%10. While in western countries radical surgery with lymphadenectomy is the standard treatment also for EGC, in eastern countries endoscopic surgery (endoscopic mucosal resection and endoscopic submucosal dissection) is indicated in patients with non-ulcerated tumors smaller than 2 cm10, though the extension of this criteria could be possible in the future18, and the nodal status is an important watershed between radical and endoscopic surgery10. The risk to have lymph nodes metastasis was proven being related also to histologic pattern of the tumor: papillary, poorly cohesive and micropapillary carcinomas have an higher incidence of nodal involvement (up to 82% in the last pattern4). Therefore surgical approach to these histologic tumor types is advised to be careful, especially in the micropapillary one for which a conservative approach such as endoscopic resection is not adequate4.
Problems in N-staging at imaging are about detection and characterization. While until twenty years ago imaging techniques (CT and MR) allowed to identify only lymph nodes that were 5 mm or greater in diameter19, now the minimum diameter for detection is shorter but often there are difficulties in defining them as pathological or normal/reactive.
Previous studies have documented the relationship between risk of nodal metastasis and the largest diameter of lymph nodes (the average size of tumor-free lymph nodes being 4.1±2.7 mm while that of metastatic one being 6.0±4,7 mm with a statistically significant difference) but lymph node size is not a reliable indicator for nodal
metastasis in patients with gastric cancer19. Our nodal involvement evaluation applying three different group of currently accepted criteria documented good accuracy, sensitivity and PPV and an excellent NPV, specially with the scheme A, to the detriment of a low specificity (fig 8).... Previous published data are heterogeneous depending on adopted criteria for nodal evaluation and CT or MDCT protocol used7, 8, 15. A not blinded review of wrong cases documented only very small lymph nodes (smaller than 4 mm), not grouped in cluster and without significant enhancement; for two patients nodal morphological characteristics continued to result highly suspicious for metastasis with each evaluation scheme adopted, despite knowing the negative pathologic result (fig 9). We can support the scheme A as the best for MDCT N-staging, lacking in our experience and with a small sample analyzed additional criteria to improve the results. In addition, our errors in cN-staging were not in the group of patients with high risk for nodal metastasis on the basis of hystologic pattern of the tumor (three intestinal type –two with intestinal pattern and one not specified-, and one signet-ring cell carcinoma).
Limits of this study are: the retrospective design; the small number of patients; the evaluation only of patients who underwent to intent-to-cure surgery, excluding more advanced tumors due to the impossibility to have the pathologic specimen and histologic diagnosis to compare with imaging; exclusion of patients who underwent neoadjuvant chemotherapy because treatment could cause changes not necessarily radiologically appreciable11; the lack of a one-to-one correspondence between lymph nodes view on images and those surgically removed.
Conclusions
Conclusions
Conclusions
Conclusions
CT exam is a complete and available technique for tumor staging. The availability of MDCT scanners able to acquire images with isotropic or near-isotropic voxel allows radiologist to evaluate not only axial images but also reformatted one in every spatial plane. MPR can be useful to better measure primitive lesion, identify the infiltration deep into the gastric wall and possible signs of involvement of perigastric fatty tissue,
In patients with gastric cancer with the correct preparation of patients, a good acquisition protocol in terms of phase acquisition, slice thickness and reconstruction interval, and the routine use of MPR, radiologist can give accurate information about cT and cN-staging, although there are still no agreed guidelines for staging of non-cardial gastric cancer.
References
References
References
References
1. Ferlay J, Soerjomataram I, Ervik M, Dikshit R, Eser S, Mathers C, Rebelo M, Parkin DM, Forman D, Bray, F. GLOBOCAN 2012 v1.0, Cancer Incidence and Mortality Worldwide: IARC CancerBase No. 11 [Internet]. Lyon, France: International Agency for Research on Cancer; 2013. Available from: http://globocan.iarc.fr [accessed 14.06.2014]
2. Lee YY, Derakhshan MH. Environmental and Lifestyle Risk Factors of Gastric Cancer. Arch Iran Med 2013;16(6):358-365
3. Jemal A, Center MM, DeSantis C, Ward EM. Global patterns of cancer incidence and mortality rates and trends. Cancer Epidemiol Biomarkers Prev 2010;19(8):1893-907
4. Hu B, El Hajj N, Sittler S, Lammert N, Barnes R, Meloni-Ehrig A. Gastric cancer: classification, histology and application of molecular pathology. J Gastrointest Oncol 2012;3(3):251-261
5. Sobin L, Gospodarowisz M, Wittekind C. TNM classification of malignant tumours. New York:Wiley 2009
6. Lee MH, Choi D, Park MJ, Lee MW. Gastric cancer: imaging and staging with MDCT based on the 7th AJCC guidelines. Abdom Imaging 2012;37:531-540
7. Habermann CR, Weiss F, Riecken R, et al. Preoperative staging of gastric adenocarcinoma: comparison of helical CT and endoscopic US. Radiology 2004;230:465-471
8. Kim SH, Kim JJ, Lee JS, et al. Preoperative N staging of gastric cancer by stomach protocol computed tomography. J Gastric Cancer 2013;13(3):149-156
9. Kim JW, Shin SS, Heo SH, et al. Diagnostic performance of 64-section CT using CT gastrography in preoperative T staging of gastric cancer according to 7th edition of AJCC cancer staging manual. Eur Radiol 2012;22:654-662
10. Sung CM, Hsu CM, Hsu JT, et al. Predictive factors for lymph node metastasis in early gastric cancer. World J Gastroenterol 2010;16(41):5252-5256
11. Burbidge S, Mahady K, Naik K. The role of CT and staging laparoscopy in the staging of gastric cancer. Clin Radiol 2013;68(3)251-255
12. Kim AY, Kim HJ, Ha HK. Gastric cancer by multidetector row CT: preoperative staging. Abdom Imaging 2005;30:465-472
13. Kwee RM, Kwee TC. Imaging in local staging of gastric cancer: a systematic review. J Clin Oncol 2007;25(15):2107-2115
14. Chen CY, Hsu JS, Wu DC, et al. Gastric cancer: preoperative local staging with 3D Multi-Detector CT – Correlation with surgical and histopathologic results. Radiology 2007;242(2)472-482
15. Kwee RM, Kwee TC. Imaging in assessing lymph node status in gastric cancer. Gastric Cancer 2009;12:6-22
16. Fukuya T, Honda H, Hayashi T, et al. Lymph-node metastases: efficacy of detection with helical CT in patients with gastric cancer Radiology 1995;197:705-711 17. Chua YJ, Cunningham D. The UK NCI MAGIC trial of perioperative chemotherapy in resectable gastric cancer: implications for clinical practice. Ann Surg Oncol 2007;14(10):2687-2690
18. Godota T, Yanagisawa A, Sasako M, et al. Incidence of lymph node metastasis from early gastric cancer: estimation with a large number of cases at two large centers. Gastric Cancer 2000;3:219-225
19. Monig SP, Zirbes TK, Schroder W, et al. Staging of gastric cancer: correlation of lymph node size and metastatic infiltration. Am J Roentgenol 1999;173:365-367
20. Lee JH, Jeong YK, Kim DH, et al. Two-phase helical CT for detection of early gastric cancer carcinoma: importance of the mucosal phase for analysis of the abnormal mucosal layer. J Comput Assist Tomogr 2000;24(5):777-782
21. Lim JS, Yun MJ, Kim MJ, et al. CT and PET in stomach cancer: preoperative staging and monitoring os response to therapy. RadioGraphics 2006;26:143-156
Figures and tables
Figures and tables
Figures and tables
Figures and tables
Fig 1. Gross appearance classification of Early and Advanced Gastric Cancer4, 14
Fig 2. Classification of gastric adenocarcinoma according to WHO classification (2010) and Lauren’s criteria4
Fig 3a. Criteria for T-staging based on MDCT images6, 7, 20
Fig 3b. Criteria for N-staging based on MDCT images (scheme A6, scheme B7, scheme C8)
Tab 3a. Maximum tumor thickness distribution inside pT categories
Tab 4. Correlation between maximum tumor thickness an pN
Tab 6. Accuracy, sensitivity, specificity, PPV and NPV of three different scheme for lymph node evaluation (scheme A6, scheme B7, scheme C8)
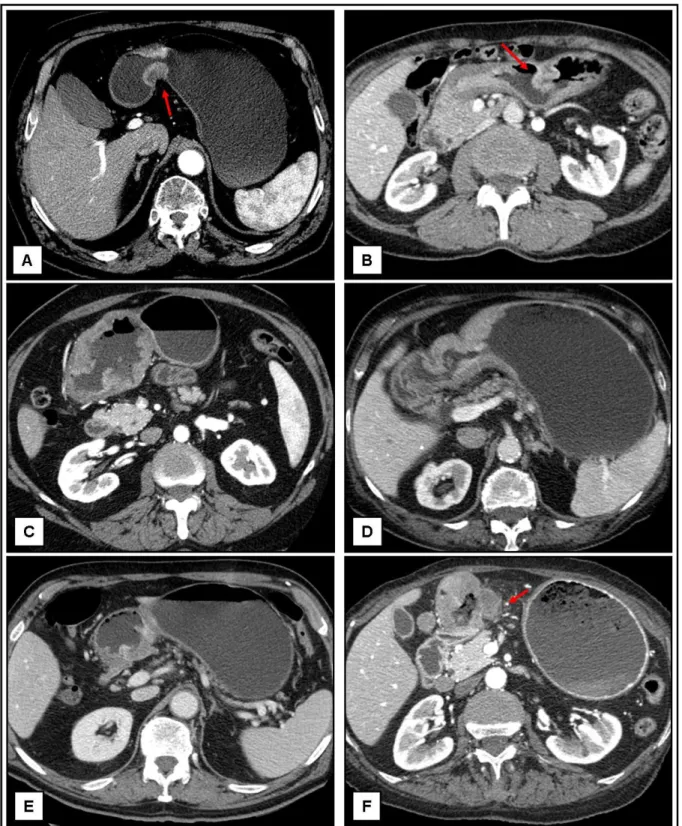
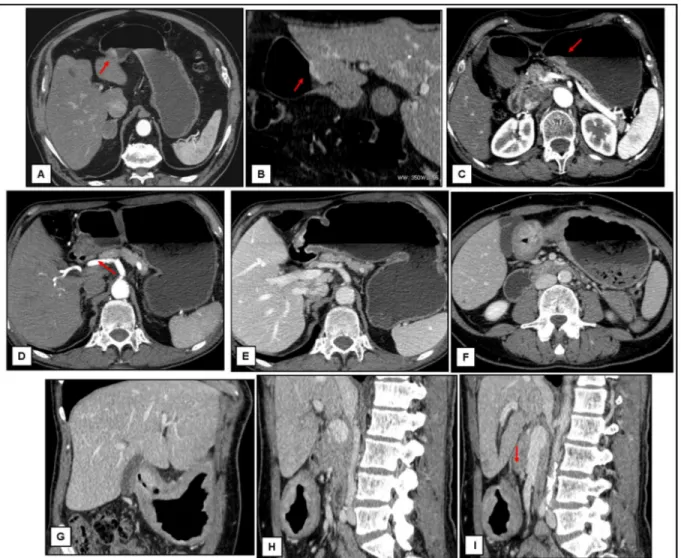
Fig 5. Axial images of some correct T-staging. A-B: A circular thickness of the inner layer of the antrum extent to involve the muscolaris (arrows). C-F: Transmural thickness of the gastric wall with irregular (C-D) or nodular (E-F) outer borders and with perigastric fat infiltration (F, arrow)
Fig 6. Axial and MPR images of misdiagnoses. A-C: Focal thickness of the inner hyperattenuating layer of the gastric wall (arrows) with a low-attenuating stripe of the submucosal layer; cT1 pT2 (A and B are images of the same patient). D-E: Transmural thickness of the gastric wall with apparent irregular outher border (arrow), not visible during the venous phase (E); pT1 cT2-3. F-I: Transmural thickness of the prepyloric region with involvement of the muscolaris and few small linear strands of soft tissue extending into fat plane involving less than one-third of the tumor extend (arrow); pT3 cT2
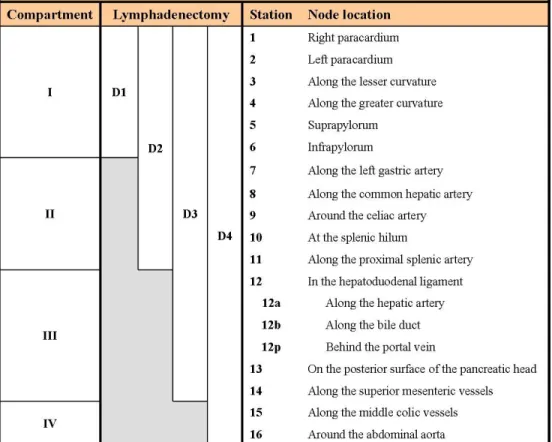
Fig 7a. Topographic classification of lymph nodes in gastric cancer, of their arrangement in compartments and classification of the lymphadenectomy extension21
Fig 7b. Illustration of lymph node locations according to the Japanese Research Society for Gastric Cancer21. (SMA = superior mesenteric artery; SMV = superior mesenteric vein)
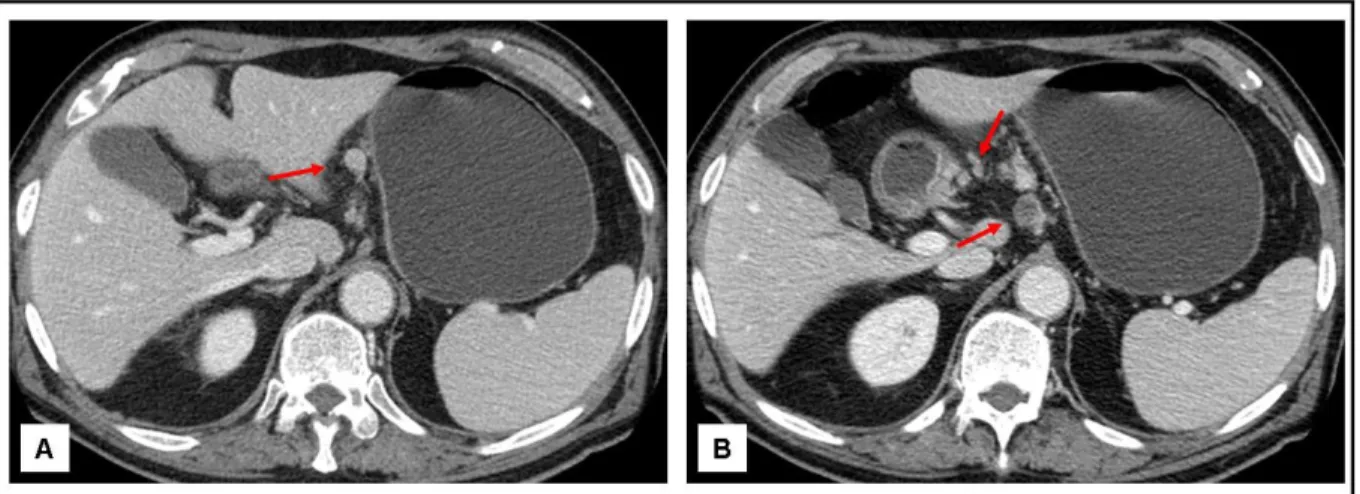
Fig 8. Pathologic large lymph nodes with enhancement (A), central hypodensities due to necrosis or in cluster (B)
Fig 9. False positive lymph nodes. C-F: Large perilesional lymph nodes (A-B), in cluster (C) and with signs of central necrosis (D)