Department of Agriculture, Food and Environment
Master of Science
in
Plant and Microbe Biotechnology
Molecular networks controlling leaf cell
differentiation during drought stress in
Brachypodium distachyon
Candidate
Concetta De Quattro
Co-supervisor Supervisors
Prof. Andrea Cavallini Prof. Mario Enrico Pè
Dr. Rodolfo Bernardi
Gli ultimi saranno primi e i primi saranno ultimi.
Table of contents
1 Introduction ... 5
1.1 Modern agriculture ...5
1.2 Monocots and Brachypodium distachyon as a model plant ...7
1.3 Plant abiotic stress response ...12
1.4 Small RNAs and abiotic stress ...18
1.5 Molecular regulation of leaf development ...24
1.6 Background information ...27
2 Research objectives ... 31
3 Material and methods ... 32
3.1 Drought stress treatment ...32
3.2 Plant material and leaf sampling for molecular analysis ...33
3.3 RNA extraction ...33
3.4 Illumina Library construction and Sequencing...33
3.5 Bioinformatic analysis ...34
3.6 microRNA validation with 5'-RACE ...37
4 Results ... 39
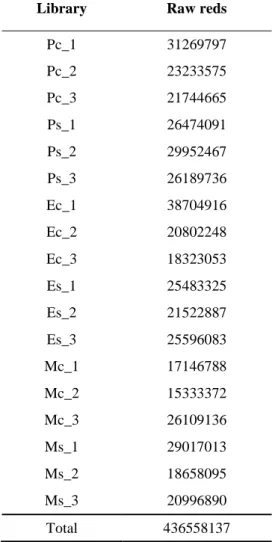
4.1 Raw sequence results ...39
4.2 Reads alignments to reference genome ...45
4.3 Approaches of transcriptome analysis ...48
4.4 Differential expression analysis ...50
4.5 Gene Ontology analysis ...71
4.6 Identification of miRNAs target genes ...80
4.7 Validation of predicted miRNAs target by 5'-RACE ...90
5 Discussion ... 92
5.1 The Molecular response to drought stress ...92
5.2 Role of miRNAs in leaf growth during drought stress conditions ...94
6 Conclusions ... 97
Abstract
An important challenge for today agriculture is to intensify worldwide cereal production in a sustainable manner in order to respond to the increasing food demand.
Food production is limited mainly by biotic and abiotic stress and in particular by drought stress, the most common environmental factor affecting plant growth worldwide. For these reasons, the understanding of the complex molecular mechanisms involved in plant response during drought stresses is crucial for developing improved crop varieties better adapted to limiting environments.
Brachypodium distachyon (Bd), a drought-tolerant wild grass, is an interesting model
species to deeply study the molecular mechanisms involved in drought-stress response. With this aim, in this study a reproducible soil assay to subject Bd to drought stress was applied, which resulted in a drastically leaf size reduction. This effect was mainly caused by a reduction in cell expansion instead of a reduction of cell proliferation, underlining the insensitivity of the meristem to drought stress.
Starting from this drastic phenotypic effect, the project, using Next Generation Sequencing (NGS) data provides a description of the molecular networks activated in response to drought, focusing on three different developmental zones (proliferation, expansion, and mature cells) of the third young developing Brachypodium leaf. More specifically, in order to investigate the mechanisms controlling leaf growth reduction during drought, the third emerging leaf was dissected in the three developmental zones and each zone was subjected to whole transcriptome analysis based on NGS. Eighteen libraries were sequenced, i.e. 3 cell types of leaf grown in control and drought condition, considering 3 biological replicates. Bioinformatics tools and statistical analyses were applied to NGS data, showing that distinct leaf cell zones respond differently to drought treatment. Moreover, the integration of mRNA-Seq data with small RNA-Seq data, previously produced by the lab, allowed to investigate the link between microRNAs and their putative target genes.
1
Introduction
1.1 Modern agriculture
Human population has been predicted to reach over 9.3 billion by the year 2050 (U.S. Census Bureau 2014) and it has been estimated that global food production must be increased over 50-70% due to the exponentially growing world population (FAO, 2009). At the same time, the industrial demand for crops is expected to rise with the growing use of renewable fuel worldwide (Baldos and Hertel, 2014).
Biotic and abiotic stress negatively affect food production, causing a reduction up to 70% (Boyer, 1982) and in particular drought stress, the most common environmental factor, has been shown to pose a critical challenge to agriculture in 45% of the world. ag (Bot, 2000). Thus, water represents a limiting resource in many environments and it has been expected to become even scarcer in the coming decades (UN, 2007).
In this context, the oncoming global climate changes are fuelling the current and future agricultural difficulties, especially water deficit.
The latest report of the Intergovernmental Panel on Climate Change (IPCC, 2013) highlighted that warming is unequivocal, many of the observed changes are unprecedented over decades to millennia: in the Northern Hemisphere, 1983–2012 was likely the warmest 30-year period of the last 1400 years and many extreme weather and climate events have been observed since 1950s (Fig.1.1).
A plausible climate change scenarios includes higher temperatures, changes in precipitation, and higher atmospheric CO2 concentrations (Adams et al., 1998). Climate change impacts agro-ecosystems, affecting plant growth by increasing the variability (frequency and intensity) of weather conditions, such as rainfall, drought, water-logging and elevated temperature. These changes affect both crop productivity and quality (Ortiz et al., 2014).
In this scenario, intensifying food production will be crucial to ensure food security in the coming future.
Figure 1.1. Observed global mean land surface temperature anomalies, from 1850 to 2012.
Top panel: annual mean values. Bottom panel: decadal mean values including the estimate of uncertainty for one dataset (black). Anomalies are relative to the mean of 1961−1990. Source: IPPC, 2013.
Increasing the cultivated area is not a feasible option to improve global food production. Therefore, it will be important to improve production in a sustainable manner. Important results in improving crop production could be reached by optimizing agricultural practices, reducing the yield gap, reducing food waste, changing consumption patterns or increasing the effectiveness of the food systems. However, these practices represent a partial solution (Dempewolf et al., 2014, Ortiz et al., 2014). The development of high-yielding crops that can tolerate adverse environmental conditions is now becoming a very important scientific and socio-economical challenge. Current crops are poorly adapted to more uncertain and extreme climatic conditions (Bevan et al., 2010). They have a low genetic diversity as compared to their wild
ancestors, due to domestication, which resulted in population bottlenecks. This lack of variation thwarts attempts to improve germplasm, such as increasing its yield and its stress tolerance.
With the aim to have crops better adapted to new environments, two strategies could be used: developing new crops varieties (genotypes) with conventional breeding programs or introducing target traits into existing crops through genetic engineering.
Conventional breeding approaches could use wild plant species closely related to crops as a source of genetic variability in order to characterize traits involved in stress tolerance. For example plant adaptation to drought, cold, salinity and plant resistance to biotic stresses have been improved through the use of wild plant. Recently the need to better explore plant biodiversity, including wild ancestors, seed banks around the world has emerged, with the objective to improve crops response to climate change (Dempewolf et al., 2014). However, breeding for abiotic stress tolerance is very demanding, time consuming and difficult to realize due to low hereditability.
On the other hand, plant genetic engineering could represent an option, but, besides its scarse acceptability in many Countries, its potential is reduced by the lack of precise and effective target genes to be transferred.
1.2 Monocots and Brachypodium distachyon as a model plant
The Poaceae family is the fourth largest plant family in the world, with over 10,000 species distributed worldwide. The top four agricultural commodities by quantity are grass crops, such as sugarcane, maize, rice, wheat (Bevan et al., 2010).
Unfortunately, the breeding of those crops is time consuming and difficult due to the large polyploid genomes, long generation times, demanding growth requirements, and restricted access to germplasm due to quarantine restrictions and intellectual property concerns (Brkljacic et al., 2011). However, model plants have allowed scientists to study and characterized complex biological processes, which can be used in breeding programs of non-model organisms. Arabidopsis thaliana, who was the first plant with a sequenced genome, was the plant model for higher plant for many years. However, t
Arabidopsis is not a very effective model plant for monocots, especially when
In 2001 the undomesticated grass Brachypodium distachyon (Bd), belonging to the Pooideae, was proposed as a model species for temperate cereals, such as wheat andbarley (Draper et al., 2001, Brkljacic et al., 2011). This plant is a good model system due to its small stature (30 cm at maturity), short generation time (12 weeks), small genome (~300 Mbp), the ability to self-pollinate, easy growth under simple conditions and easy to transformation (Fig.1.2). All these features are particularly suited for genetic studies and molecular experiments with direct relevance to gene discovery and breeding program of wheat.
Figure 1.2. Images of Brachypodium plant, leaf and spike (from http://turboweed.org)
Brachypodium distachyon (Bd) belongs to the Poaceae family. Bd is a diploid species
with a chromosome base number of x=5. Different polyploids species have been found: the autopolyploid series with diploid (2n=10), the tetraploid (2n=20) and the hexaploid (2n=30). The ploides 2n=20, 30, in contast with Bd (2n=10) tend to be taller, have a lesser requirement for vernalization exhibit prominent anthesis and larger seeds (Mur et al, 2011).
It was estimated that Bd diverged from a common wheat ancestor 32-39 million years ago (Mya), from the common rice ancestor 40-53 Mya and from that common sorghum ancestor 45-60 Mya (Fig.1.3). The phylogenetic survey showed that wheat is more closely related to Brachypodium than rice, sorghum or maize. Comparative genome analysis has highlighted a much higher synteny between Brachypodium and Triticaceae than that between rice or sorghum. Therefore, studies on Bd could be easily translated to cereal crops than studies of other model plant.
Figure 1.3. The distribution maxima of mean synonymous substitution rates (Ks) of Brachypodium, rice, sorghum and wheat orthologous gene pairs (Supplementary Table 16) were used to define the divergence times of these species and the age of interchromosomal duplications in Brachypodium. WGD, whole-genome duplication. The numbers refer to the predicted divergence times measured as Myr ago by the NG or ML methods (IBI, 2010).
Brachypodium displays many of the agronomic traits that are relevant for temperate
cereals improvement, such as resistance to certain pathogens, cell wall composition, grain characteristics and abiotic stress tolerance.
Initially, Bd was proposed as model plant in order to study plant-pathogen response, in particular fungal rust pathogen (Xin-Chun, 2014). Recently many organizations, especially the U.S. Department of Energy, has proposed Brachypodium as a model system to study the genetic mechanisms controlling cell wall composition, biomass and stress tolerance (Bevan et al., 2010). Notably, along this topics, Bd has been also proposed as a model system for biofuel production, such as the wild grasses Miscanthus and switchgrass (Panicum virgatum).
Bd is also an interesting model plant for the identification and characterization of traits that could have been lost during domestication of cultivated crops, considering that it was never subjected to human selection. Moreover, these traits could be transferred easily to related grass crops (Jeong et al., 2013). An important Bd trait that could be studied is drough-tolerance. Originating from Iraq, Bd is an highly drough-tolerant plant. It may posses molecular mechanisms involved in drought stress response that may have been lost during domestication, therefore it could become a model system for studying drought tolerance in temperate cereal crops (Verelst et al., 2012).
A wide variety of genetic and genomic tools was developed (Mur, 2011).
In 2010, the International Brachypodium Initiative sequenced the entire genome of
subfamily. The diploid inbred line Bd21 was sequenced using a whole genome shot-gun sequencing approach and assembled to ten largest scaffolds, covering 99.6% of sequenced nucleotides. The genome contains 21.4% retrotrasposon sequences and about 25532 protein-coding gene loci annotated, similar to those predicted in rice and sorghum (Xin-Chun, 2014). Genome assembly is of high quality, due to the low level of repetitive DNA in the genome (28%) and to the BAC libraries sequences used during the assembly (Brkljacic et al., 2011). Recently, a revised version of Bd21 genome became available.
Agrobacterium tumefaciens-mediated transformation methods have been developed for
Brachypodium. Combining this features with a rapid generation time, Bd is an excellent model for transgenic approaches in the grasses crops.
Several functional genetics platform are being developed for Bd, based on T-DNA tagging and chemical mutagenesis approaches.
The Brachypodium transformation has made feasible the creation of collections of sequence indexed T-DNA mutants. Two groups have been conducted projects to create T-DNA mutant collection: the BrachyTAG collection at John Innes Centre (Norwich, UK) currently is formed by 5000 T-DNA lines (genotype Bd21) that are available on the web site (http://www.brachytag.org/) and the USDA Brachypodium Genome Resources collection with 8491 lines (Dalmais et al., 2013).
By chemical mutagenesis it has been created two Brachypodium TILLING populations, one is BRACHYTIL at INRA in Versailles and Evry in France and the other is at the Boyce Thompson Institute. The BRACHYTIL is a tilling platform for the inbred line Bd21-3 formed by DNA isolated from 5530 different families (Dalmais et al., 2013). Together with the development of biological and molecular tools were developed bioinformatics tools which allow the analysis of genomic data.
Many bioinformatics tools are available through the http://www.brachypodium.org website (Fig.1.4).
Figure 1.4. Frame of Brachypodium web site (www.brachypodium.org).
This is the reference web site for Brachypodium community, with links to many different resources and tools. It includes a BLAST tool, a genome annotation database, Brachypodium microarray analysis tools and resources, and BrachyBase, the Brachypodium genome browser, where the 8X assembly genome can be viewed and downloaded. BrachyBase contains standard genome information, EST database, and deduced protein and cDNA sequences. It also contains Illumina RNA-Seq transcriptome data and T-DNA mutant collection. Another Brachypodium genome browser is available at the Munich Information Center for Protein Sequences (http://mips.helmholtz-muenchen.de/).
The availability of the complete genome sequence enables genome wide analysis, such as the analyses of non coding and coding RNAs by means of next-generation sequencing (NGS) approaches. Moreover, the reference genome simplifies the computational identification and annotation of miRNAs and their mRNA target prediction. Currently the research about microRNAs (miRNAs) in Bd is underdeveloped: only 136 mature miRNAs from 135 miRNA precursors from different tissues and drought or cold stress-treated tissues were identified. Comparing to other model plants, such as Arabidopsis (338 miRNAs) and rice (708 miRNAs), the number
of annotated miRNAs in Bd is low, therefore it will be important to characterize with high confidence Bd miRNAs (Jeong et al., 2013).
The whole genome sequence also facilitates the analysis of coding RNAs. Indeed, reads generated by mRNA sequencing could be mapped to the reference genome and could be assembled into transcripts. The high-throughput mRNA sequencing (RNA-seq) makes it possible to discover new genes and transcripts and evaluate transcript expression in a single assay (Trapnell et al., 2012) and it could be used to improve genome annotation (Roberts et al., 2011). In addition, this approach allows to identify genes expressed at a very low level.
The whole transcriptome sequencing with NGS approach was conducted in this research project with the aim to identify molecular changes underlying growth reduction in Bd leaves under drought stress.
1.3 Plant abiotic stress response
Plant growth is affected by changing environmental conditions that could cause a reduction in crop yields. Indeed environmental stresses constitute the primary cause of crop losses worldwide, reducing average yields of most major crop plants by more than 50%. The ongoing climate change increases surface temperatures and aridity that will affect global agriculture in coming years. Together with the decline in arable farmland due to soil degradation and human activities, a strong pressure is put on crop production to feed the growing human population in the next decades (Danquah et al., 2014). For these reasons, it will be important to understand the molecular mechanisms involved in plants response to environmental stresses as an important aid in designing novel and efficient strategies to develop new and better adapted crop varieties.
Abiotic stress is defined as environmental conditions that reduce growth and yield below optimum levels (Cramer et al., 2011). Abiotic stress is characterized by intensity, duration, number of exposure, combination of more than one stress. The plant responses to abiotic stress are dependent on the tissue or organ affected by the stress and developmental stage. In addition, the level and the duration of stress (acute or chronic) can have a significant effect on the complexity of the response (Cramer et al., 2011). In
highly dose-dependent response of plants to stress and depends on the type of stress. This suggests the existence of a very sensitive machinery assessing the stress level and fine-tuning molecular responses (Claeys et al., 2014).
Due to their sessile nature, plants have developed adaptive mechanisms to cope environmental stresses: plants could be sensitive or resistant to stress. In the first instance plant are not able to response to stress, therefore plant might die. Instead resistant plant complete their life cycle under stress conditions, developing different adaptive responses that could be avoidance or tolerance mechanisms. When stress arises, plant growth is often affected by a rapid and acute (“acute response”) inhibition, followed by recovery and adaptation to the new condition (“adaptation response”). While the acute response prepares plants for possibly more severe conditions, the adaptive response can be seen as the establishment of a new steady state to prolonged and stable stress (Skirycz and Inzé, 2010).
The abiotic stress response occurs in two stages: an initial sensory/activation stage, followed by a physiological stage during which the plant responds to the perceived stress. Once a stress is perceived by receptors and sensor proteins on the membrane, the information is transmitted to cytoplasmic target proteins through catalytic processes, such as phosphorylation. Ca2+ and inositol are secondary messangers involved in stress signalling. The increase in Ca2+ is sensed by various calcium binding proteins that initiate phosphorylation cascades that subsequently activate transcription factors. Transcription factors in turn activate expression of stress responsive genes. At this point starts the second phase and physiological changes occur that influence various cellular and whole plant process necessary to survive to the environmental stress. The genes expressed and subsequent physiological changes induced during the second phase are dependent upon the particular abiotic stress encountered. These changes can include modifications to cell membrane components – resulting in changes in membrane fluidity, stomatal closure, decreased photosynthetic activity, and increased production of heat shock proteins (HSPs) or dehydrin cryoprotectants. Thus, abiotic stress affects plant growth and development (Priest et al., 2014).
Stress sensors are not known and most of the signalling intermediates have not been identified. It is thought that different signalling pathways share one or more intermediates/components or have some common outputs, forming a “cross-talk” (Chinnusamy et al., 2004). Recent evidences indicate that plant hormones make a
crosstalk, through a synergic or antagonic interactions, playing a crucial role in plant response to environmental stress, by mediating growth, development, nutrient allocation, and source/sink transitions (Peleg and Blumwald, 2011). The two most important hormones are abscisic acid (ABA) and ethylene. ABA regulate many stress response, particularly osmotic stresses, inducing stomatal closure. Instead, ethylene is involved in many stress responses, such as drought, ozone, flooding, heat, chilling, wooding and UV-B light. Evidences show an interaction between ethylene and ABA during drought stress. Moreover, many abiotic stress affect synthesis, concentration, metabolism, transport and storage of sugars. Soluble sugars play a role as potential signals interacting with light, nitrogen and abiotic stress to regulate plant growth and development (Cramer et al., 2011).
The main abiotic stresses that affect plants and crops in the field include drought, salinity, heat, cold, chilling, freezing, nutrient, high light intensity, ozone (O3) and anaerobic stresses. Drought stress is one of the major factors limiting plant growth and development in agriculture (Boyer, 1982). For cereal crops, drought is the most important abiotic stress component reducing yield. A recent report showed that the extreme drought affected 80% of cultivated land in the United States in 2012 and reduced yield of maize by 27.5% and of soybean by 10%, causing an enormous economic damage (USDA, 2013). Due to climate change and urbanization and the depletion of aquifers, fresh water availability for irrigation will decrease in the coming decades. Hence, given its importance for agriculture, the effects of drought on plant development have been extensively studied in the past decades (Clays and Inzé, 2013). Drought stress response could be subdivided into two strategies: avoidance stress and tolerance stress. Avoidance strategy is the maintenance of a high plant water potential during stress, balancing water uptake and water loss. Water uptake is maximized by the accumulation of compatible solutes, such as prolamines, raffinose, to lower the tissue water potential and by improving root growth, while water loss is limited by closing stomata, restricting shoot growth, trichomes presence, reduced leaf area, senescence of older leaves.
Tolerance strategy involves mechanisms that protect cells against damage. These mechanisms include the production of antioxidant to detoxify reactive oxygen species (ROS) and the synthesis of protective protein, such as dehydrin and late embryogenesis abundant (LEA) proteins, and compatible solutes, that has a dual role as osmolyte and
osmoprotectant. Long-term water stress can be accompanied by morphological changes, such as cuticle thickening, root architecture, hardening of cell walls. The balance between growth and survival is tightly regulated, and plants have evolved specific adaptations to growth under drought conditions (Fig.1.5) (Claeys and Inzé, 2013).
Figure 1.5 The balance between stress tolerance and maintained growth. In response to water
limitation, stress avoidance and tolerance mechanisms are activated to ensure survival in case the stress is prolonged or becomes more severe, resulting in growth limitation and a potential competitive disadvantage. However, several adaptations allow plants to balance survival and continued growth depending on the stress level (Claeys and Inzé, 2013).
Until now, most of these drought responses have been studied only in mature tissues and under rather extreme stress conditions. These experiments have improved our knowledge of stress physiology and molecular responses, but they may not reflect physiological conditions that occur in the field. In addition, it was observed that plant response to severe drought conditions is different from a transient mild water deficit, therefore different mechanisms regulated this process (Skirycz et al., 2011).
Various molecular networks are involved in stress response. The common stress signalling pathways have been distinguished into abscisic acid (ABA) dependent and ABA independent pathway. The increase of ABA under drought stress induce stomatal
closure and regulate expression of transcriptions factors (TFs) that modulate downstream drought-responsive gene expression. TFs induce by ABA are AREB/ABFS, MYB2, MYC2 and RD26 (NAC) which bind their correspondent cis-active elements ABRE, MYB, MYC and NAC. AREB/ABFS is a major cis-acting element in ABA-responsive gene expression and the cis-element ABRE (ABA-responsive cis-element) has been found in the regulatory region of downstream genes. TFs of ABA-independent pathways include ZFHD, DREB2 and NAC(RD26). DRE (dehydration-responsive element)/CTR (C-RepeaT) is one the mayor cis-elements present in the promoter region of various ABA-independent abiotic stress-responsive genes. Recent studies have suggested that there are interactions between the major ABA signalling pathways and other signalling factors in stress responses (Shinozaki and Yamaguchi-Shinozaki, 2007, Nakashima et al., 2014).
After early signal perception events, signaling genes and molecules acting as secondary messengers, such as Ca2+ and reactive oxygen species. These regulatory mechanisms induce downstream functional genes and regulatory genes, such as transcription factors, which are needed to establish new cellular homeostasis that leads to drought tolerance and/or resistance.
Limited water availability affects plant growth. Initially that limiting growth was considered as a secondary effect of stress, caused by reduced photosynthetic activity and stomatal closure a lower rate of photosynthesis. However, carbohydrates are often accumulates in stressed plant, showing that growth reduction is not the consequence of carbon deficit (Claeys and Inzé, 2013).
However, after the onset of the stress, growth rates have been shown to decrease rapidly, independently of photosynthesis (referred to as “short-term adjustment”), followed by growth recovery and adaptation to the new condition. Therefore, it is now accepted that plants actively reduce their growth as part of the stress response. These growth changes allow plants to save and redistribute resources that can become limited; for example, smaller leaves lose less water due to a reduced transpiration area, while differential growth recovery leads to beneficially higher root-to-shoot ratios. Therefore, this phenotypic plasticity allows the plant to manage its resources under changing environmental conditions (Skirycz et al., 2010).
To study the mechanisms underlying stress-mediated growth inhibition, Inzé and co-worker at the University of Gent (BE) studied the in vitro effect of osmotic stress on
Arabidopsis leaf development (Skirycz et al., 2010). Those studies were conducted on
the third leaf because its development is mostly seed-independent and it reaches maturity before the plant starts flowering. This experimental setup considered stage-specific sampling under prolonged drought stress, instead mature leaves or complete plant shoots like previous work. This study identified several hundred transcripts and multiple metabolites that respond to drought exclusively in the proliferating and/or expanding leaf zones. In addition the reduce leaf area is due to a combination of fewer and smaller cells (Skirycz et al., 2010).
In response to drought stress a pause and stop mechanisms has been proposed: when stress occurs, cell cycle rapidly stops with a decrease in CDKA activity and cells are block in a state allowing a quick recovery (pause); if the stress persists, cells initiate the differentiation process (stop). When proliferating cells completely disappeare, meristemoid division activity becomes higher in stressed leaves in order to create a small increase in cell numbers (Skirycz et al., 2011).
Surprisingly, ABA does not seem to be involved in the stress-response in proliferating and expanding cells, suggesting a central role of ethylene signaling in growing leaves. Results show that ethylene inhibits cell proliferation and CDKA activity by a post-transcriptional mechanism, whereas ABA would be responsible for drought tolerance in mature leaves (Fig.1.6) (Skirycz et al., 2011).
Figure 1.6 Simplified scheme depicting the regulation of cell cycle inhibition and cell
differentiation in response to osmotic stress. Very rapidly (within hours) after the imposition of the stress, ethylene (C2H4) production is triggered, inhibiting CDKA activity through a posttranscriptional mechanism that reversibly inhibits the cell cycle by G1/S and G2/M arrest. Cell cycle arrest is independent of EIN3 transcriptional control and possibly mediated by a MAPK signaling pathway or the ribonuclease EIN5. In a later phase, a different signal leads to permanent inhibition and exit from the mitotic cell cycle in favor of the endocycle and cell differentiation. Later in leaf development, meristemoid division activity becomes higher in stressed leaves and the enhanced meristemoid division results in a small increase in cell numbers (Skirycz et al., 2011).
1.4 Small RNAs and abiotic stress
A very exciting area in abiotic stress research has emerged in recent years, focusing on epigenetic factors that mediate response to different stresses (Chinnusamy and Zhu, 2009). Plant small non coding RNAs play an important role in epigenetic regulation regulating gene expression by post-transcriptional degradation, and/or translational repression and/or chromatin modification.
For many years non-coding RNA (ncRNAs) genes were regarded as relics of an RNA-based origin of life. However, with the application of new technologies it was showed that these molecules have highly specialized biological roles so they could not considered as “molecular fossil”. The involvement of many ncRNAs in functions requiring sequence-specific recognition of another nucleic acid sequence suggests their
function as regulatory molecules. During the 1990s, many experiments identified the presence of these small molecules. The first studies were conducted in petunia flowers and they showed that overexpression of gene to produce deep purple flowers gave white flowers instead. The explanation of this molecular mechanisms arrived in 1998 when it was first discovered in the worm Caenorhabditis elegans by studying RNA interference (Bonnet et al., 2006). Thus it was born the “Small RNA Era”.
Small RNAs (sRNAs) are essential regulatory molecules that act to fine-tuning gene expression regulation through sequence complementary-dependent mechanisms at different levels: binding and cutting complementary target mRNAs, inhibiting translation of these mRNAs, and interacting with epigenetic DNA-methylation for RNA-directed DNA methylation (RdDM) (Humbeck, 2013).
Many studies focused on the characterization of the expression of sRNAs and their target transcripts, using mutant analyses to demonstrate the involvement of sRNAs in different stress pathways, e.g. drought, cold, salt, UV, heavy metal and biotic attack (Khraiwesh et al. 2012). The regulatory network of stress-responsive sRNAs also interacts with regulatory pathways under the control of the stress hormone abscisic acid (ABA) (Humbeck, 2013). It was shown that the role of sRNAs in a variety of phenomena is essential for genome stability, development, and adaptive responses to biotic and abiotic stresses (Vaucheret, 2006).
Plant small RNAs are 21-24-nt-long which, depending on their biogenesis and functions, are classified as microRNAs (miRNAs), trans-acting siRNAs (ta-siRNAs), natural antisense siRNAs (nat-siRNAs) and repeat-associated siRNAs (ra-siRNAs). Micro-RNAs are the most abundantly expressed and well-studied class of small RNAs in plants. They are 20-22 nt long non coding RNAs that play a crucial role in regulations of gene expression in most eukaryotes (Schapire et al., 2014).
Plant microRNAs were first discovered in early 2002 in Arabidopsis thaliana, after that many plant miRNAs were found to be conserved in many plant genome such as Oryza
sativa, Zea mays and more ancient vascular plants such as fern or in non vascular plant
such as mosses (Bonnet et al., 2006).
miRNAs are coded by specific genes called MIR genes. Many differ MIR genes and precursors (between 50 and 900 nucleotides) may encode the same mature miRNA or highly similar molecules, therefore, these molecules are grouped into families.
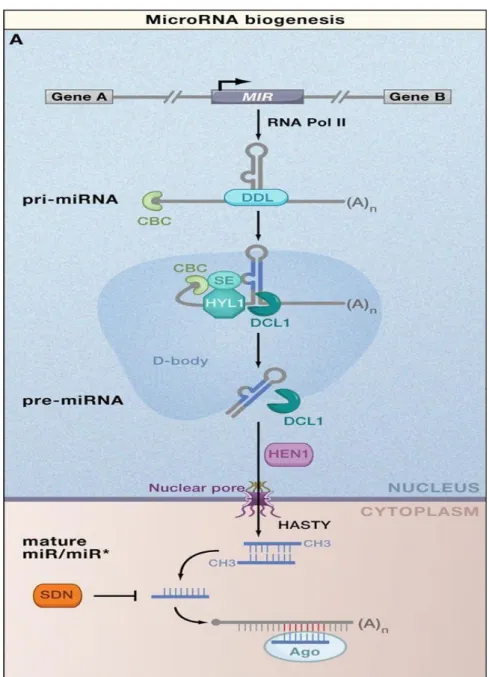
called D-bodies, starting with the production of a primary miRNA (pri-miRNA) transcript from coding intergenic regions mediated by the activity of RNA polymerase II. Dicer-like 1 (DCL1), an RNase III enzyme, processes the pri-miRNA into a shorter, stem-loop formed by base-pairing between self-complementary regions called precursor-miRNA (pre-miRNA) and successively releasing a miRNA/miRNA* duplex with a 2-nucleotide 3' overhang at each end. After methylation by means of HUA ENHANCER 1 (HEN1), miRNA/miRNA* duplexes are exported to the cytoplasm by HASTY (HST), where ARGONAUTE 1 (AGO1), a member of the Argonaute family, recruits the processed RNA mature to form the RNA-induced silencing complexes (RISCs) and the miRNA* is usually degraded. RISC exerts its effect in RNA silencing by facilitating the recognition of RNA sequences showing complementarity to small RNAs incorporated into the complex. Target RNAs are cleaved, or rendered unavailable to translation.
Therefore, in plant miRNAs down-regulate expression of their target genes by complementary target mRNA cleavage between the 10-11 nucleotide or by a translational inhibition which presumably affects the pool of transcripts remaining after cleavage(Voinnet, 2009).
Figure 1.7. Biogenesis of plant miRNAs. Molecular pathway for the processing and stability of
conserved plant microRNAs (miRNAs). Plant pri-miRNAs are mostly transcribed by RNA polymerase II (Pol II) from regions located between protein-coding genes. The RNA-binding protein DAWDLE (DDL) presumably stabilizes pri-miRNAs for their conversion in nuclear processing centers called D-bodies to stem-loop pre-miRNAs. This reaction entails the concerted action and physical interaction of the C2H2-zinc finger protein SERRATE (SE), the double-stranded RNA-binding protein HYPONASTIC LEAVES1 (HYL1), Dicer-like 1 (DCL1), and nuclear cap-binding complex (CBC). Pre-miRNAs, or mature miRNAs produced by DCL1, are then exported to the cytoplasm possibly through the action of the plant exportin 5 ortholog HASTY and other unknown factors. Mature RNA duplexes excised from pre-miRNAs (miRNA/miRNA*, where miRNA is the guide strand and miRNA* is the degraded strand) are methylated by HEN1, a reaction that protects them from being degraded by the SMALL RNA DEGRADING NUCLEASE (SDN) class of exonucleases. The guide miRNA strand is then incorporated into AGO proteins to carry out the silencing reactions (from Voinnet, 2009).
different physiological and developmental processes, such as leaf morphogenesis, patterning and polarity establishment, developmental timing, floral organ identity, phytohormone signaling (Wu, 2013). Moreover, in plant miRNAs have a crucial role in tolerance and response to biotic and abiotic stresses, including cold, drought, salinity, oxidative stress, hormone signaling, nutrient deficiency, bacterial infections, UV-B radiation and mechanical stress (Jiang et al., 2014). Hence, it is crucial the functional characterization of this molecules for understanding plant development and stress response. Recently, a large number of conserved and non-conserved miRNAs related to drought response was identified by means of a genome-wide approach in Populus, soybean, sugarcane, Panicum virgatum and Medicago (Yin et al., 2014).
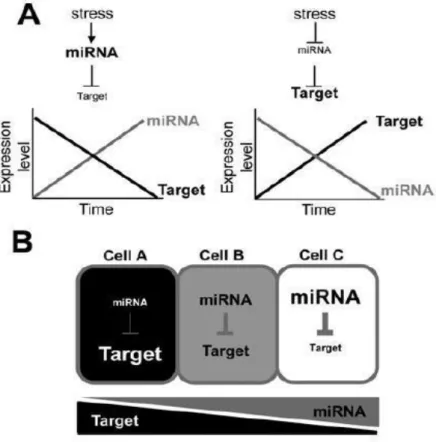
Many stress-responsive miRNAs are induced or repressed during abiotic stress and can modulate the expression of target genes that may be involved in a particular stress response and/or tolerance. miRNA stress-induce reduce the expression of target gene by cleavage and it was observed that the expression patterns of miRNA target genes generally show an inverse correlation with those of miRNAs. Therefore this negative correlation between target mRNA and miRNA accumulation if often considered proof of miRNA targeting (Fig. a). Moreover a miRNA restricts the expression of its target in the cell type where they are expressed. Indeed, the target gene is abundant in a cell type in which the miRNA is lowly expressed and vice versa (Fig. 1.8). Therefore, in order to investigate cell type stress response the analysis should be conducted at cell-type level instead at the whole organ (Bertolini, 2013; Jeong and Green, 2013).
Figure 1.8. Spatio-temporal effects of stress-regulated miRNAs on target gene expression. A.
Temporal regulation of target gene expression by stress-regulated miRNAs. Stress-induced miRNAs down-regulate the expression of their target genes during a given stress condition, while stress-repressed miRNAs up-regulate expression of their target genes during the stress condition. B. Spatial regulation of target gene expression by stress-regulated miRNAs. Stress-responsive miRNAs that are regulated in a cell type- specific manner can spatially restrict the expression of their targets in a particular cell or cell type (Jeong and Green, 2013
Various experimental and in silico approaches have been used to identify miRNA genes and their targets in plants. NGS revolutionized miRNAs discovery, providing an effective way to identify and profile small RNA populations in model and non model plants (Jiang et al., 2014) in a fast, accurate and less expensive way (Wu, 2014). Moreover, this approach provides a genome-wide view of interaction between miRNAs and their target genes. Indeed a computational prediction of miRNAs targets can be performed, based on complementary base pairing between the miRNA and its target. This target prediction requires an experimental validation. The most used technique is a modified 5'-RACE (Rapid Amplification of cDNA Ends) that allows to observe e the product of degradation after target cleavage by the miRNA. In the NGS era this validation approach is not sensitive due to the large amount of predicted targets produced by small RNA sequencing. Therefore, computational approaches were
developed that consent a global target identification and validation. The analysis of Parallel Analysis of RNA Ends (PARE) has been proposed for genome-wide identification of miRNA targets (Jeong and Green, 2013). Using PARE, also called degradoma analysis, target cleavage products can be cloned and sequenced. Moreover, the power of this methods is that it is possible to investigate site-specific cleavages at single-nucleotide level (Jeong et al., 2013).
In plants such as Arabidopsis, Brachypodium, rice and maize, several studies have described miRNA genes as well as their targets in a wide variety of tissues, developmental stages, and treatment conditions (Gentile et al., 2013). New miRNAs are deposited in miRBase (http://www.mirbase.org/), an online database of published precursor and mature miRNA sequences and annotation accessible since 2002. To date 28,645 precursor and 35,828 mature miRNAs from 223 species are available on the last release of miRBase database (miRBase release 21, June 2014,Van Peer et al., 2014).
1.5 Molecular regulation of leaf development
Leaves, the mayor organ where photosynthesis is performed, originate from shoot apical meristem (SAM), a small group of pluripotent stem cells that continuously divide and replenish themselves.The key functions of SAM is to maintain itself as a source of cells and to generate daughter cells that are displaced towards the meristem periphery and its base, where they enter specific differentiation pathways to form lateral organs (leaves and flowers) and the stem, respectively (Johnson and Lenhard, 2011). The pluripotent state of SAM is maintained by the activity of class I KNOTTED1-LIKE HOMEOBOX
(KNOXI) genes. When these genes are down regulated, it occurred a switch from an
indeterminate to a determinate fate in a small group of cells (founder cells) that loses indeterminacy and becomes the immediate precursor of the leaf primordia (Moon and Hake, 2011). The position of leaf primordium initiation is determined by local auxin accumulation. Usually these cells originate at the flank of SAM. Initially towards the outside cells form a peg, then divisions become localized to the margin between the upper and the lower side to form the leaf lamina (Kidner et al., 2010). During leaf growth three axes of development, proximo-distal, medio-lateral and adaxial-abaxial, are established and maintained throughout the entire process. The proximo-distal axis is
defined by the leaf petiole the lamina, the medio-lateral polarity is identified by the midvein and leaf margins. Whereas the adaxial–abaxial polarity is reflected in the two opposing sides of the leaf blade, which possesses cells with different functions: cells of the adaxial (upper) mainly conduct photosynthesis and cells of the abaxial (lower) part, with stomata, are specialized in transpiration optimized in gas exchange. This occurs concomitant with primordium outgrowth. This development is one of the main adaptations of land plants since it maximizes photosynthesis with a minimum water loss. (Pauline and Laufs, 2010).
Leaf development is extremely plastic and leaf size depends on genetic predisposition, leaf position and environmental conditions (Andriankaja et al, 2012).
During leaf growth two distinct, partially overlapping cellular phases can be recognized: cell proliferation and cell expansion. The rate and duration of these processes are responsible for the final leaf size. During cell proliferation, cells increase in size and accumulate cytoplasmic mass, and subsequently divide to form new cells. Subsequently, cells stop to divide and begin to increase cell size by cell expansion. During a transition phase, cell division first ceases at the tip of the leaf and gradually most cells start to expand from the tip to the base (basipetal direction). During cell expansion, most cells start to differentiate, however some cells, dispersed in the leaf and called meristemoids, continue to divide themselves and form stomatal guard cell (Gonzalez et al., 2012). Leaf development can be divided into three phases: primordium initiation, primary morphogenesis, and secondary morphogenesis. During primary morphogenesis the leaf grows largely by cell proliferation, while during secondary morphogenesis the leaf cells stop dividing and begin to expand. Secondary morphogenesis does not occur in all leaf cells simultaneously, rather it begins in the tip of the leaf and progresses toward the leaf base (Andriankaia et al., 2012).
The final size and shape of plant organ is under the control of developmental genetic programs exhibiting species-specific characteristic. Indeed leaf morphogenesis involves a coordinated regulation among transcription factors (TFs), small non-coding RNAs (sRNAs) and hormones. Insight into leaf growth control has largely been achieved through the characterization of mutants with specific defects affecting cell differentiation, proliferation and expansion (Johnson and Lenhard, 2011).
To date, a growing number of organ growth regulators have been identified. They influence cell proliferation and/or cell expansion in different moments and in different
cell types during leaf development (Gonzalez et al., 2012). Thus, several transcription factors (TFs) involved in important pathway of leaf growth were largely characterized and investigated, such as: AINTEGUMENTA, PEAPOD, JAGGED, BLADE ON
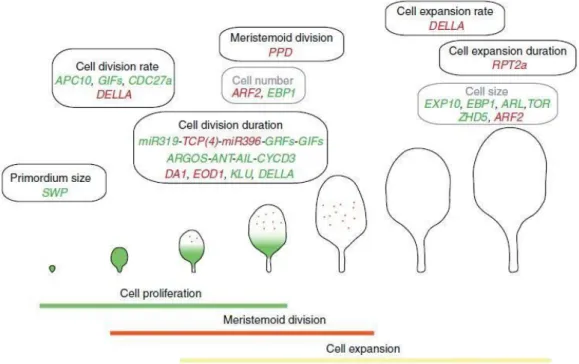
PETIOLE, TCPs, GROWTH REGULATING FACTORs (Fig.1.9).
Figure 1.9 Molecular mechanisms regulating leaf size. The different processes occurring during
leaf development (cell division and cell expansion) are represented. The different events that could influence the final leaf size (primordium size, cell division or expansion rate, cell division or expansion duration, and meristemoid division) and genes involved in positive (green) or negative (red) regulation are shown Abbreviations: SWP (STRUWWELPETER), APC10 (ANAPHASE PROMOTING COMPLEX10), GIF (GRF-INTERACTING FACTOR), CDC27a (CELL DIVISION CYCLE PROTEIN 27 HOMOLOG A), TCP (TEOSINTE
BRANCHED1/CYCLOIDEA/PCF), GRF (GROWTH-REGULATING FACTOR), ARGOS (AUXIN-REGULATED GENE INVOLVED IN ORGAN SIZE), ANT (AINTEGUMENTA), AIL (AINTEGUMENTA-LIKE), CYCD3 (CYCLIN D3), EOD1 (ENHANCER OF DA1-1), ARF2 (AUXIN RESPONSE FACTOR2), KLU (KLUH), EXP10 (EXPANSIN10), EBP1 (ErbB-3 EPIDERMAL GROWTH FACTOR RECEPTOR BINDING PROTEIN), PPD (PEAPOD), RPT2a (REGULATORY PARTICLE AAA-ATPASE 2a), ARL (ARGOS-LIKE), TOR (TARGET OF RAPAMYCIN) and ZHD5 (ZINC FINGER HOMEODOMAIN5) (from Gonzalez et al., 2012).
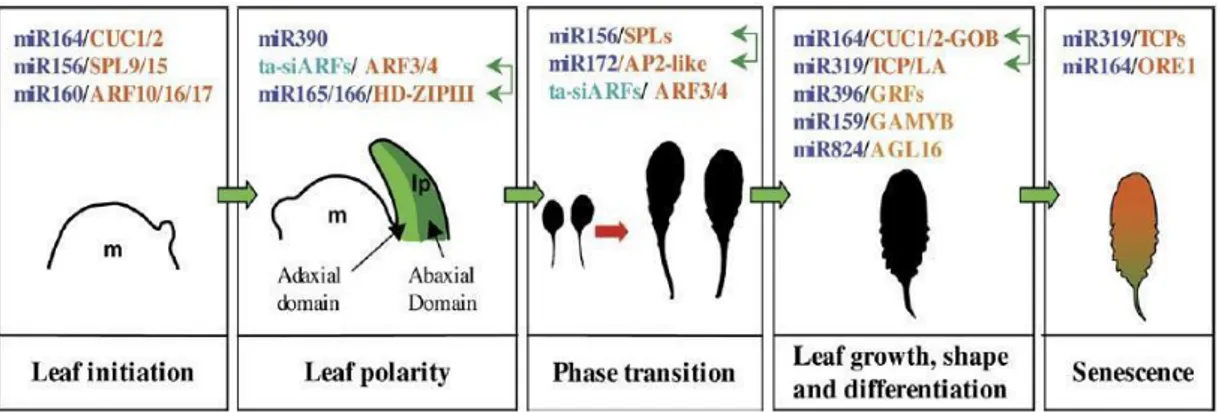
Furthermore, it has been demonstrated the determinant role of several miRNA families in the spatial-temporal coordination of developmental processes by targeting a subset of TFs. Clear examples are those of mir164, miR159, miR166, miR319, miR396 that target CUC, GAMYB, HD-ZIPIII, TCP, and GRF respectively (Fig.1.10).
Figure 1.10 Small RNAs and their targets regulate the different stages of leaf development from
initiation to senescence. MiRNAs and ta-siRNAs are in dark blue and light blue, respectively, and their targets in orange. Interactions between small RNA/target regulatory modules are shown by green double arrows. m, meristem; lp, leaf primordium (Pulido and Laaufs, 2010).
While several TFs underlying plant development and drought tolerance have been characterized, sRNAs have recently emerged as new regulator of leaf growth and development.
Plant hormones, such as gibberellin and auxin, play important roles in growth regulation. GAs is crucial in growth regulation, it stimulate cell division and cell expansion in leaves through the degradation of DELLA growth repressor, which inhibit leaf growth by altering cell proliferation and expansion. Similarly, in respond to auxin, the transcripion factors AUXIN RESPONSE FACTORS (ARF2) repress growth affecting cell division and cell expansion (Claeys et al., 2014). Regarding leaf development, auxin and cytockins are fundamental in the induction of leaf primordia. Auxin repress KNOXI genes expression promoting leaf differentiation from SAM. While cytockinins is required for maintenance the indeterminate group of cell in apical shoots Moreover KNOXI repress the expression of genes involved in GA biosynthesis and GA catabolism to maintain meristem (Blein et al., 2010).
1.6 Background information
Understanding the complex molecular mechanisms involved in plant stress response is crucial for future plant breeding programs, with the aim to develop new varieties
(genotypes) with better performance and a stable productivity.
When subjected to stress, plants rapidly reprogram their growth by not yet clatified mechanism, affecting cell number and size. To study the molecular basis underlining this process, particularly investigating monocot specific mechanism controlling leaf growth, we used Brachypodium distachyon as the biological model.
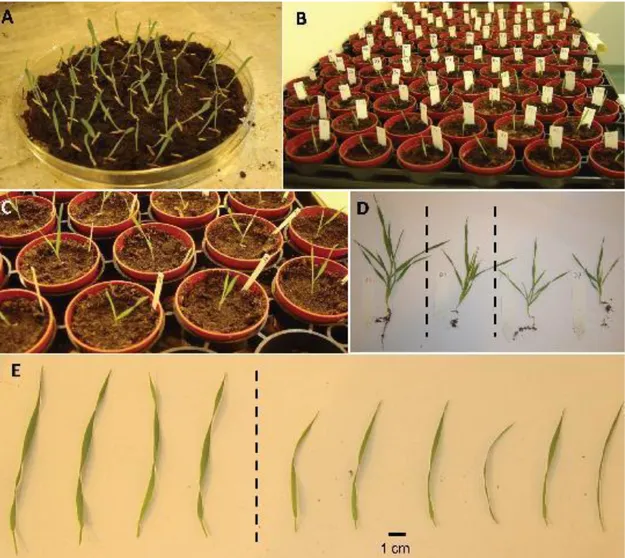
With the aim of investigating the molecular basis of drought stress response, Verelst et al. (2012) developed a reproducible soil drought assay for Brachypodium plants (Fig.1. 11). This experiment allows to collect Brachypodium third leaf and dissect, according to fluorescence microscopy analysis, three type of cells: i) proliferating cells, ii) expanding cells and iii) mature cells.
This drought stress experiment results in 40% of stressed third leaf size reduction in comparison to control leaves. Leaf growth reduction is primarily caused by a reduction in cell expansion instead of a reduction in cell number, highlighting the insensitivity of the meristem to drought stress. This result is in contrast with previous observation made in different plant model species (e.g. Arabidopsis and rice) in which cell division and cell expansion is inhibited by drought resulting in smaller size and number cells per leaf.
To deeper investigate the genetic network at the basis of this phenomenon at organ and cellular level, kinematic and DNA-chip transcriptome analysis were performed. Kinematic analyses of proliferating and expanding cells were conducted to assess growth rate of the leaf under optimal and stress condition, and to understand how the processes that operate at the cellular level contribute to difference in growth rates at the whole organ level. The analysis of the transcriptome of each development zone showed that each area responds differently to drought. This may lead to identify key genes involved mainly in stress response.
Bertolini et al. (2013) utilized this drought stress experiment to perturb leaf growth along proximo-distal axis to investigate the role of miRNAs on the molecular regulatory networks underlying leaf development.
Eight small RNA libraries from expanding and proliferating cells grown in control and stress conditions were produced and sequenced using NGS technology. By applying a customed ab initio pipeline, a total of 270 miRNA and miRNA-like genes were identified, confirming 66 previous annotations and adding 28 new genes to know MIR families. In addition, 94 novel species-specific miRNAs and 82 siRNA-like miRNAs
were discovered. Differential expression analysis showed that a large proportion of mRNAs seemed to be involved in developmental programming, while only a few miRNAs modulate their expression during stress response. To describe the biological function of annotated miRNAs miRNAs target prediction based on sequence similarity between the miRNA and mRNA was performed. This genome-wide analysis of small RNA molecules provided additional evidence for a role of miRNAs in the regulatory network controlling cell division in normal and stressed conditions and demonstrated that drought causes a genetic reprogramming of leaf growth in which miRNAs are deeply involved (Bertolini et al., 2013).
This combined approach of studying both the transcriptomic profiles of coding genes and the characterization of the small RNAs allowed to shed light on the interplay between the different components of the system that act to establish a new growth leaf reprogramming during drought stress. Moreover using Brachypodium as model plant it was possible to identify stress-tolerance genes.
Figure 1.11 A Reproducible Drought Stress Protocol for Brachypodium in Soil. (A) shows Bd21
seedlings which have germinated synchronously on wet soil in a Petri dish. In (B), all seedlings have just been transferred to individual pots and, in (C), the second leaf has appeared in all plants. In (D), representative Bd21 plants are shown after 20 d of growth in the soil-based system; the plant on the left had been grown under control conditions, the second plant from the left had been grown under moderate drought stress, and the two plants on the right under severe drought stress. Plants from all conditions remained healthy and continued growing, although drought stress greatly slowed down vegetative growth and development. The effect of moderate drought stress on the length of the third leaf is presented in (E): four representative control leaves (left) are compared to six representative leaves from stressed plants (right), harvested 16 d after transfer of the seedlings to soil. Apart from being shorter, their width was clearly also reduced, resulting in a much smaller leaf surface overall (from Verelst et al., 2012).
2 Research objectives
Food production is limited mainly by biotic and abiotic stress and in particular by drought stress, the most common environmental factor affecting plant growth worldwide. Understanding the molecular mechanisms of plant response to stress is crucial for future agriculture which has to cope the growing demand for food and feed. It was proposed that during drought stress response plants actively reduce their growth allowing to save and redistribute resources (Skirycz et al., 2010). To date underling mechanisms by which plants reprogram their growth are largely unknown. Therefore, it is important to dissect the molecular mechanisms that underlie drought tolerance in plants, in order to identify key regulators that are responsible for the drought-induced growth reduction.
The present project investigats the molecular mechanisms controlling leaf development, which has been shown to be extremely plastic and dependent on genetic predisposition, position, and environmental conditions by characterizing gene expression in leaf developmental zones of B. distachyon grown under severe drought stress. The project focuses specifically on the characterization of gene expression profiles of both coding and non-coding genes.
Deep sequencing of mRNAs, based on Illumina technologies, is applied to each developmental zone to obtain a complete picture of Bd transcriptome of young developing leaf subjected to drought stress. Cells in active proliferation, in expansion or that reached maturity are characterized both in stressed and controlled plants. The analysis of the whole transcriptome is expected to provide a comprehensive information on genome-wide transcription signals and genes differentially expressed during stress. This project takes advantages of small RNA-Seq data, previously produced by the lab, that allows the analysis of the small RNAs population and describse their expression patterns in proliferation and expanding cells. Combining the next generation sequencing data (mRNASeq and small RNA-Seq) possible wish to investigate the link between microRNAs and their target genes.
3 Material and methods
3.1 Drought stress treatment
The drought stress experiment was conducted on January 2013 in Milano (Italy).
Brachypodium distachyon inbred line 21 was grown under control and severe drought
stress conditions, following the droughtstress protocol described by Verelst et al. (2013). Specifically, before starting the experiment Bd21 seeds were air dried and stored at room temperature for 2 weeks and then moved to 4°C for at least 2 weeks. Subsequently lemma and palea, were removed prior to sowing. Seeds were sown in Jiffy soil in a large petridish and incubated at 4 °C for 2 days in darkness. Brachypodium seeds were transferred into a growth chamber, with 16 hours of light, 24°C and 55% relative humidity. After 3 days, all seeds germinated synchronously, the petridish lid was removed to let plantlets accustom to the ambient atmosphere in the growth chamber. The next day, each plant with only the first leaf were transferred to small plastic pots (5.5 cm diameter, 5 cm high), containing an equal amount of soil. At the time of plantlet transfer, all pots contained 2.27 g water per g dry soil. After the transfer of the seedlings, water was withheld from all pots. Pots containing control plants were dried down until 1.82 g g-1, while pots containing plants that would be subjected to drought stress were dried down to 0.45 g g-1 (severe drought stress). Pot weight was monitored every day, to compensate for evapotranspirative losses, adding water only to adjust the pot weight to the target level. Care was taken not to deposit the water in the direct vicinity of a plant, but rather on the outer edges of the pots, and watering always occurred at the same time during the afternoon, to not interfere with the time of most active plant growth (during the early morning hours).
Two to three days later the second leaf emerged in a highly reproductive manner, and another three days later the third leaf appeared. All plants grew synchronously, and the 3rd leaf (leaf3) of plants within the same experiment always appeared within a 24-h time window.
3.2 Plant material and leaf sampling for molecular analysis
All samples were collected from the third leaf Bd21 at fixed time point in the afternoon, about 24 h after the third leaf emergences. Hence, the growing third leaf , between 1.5 and 2 cm in size , was carefully collected from the leaf sheath of the older two leaves, without damaging the fragile meristem at its base. Samples were immediately stored in RNA-Later solution (Ambion, Austin, Texas). After an overnight incubation at 4°C, leaves were dissected into three distinct developmental zones (proliferating, expanding and mature). Based on microscopic observations, we defined the proliferation zone as the first 2 mm from the leaf base, the expansion zone as the next 4 mm, and the mature zone as the remaining distal part of the leaf. All the collected leaf zones were immediately frozen in liquid nitrogen and stored at –80°C until RNA extraction could be performed.
3.3 RNA extraction
Sample were grinded in liquid nitrogen using a mortar and pestle, total RNA was extracted from 100 mg of each tissue dissected from young leaf tissues using the Spectrum TM Plant Total RNA Kit (Sigma-Aldrich), following the manufactures's protocol .
RNA quality was evaluated by electrophoresis on 1% agarose gel. While RNA quantification was assesed using NanodropTM 2000 UV spectrophotometer (Thermo Fisher Scientific Inc., MA) at 260 nm and 280 nm using 1 μl of RNA for each sample. A total of 18 sample, were sent to IGA Technology Service (Udine) for RNA-Sequencing using the Illumina platform.
3.4 Illumina Library construction and Sequencing
RNA-Seq libraries were generated from each developmental zone for a total of 18 samples: three types of leaf cells (proliferation cells, expansion cells and mature cells) grown in control and drought condition, considering three biological replicates.
RNA-Seq libraries were constructed according to the Illumina protocol by IGA Technology Services (www.igatechnology.com). Brefly, mRNA is converted into first-strand cDNA using reverse transcriptase with either random hexamers and oligo (dT) as primers. The resulting first-strand cDNA is then converted into double-stranded cDNA, which is fragmented and ligated to Illumina adapters. The cDNA fragments are then amplified and sequenced using a sequencing by synthesis (SBS) approach.
Sequencing was performed at Applied Genomics Institute (IGA), Udine, Italy, using a 6-plex approach, producing 50 bp single end reads.
3.5 Bioinformatic analysis
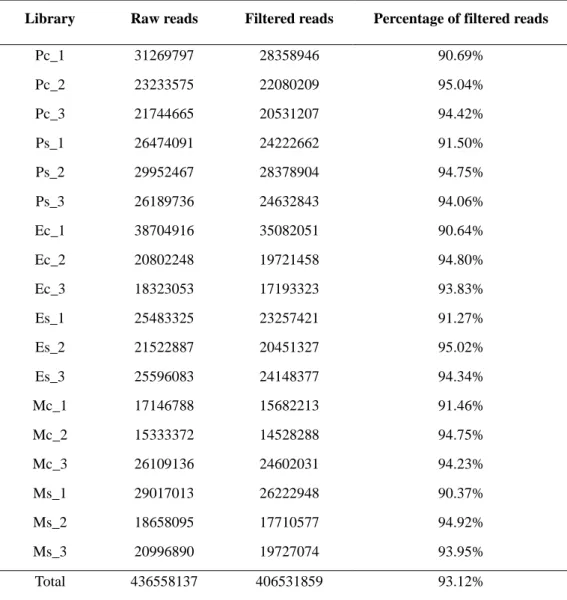
mRNA reads were trimmed using ERNE-FILTER (v.1.3) and only for the library number 14 Cutadapt (v.1.2.1) was used to remove the presence of adapter contaminants.
ERNE-FILTER was used to remove low quality bases from the ends of reads, setting a minimum Phred score of 33 and a minimum read length of 35 bp after trimming.
Filtered reads were then aligned to the reference genome version 2.0 of the 8x assembly of Bd21 and using the new annotation version 2.1, using the aligner TopHatversion 2.0.9 (Trapnell et al., 2010).
The following parameters were used for alignment: maximum number of mismatches = 0
minimum intron length = 10 maximum intron length = 500000 library type = fr-firststrand
Secondly, Cufflinks algorithm (Trapnell et al., 2010, version 2.0.9) was used to reconstruct cell or stress specific transcripts not yet annotated in the annotation file . Transcript quantification was achieved by counting the density of the reads that mapped to the exonic regions of a specific gene and reported as fragments per kilobase pair of exon model per million fragments mapped (FPKM).
Differential expression analysis was conducted testing two approaches: 1) Cuffdiff algorithm within the Cufflinks algorithm (Trapnell et al., 2010). Differential expression genes (DEGs) were determined considering a corrected p-value for multiple tests based on False Discovery Rate (FDR) adjustment < 5%.
2) DESeq2, available as an R/Bioconductor package at http://www.bioconductor.org
(Bioconductor project version 2.4, Gentleman et al., 2004), a methods for differential analysis of count data (Love et al., 2014). This tool is based on the negative binomial distribution that makes possible the evaluation of the raw variance of data from experimental design with small numbers of biological replicates.
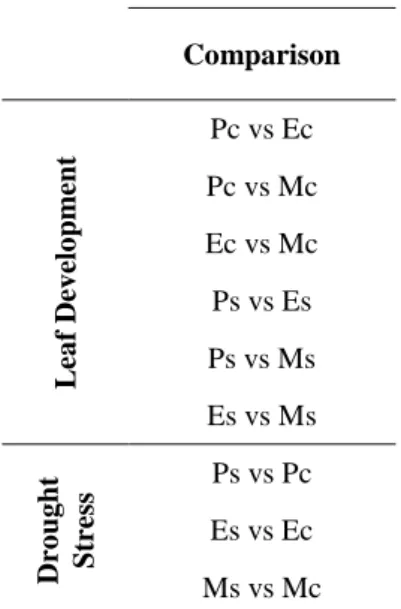
To identify differentially expressed loci between drought and control conditions in the same developing zone and during leaf development in the two growing condition , a series of pairwise comparisons were set up (Tab.3.1 ).
Comparison L ea f Dev elo pm ent Pc vs Ec Pc vs Mc Ec vs Mc Ps vs Es Ps vs Ms Es vs Ms Dro ug ht Str ess Ps vs Pc Es vs Ec Ms vs Mc
Table 3.1 List of parwaise comparison
performed during the analysis of differentially expressed loci. (P) proliferation, (E) expansion and (M) mature cells in (C) control and (S) drought stress conditions
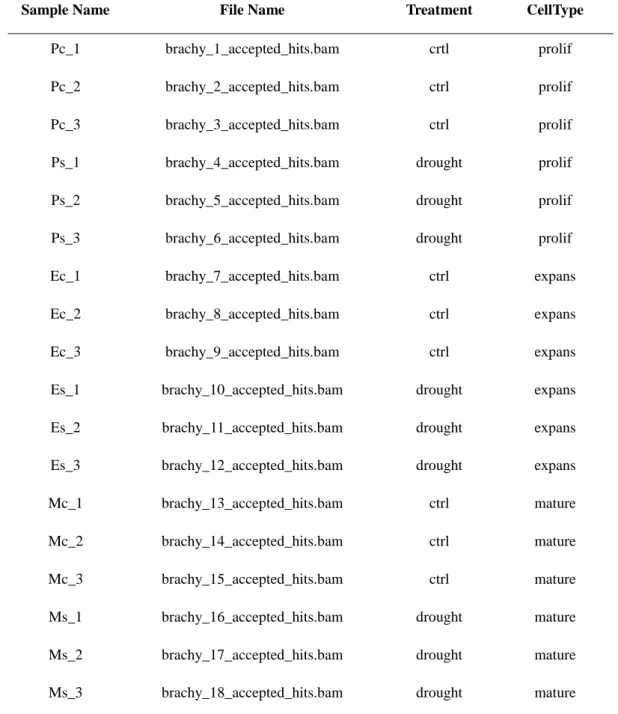
To better proceed with DESeq2, an experimental design (Tab.3.2 ) and a count matrix of mapped reads were generated. Hence, differential expression analysis were performed, considering a p-value ≤ 0.05 and a FDR ≤ 0.1.
To better investigate differentially expressed genes highlighted in the pairwise comparisons, a Gene Ontology (GO) enrichment was applied using the bioconductor package GOSeq (Young et al., 2010) available on Biocondutor platform were subjected to.
Sample Name File Name Treatment CellType
Pc_1 brachy_1_accepted_hits.bam crtl prolif
Pc_2 brachy_2_accepted_hits.bam ctrl prolif
Pc_3 brachy_3_accepted_hits.bam ctrl prolif
Ps_1 brachy_4_accepted_hits.bam drought prolif
Ps_2 brachy_5_accepted_hits.bam drought prolif
Ps_3 brachy_6_accepted_hits.bam drought prolif
Ec_1 brachy_7_accepted_hits.bam ctrl expans
Ec_2 brachy_8_accepted_hits.bam ctrl expans
Ec_3 brachy_9_accepted_hits.bam ctrl expans
Es_1 brachy_10_accepted_hits.bam drought expans
Es_2 brachy_11_accepted_hits.bam drought expans
Es_3 brachy_12_accepted_hits.bam drought expans
Mc_1 brachy_13_accepted_hits.bam ctrl mature
Mc_2 brachy_14_accepted_hits.bam ctrl mature
Mc_3 brachy_15_accepted_hits.bam ctrl mature
Ms_1 brachy_16_accepted_hits.bam drought mature
Ms_2 brachy_17_accepted_hits.bam drought mature
Ms_3 brachy_18_accepted_hits.bam drought mature
Table 3.2. Experimental design created for the differential expression analysis using DESeq2.
Ps: Proliferating cells under drought stress; Pc: proliferating cells under control conditions; Es: expanding cells under drought stress; Ec: expanding cells under control condition; Ms: maturation cells under drought stress conditions; Mc: maturation cells under control conditions. Biological replicates are indicated in the sample name column.
Moreover, to investigate the link between microRNAs and their putative target genes, mRNA-Seq data were interpolated with small RNA-Seq data, previously produced by the lab. These data analysis were conducted using R functions.
3.6 microRNA validation with 5'-RACE
To unambiguously diagnose endonucleolytic cleavage at the pairing sites between miRNA and presumptive targets, 5’ RACE PCR, was performed.
Target genes were selected based on the target prediction analysis published by Bertolini et al. (2013), moreover the expression data of both small RNA-Seq and mRNA-Seq were used to get indication on the sampled to be tested with the 5’ RACE PCR.Based on this observation, four target genes with opposite expression level to their miRNA and with important biological role in controlling cell proliferation were selected.
The first subset of genes subjected to target validation by 5'-RACE was : Bradi1g12650 Growth-Regulation Factor (GRF2) regulated by miR5049 Bradi1g14820 Cyclin (CycA3) regulated by miR166g
Bradi2g55320 Cell Division Cycle 6 (CDC6) regulated by R7754 Bradi4g16450 No Apical Meristem (NAM) regulated by miR164a
Primers were designed with Primer3 version 4.0.0 (Tab.3.3). For each gene two gene specific primers were designed to amplify the predicted miRNA binding site region. The total RNA was extracted from Brachypodium plants subjected to drought stress experiment in January 2013 at Milan (Italy). 5'-RACE was performed using the GeneRacer Kit (Invitrogen sing the GeneRacer® kit, catalog cumber: L1502-01) described by Kasschau et al. (2003). Two rounds of PCR were performed, first using the GeneRacer 5' Primer and Reverse outer gene specific primer followed by nested PCR employing GeneRacer 5' Nested Primer and gene-specific inner primer.
Amplified products were separated on 2% agarose gel electrophoresis and distinct bands with the appropriate size for miRNA-mediated cleavage were excised from the gel and purified through a DNA purification by centrifugation with Gel and PCR Clean-Up System kit (Promega). Purified products were subjected to PCR and electrophoresis agarose gel to verified the accuracy of the band height cut.
Primer Sequence (5'-3') Tm (°C) Gene Description
Fc+ GCTCATTATCAAGCCCTGTCTC 50
Bradi1g12650 Growth-Regulation Factor (GRF2)
Reverse out CCTGAACCTTCTGGACATGAATA 60.32
Reverse inn TGTCCTTACTGCTCTGCTGGT 52.38
Fc+ AGTATCCCAGCCTTTCTTTGG 59.60
Bradi1g14820 Cyclin (CYC)
Reverse out ATGCAGATACACCCTTGAActg 60.13
Reverse inn TTTCCTCCTGAGCTGCAAGT 59.13
Fc+ TTCCAAAGGATAGTGGTTTGTG 58.99
Bradi2g55320 Cell Division Cycle 6 (CDC6)
Reverse out TTTTTAATCAGCGAACAGTAAGGA 59.86
Reverse inn CCTCAAGGAAAAAGAGGTCTGA 59.37
Fc+ CAAGCCCTGATCTACAAGCAC 59.89
Bradi4g16450 No Apical Meristem (NAM)
Reverse out TCAGCATACTAAGGACGGCATTT 60.30
Reverse inn CAACAGCAACCTGTCCCTAGA 61.23
Fc+ CCTTTCATGTGACCATGTCTGT 59.89
Bradi4g30710 Tatraspanin (TETRA)
Reverse out TGGAGAGAAATACTCCCTTCGTT 60.36
Reverse inn TCGTTTCATAATTCATTCTTGTCG 60.47
Table 3.3. List of primers designed using Primer3. Fc+ = primer control positive; Reverse out = gene specific external primer; Reverse inn = gene specific inner