Ground displacements due to tectonics and gravity in
Corace River Catchment.
Gimigliano case study in Calabria Region (Italy).
Overview
This thesis aims to present some methodologies developed and new correlation among some parameters to analyse a basin river catchment with a view to constrain recent tectonic activity and ground deformation.
This work provides a detail detection of landslide-induced displacements at basin scale in Corace catchment and at local scale in Gimigliano site, Calabria Region. Also, this work presents the results of applying the matrix method in a Geographic Information System (GIS) to the drawing of maps of susceptibility to slope movements in different sectors of the Corace River Basin. This paper presents results obtained to assess the influence of active tectonics as one of the different determinant factor to be accounted for GIS landslide susceptibility mapping. This is made by an approach based on using different active tectonics geomorphic indexes related to the river drainage network, river basins and mountain front. These indexes are assessed in a GIS application and supported by field observations. Several landslide occurrences and the relationships of some controlling parameters with various events have been evaluated using GIS techniques and correlated with measured geomorphic indexes.
Regarding the active tectonic factor, the GIS analysis provides a significant correlation landslides occurrences . In general the observed instable zones are related to steep slopes in under excavated rivers resulting from deforestation, soil erosion and active tectonics. A higher frequency of landslides is related to areas with higher indexes of active tectonic in the eastern slopes of Corace Basin and also in, with high to very high of the active tectonic indexes values correspondence of Gimigliano Village. These correlations between density of landslides and active tectonics intensity, expressed by geomorphic indexes, suggest the usefulness of the integration of the active tectonics among the main determinant factors in landslide susceptibility assessment of the Gimigliano area which may be applied to similar areas around the world. The approach of this paper is to provide a quantitative method to focus on areas for more detailed work to establish rates of active tectonics. On this purpose, some geomorphic indexes were calculated in the whole area of Corace Basin catchment and seven third order river sub-basins. Some geomorphic indexes of active tectonics known to be useful in active tectonic studies were selected including:
• Stream length-gradient index (SL); • Drainage basin Asymmetry (Af);
• Hypsometric integral (Hi);
• Ratio Valley-floor weight to valley height (Vf); • Index of drainage basin shape (Bs);
• Index of mountain front sinuosity (Smf).
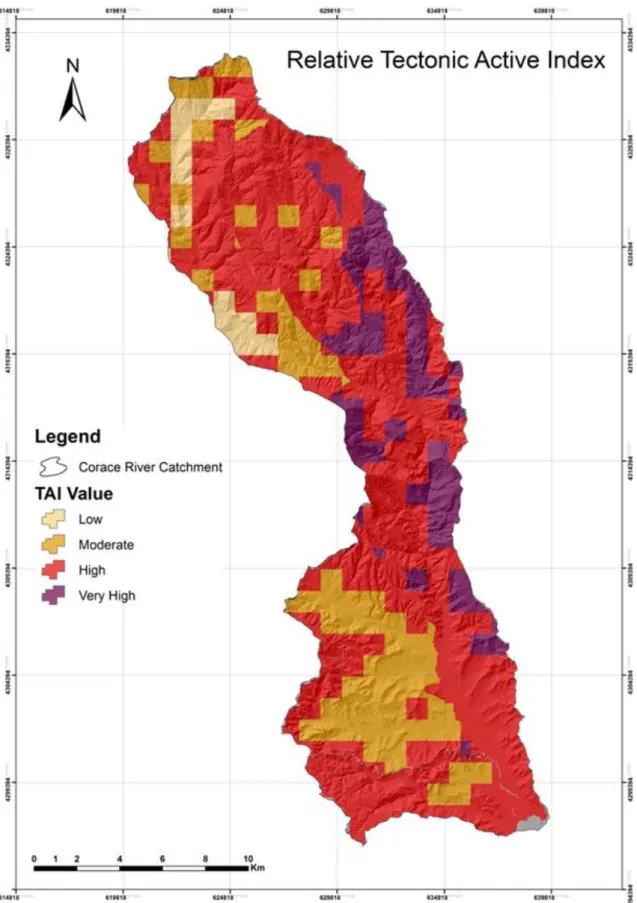
A method to evaluate an index over an area that represents relative tectonic activity (Ifat) it is present. The various indices is divided into three classes, with class one being high activity and class three being low activity. In order to develop an aerial index. Ifat is obtained by the average of the different classes of geomorphic indices and divided into four classes, where class 4 is very high tectonic activity class 3 is high tectonic activity class 2 is moderately active tectonics class 1 is low active tectonics.
The proposed GIS methodology allows a map showing relative tectonic activity of the landscape to be produced. This method has been linked to landslide susceptibility mapping . Finally the landslide susceptibility map for each landslide type are presented. Maps were validated, checking out degree of adjustment between landslide inventories and resulting susceptibility classes. The validation showed high correlations between new landslides and the available landslide susceptibility classes and degree of adjustment above 72% for high to very high susceptibility classes and below 10% for low to very low susceptibility classes, showing the usefulness of these landslide susceptibility maps to forecast future landslide areas.
By mean this research in the Gimigliano area it is possible to highlight that PS data are enable to detail and study spatial and temporal evolution of ground movements underling the capability for detecting, mapping and monitoring ground deformations.
Rock weathering of the outcropping sedimentary and metamorphic litotypes across time could be caused an increasing in ground displacement phenomenon.
Landslide events are complex geological and geomorphological processes due to a different factors and therefore it is very difficult to classify the existing one and predict the future occurrences. Aim of third section is the utilising of remote‐sensing data to detect and map landslides, to assess their activity and velocity. Also, to determine the spatial‐temporal variation of landslides and related consequences. InSAR techniques may improve towards to high robustness for landslides movement monitoring and it may be used as new methods for landslide mapping and inventory.
In order to assess any spatial and temporal patterns of deformation and to provide a detailed detection of landslide-induced displacements at local scale on Gimigliano site Sentinel 1 data acquired in October 2014 – October 2016 were compared with geological and geomorphological evidences resulting from auxiliary data such as landslide databases and orthophotos referred to different dates, finally validated with recent field checks. The applied approach demonstrated to
have a successful operative usefulness to support landslide susceptibility evaluation, since PSI technique has the potential to work in synergy with conventional geo-morphological tools and to improve the quality and the temporal reference of existing landslide inventories.
Remote sensing data by SAR interferometry (InSAR) have become a powerful tool for spatio-temporal monitoring ground movements such as subsidence, surface displacements due to landslides or tectonic activity, volcanism and anthropic processes in urbanized areas In the last decade, the methods for the detection of ground displacements by space borne synthetic aperture radar interferometry have greatly progressed. In the last few years differential interferometry of RADAR images has become one of the most accurate remote sensing techniques in assessing during natural or anthropically induced landslide activity related to natural hazard or natural resources studies. In particular Differential SAR Interferometry has become a very useful remote sensing tool for accurately measuring the spatial and temporal evolution of surface displacements over broad area. The analysis is focused on DInSAR results exploration of ground deformation. In the study of assessment of ground deformation it is useful to incorporate the study of active tectonic processes and estimation of the amount landslides.
First section
Geological and Geomorphological setting
Landscapes in tectonically active areas result from a complex integration of the effects of vertical and horizontal motions of crustal blocks and erosion or deposition by surface processes (Burbank and Anderson, 2001). As a consequence, geomorphic investigation in regions of active tectonics is a powerful tool for studies of tectonic geomorphology (Azor et al., 2002).
The aim of this study is to establish rates of active tectonics by using quantitative method to focus on areas for more detailed work. In recent studies related to geomorphologic and morphometric analyses of landforms and topographic analyses are utilized to obtain active tectonics (Della Seta et al., 2008).
It was used geomorphic indices of active tectonics, known to be useful in active tectonic studies (Bull and McFadden, 1977; Azor et al., 2002; Keller and Pinter, 2002; Silva et al., 2003; Molin et al., 2004).
Geomorphic indices applicable to fluvial systems in different regions and of varying size correlate with independently derived uplift rates (Kirby and Whipple, 2001) and are applicable to a variety of tectonic settings where topography is being changed (Bull and McFadden, 1977; Azor et al., 2002). All the measurements have been carried out by using drainages and contours extracted from DEM in GIS environment.
The study area is located in the Calabrian Arc (southern Italy), along the northeaster flanks of the Catanzaro Basin (Fig 1). The area is about 200 km2, located in the southeaster sector of Sila Piccola Massif (Fig. 1).
The Gimigliano area lies on Liguride and Calabride Complexes, including an important “tectonic window” made up of Mesozoic ophiolite rocks. The main lithotypes that cropout in the area are referred to metamorphic units (Ophiolite Unit) such as metabasites, serpentinites, and phyllites belonging to the Liguride Complex (Amodio Morelli et al., 1976; Liberi and Piluso, 2009), tectonically overthrusted by metamorphic and crystalline rocks (Calabrian Complex) such as orto- and para-gneisses (Messina et al., 1994; Tansi et al., 2007).
The geomorphologic setting is characterized by widespread slope movements. Diffuse landsliding with occasional deep-seated gravitational slope deformations have been recognized in the whole area (Sorriso Valvo & Tansi, 1996; Gullà et al., 2005) . The overlap of recent and past cartographic maps evidences that the area results already affected by hydrogeological hazard.
Chapter One
Geological and structural setting
1. Geological and structural regional setting of the study area
The study area is in the southern Italy along the northeaster flanks of the Catanzaro Basin. The area is about 282 large, located in the southern sector of Sila Piccola Massif (Fig. 1).
A number of tectonic units belonging to the Calabrian Arc constituted, from bottom to top, by: • Ophiolite Unit (“Gimigliano Unit” of Amodio-Morelli et al., 1976). A HP-LT metamorphic serpentinite-metabasite polychrome schist-Calpionella limestone sequence (Tithonian-Neocomian).
• Slate and metapelite Unit. Dominantly foliated slates, black metapelites and metasilts, interbedded with quartzite strata defining isoclinal folds, and red mudrocks and thin levels of laminate marble (Paleozoic-Mesozoic). According to Ogniben (1973) and Amodio-Morelli et al. (1976), these terranes should be ascribed to two distinct units: the Mesozoic Frido Unit, and the Paleozoic Bagni Unit, belonging to two distinct complexes. The first (of oceanic origin) was, in fact, ascribed to the Liguride Complex, while the second (of continental origin) to the Calabride Complex.
Above these units, the following are to be found:
• Orthogneiss Unit (Castagna Unit of Amodio-Morelli et al., 1976). Made of mylonitic augen-gneiss, micaschist, and subordinately marbles (Paleozoic).
• Paragneiss Unit (Monte Gariglione Unit of Amodio-Morelli et al., 1976; Sila Unit of Messina et al., 1994). Made of high-grade metamorphic rocks (biotite-sillimanite-garnet gneiss), intruded by plutonic bodies (Paleozoic).
From a geological viewpoint, the Catanzaro Basin is a graben-like structure bordered by normal faults (with a typical 120° northward orientation (Tansi et al., 2007; Tripodi et al., 2013). Late Miocene evaporite and clastic sequences (Critelli, et al., 2013) and Lower Pliocene to Middle Pleistocene sediments fill the Catanzaro Basin to form a ca900 m thick succession. The Pliocene-Pleistocene sedimentary succession of this basin consists in deep-water mudstones passing upward to sub-littoral siltstones; the upper transgressive interval is represented by silici/bioclastic mixed arenites, grading upwards into open-marine siltstones and clay (Critelli et al., 2013; Longhitano et al., 2012; Longhitano et al., 2014). Finally, the entire succession is overlain by Middle to Upper Pleistocene deposits (Brutto et al., 2016), from marine to continental , that have been removed in some areas by intense erosional processes.
Figure 1 Schematic tectonic map showing the main Middle Miocene-Middle Pleistocene left-lateral strike-slip lineaments of central-northern Calabria (after Van Dijk et al., 2000, modified). Key: (SLFZ) Soverato-Lamezia Fault Zone; (CAFZ)
Catanzaro-Amantea Fault Zone; (ACFZ) Albi-Cosenza Fault Zone; (SDFZ) Sellia-Decollatura Fault Zone; (OCFZ) Ospedale-Colosimi Fault Zone; (FCFZ) Falconara-Carpanzano Fault Zone; (PSFZ) Petilia-S. Sosti Fault Zone; (SRFZ) S.
Nicola-Rossano Fault Zone. Dotted polygon indicates the study area.
A Middle Miocene-Middle Pleistocene regional NW-SE left-lateral strike-slip fault system profoundly conditioned the evolution of central Calabria, during the late tectonic phases (Van Dijk et al., 2000; Tansi et al., 2007). This system dissected an Oligocene-Early Miocene orogenic belt, made up of Alpine nappes overthrusted on the Apennine Chain (Amodio Morelli et al., 1976; Critelli et al., 2013) .
In the sectors of overlapping of the faults, the transpressional regime induced tectonic extrusions of the deep-seated units of the Chain, producing push-ups within the overlying crystalline-metamorphic complexes. In the sector of fault overstepping, the primary geometric relationships among the units of the orogenic belt were locally altered (Van Dijk et al., 2000, Tansi et al., 2007).
In particular, push-ups structures, induced by strike-slip crustal faults, made up of the ophiolite unit are the main tectonic setting of the Gimigliano area.
These fault systems characterized and conditioned the Pliocene-Lower Plestocene evolution of whole area and also influence the tectono-stratigraphic architecture of the Catanzaro Basin. The
Middle-Upper reactivation of the major faults with normal kinematics is result still active as resulted by historical and strumental earthquakes (Monaco and Tortorici, 2000; Tansi et al., 2007).
The outcropping rocks show a stone behaviour, even if schistosity and jointing lead to the formation of deep granular layers that turn out to be geotechnically soft and highly erodible.
The area of study interest is located in Gimigliano municipality (Catanzaro province, CZ) in Calabria Region (Italy).
From a tectonic point of view, the metamorphic nappes show tectonic contacts marked by pre-Neogene sub-horizontal thrusts, striking NE-SW, displayed by the pre-Neogene-Quaternary regional NW-SE transpressive fault zones. In particular, the Gimigliano ophiolite outcrops are placed in the transpressional sector, developed between the regional Amantea-Gimigliano Fault and a couple of minor Neogene-Quaternary left- lateral strike-slip NW-SE oriented faults, extending from Gimigliano Inferiore village to Cavorà. Gimigliano village is located on a “flower structure” belonging to a push-up system according Tansi et al., 2007.
The transpressional mechanism also dragged up deep-seated units towards SE the Gimigliano site, where ancient thrusts separate the “Ophiolite”, the “Slate and Metapelite” and the “Orthogneiss” Units (Van Dijk et al., 2000; Tansi et al. 2007). The well-structured fault zones generate many wide cataclastic zones characterized by weathered and intensively fractured rocks. The outcropping rocks show a stone behavior, even if schistosity and jointing lead to the formation of deep granular layers that turn out to be geotechnically soft and highly erodible.
The Gimigliano ophiolite outcrops (Colonna and Piccarreta, 1975, 1977; Rossetti et al., 2001) consist of metabasite and serpentinite belonging to the basal portion of the Calabrian Terranes. They are located in the tranpressional sector induced by the interaction between the Amantea-Gimigliano Fault and a couple of minor left-lateral strike-slip faults belonging to the NW-SE regional fault system (Van Dijk et al., 2000).
The Catanzaro Basin is a graben-like structure bordered by normal faults (Tansi et al., 2007; Tripodi et al., 2013; Brutto et al., 2016). A Middle Miocene-Middle Pleistocene regional NW-SE left-lateral strike-slip fault system profoundly conditioned the evolution of central Calabria, during the late tectonic phases.
From the Neogene to Quaternary combined with the progressive migration of Calabrian Arc overthrusting occurred along a NW-SE to WNW-ESE-trending regional strike-slip fault system characterized by left- and right-lateral movements in the northern and in the southern sector of the Calabrian Arc, respectively (Ghisetti and Vezzani, 1981; Rehault et al., 1987; Turco et al., 1990; Knott and Turco, 1991; Monaco and Tansi, 1992; Catalano et al., 1993). The fault system
constitutes a regional shear zone, dissecting the pre-existing thrust sheets, and played an important role in the Neogene-Quaternary geodynamic evolution of the Central Mediterranean area.
These systems were characterized and lead Plio-Quaternary evolution of whole area and also were influence the tectonostratigraphic architecture of Catanzaro Basin configuring it as grabens or half-grabens. Tectonic context is dominated by strike-slip tectonics, lasting from Late Miocene to Quaternary (and, presumably, still active) in which late emplacement mechanisms of the deep-seated Mesozoic carbonate rocks, and their geometric relationships with the overlying units of the Calabrian Arc are led by the development of the area. Since Middle Pleistocene, the reverse kinematics of faults were reactived by extensional tectonics. As a consequence, several cases either of deep-seated gravitational or tectono-gravitational accommodation of pre-existing reverse faults have been recently documented in Calabria (Iovine et al., 1996; Iovine and Tansi, 1998; Sorriso-Valvo et al., 1998; Tansi et al., 2005a,b): such a reactivation mechanism could also explain some of the normal kinematic evidence.
The Lamezia-Catanzaro fault is placed in the context of NW-SE left-lateral strike-slip fault system; this master fault belongs to a wider and broader system, Amantea-Gimigliano, characterized by vertical displacement accumulated in Neogene-Quaternary higher than 1000m.
The Amantea-Gimigliano Fault extends from the Tyrrhenian Sea (where it bounds the south edge of the Coastal Chain) towards SE, cutting through the southern margin of the Sila Massif. At its westernmost end, it separates Late Miocene deposits from the Slate and metapelite Unit (Fig 1). Along its middle portion, the fault delimits, to the south, an elongated outcrop of Sheared basement remnants from the Slate and metapelite Unit. This fault segment roughly corresponds to the Catanzaro-Amantea Fault Zone recognized by Van Dijk et al. (2000).
The topographic elevation of the study area has an average value of 260 m a.s.l. and a maximum value of 1427 m a.s.l. The slope gradients computed from the DEM range from 0 to ~83 degrees, while the average is approximately ~18 degrees (Fig.2).
Figure 2 Morphometric parameteres: topographic elevation of the study area has an average value of 260 m a.s.l. The slope gradients computed from the DEM range from 0 to ~83 degrees.
Corresponding on Gimigliano area a push-up structure was recognized. Here, deep-seated serpentinite and overlying metabasite are overthrust by the Orthogneiss Unit and the Slate and Metapelite Unit bounded by a NNE-striking W-verging thrust. In southeast side metabasite overthrusted the Slate and metapelite Unit bounded by a NNE-striking E-verging thrust.
In particular, push-ups are either made of ophiolite. In these sectors, the primary geometric relationships among the units of the orogenic belt were locally altered (Van Dijk et al., 2000, Tansi et al., 2007). deep-seated units of the Chain of Gimigliano were dragged up and ancient thrusts separating the Ophiolite, Slate and metapelite and Orthogneiss units crop out.
The push-up developed between the Amantea Gimigliano Fault and a minor left-lateral strike-slip fault extending from Gimigliano Inferiore to C.da Cavorà.
The transpressional mechanism also dragged up deep-seated units towards SE Gimigliano site, where ancient thrusts separate the “Ophiolite”, the “Slate and Metapelite” and the “Orthogneiss” Units (Van Dijk et al., 2000; Tansi et al. 2007).
This region of Calabria is known as one of the most landslide-prone areas in Italy due to its geological and climatic characteristics (Antronico, Sorriso-Valvo, Tansi, & Gulla`, 2001; Antronico et al., 2013; Gulla` et al., 2008)
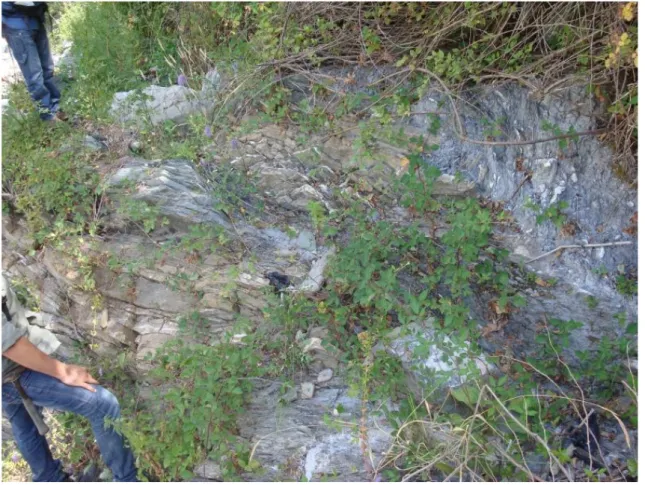
Figure 4 Grey phillites quarzite and meta-limestone alterncance due to sub-vertical isoclinal folds.
Figure 5 On the left, phyllites meta-limestones; on the right, detail of metacalcarenti in which the original texture is recognizable.
Figure 6 Overview of the left side of the Corace river cachment; ophiolite units affected by folding, the core area is occupied by serpentinite and metabasite is visible while the carbonate-silicoclastica. Metacalcari coverage and phyllites are verticalized
Chapter Second
Geomorphological setting
1. Geomorphological setting
Geomorphological survey aims to characterize geomorphological setting of a wide area in Calabria Region, in southern Italy.
An accurate identification of unstable slopes and an exhaustive landslides inventory map, based on aerial photog interpretation and conventional field geology survey, was carried out.
Geological structure deeply controls geomorphological context: structural discontinuities and variation in erodibility of different lithotype influence the hydrography and the whole landscape. The geomorphologic setting of the study area is characterized by widespread slope movements. Diffuse landsliding with occasional deep-seated gravitational slope deformations have been recognized (Fig. )The overlap of recent and past cartographic maps evidences that the Gimigliano area was always affected by hydrogeological hazard. Geological structure strongly influences geomorphological context. Hydrographic network and landscape are conditioned by structural discontinuities and erodibility changes of outcropping lithology. Geomorphological field observations of the north western area of Catanzaro Basin were carried out using a 1:10.000 scale topographical map (Fig. 7). The Corace River catchments suggests typical subsequent relation among erosional processes and structural discontinuities. Corace Stream is a 7th order basin (Fig. 8) and has two 6 order tributaries, 5 fifth tributaries and 32 fourth order tributaries (Tab.1 ). It is flanked by the Sila Piccola Massif in the North, in south, Catanzaro straight in the west, Serre Massif in the east and Ionian Sea in south. This river basin is elongated in north-west direction and the river follows a straight line course there by manifesting tectonic control on the stream development. The drainage pattern is subdendritic to sub parallel, in general, and the higher order streams, in particular, show more or less trellis drainage pattern. Most of the higher and medium order streams follow general structural trend which indicates structural control.
The tributaries are oriented in the WNW-ESE, N-E directions in the upper portion and NNE-SSW directions in downer portion and most of the tributaries are short in length and align perpendicular to the main stream.
The basin is confined and has a restricted north-south development. In general right bank of the basin is more elevated and receives more tributaries than the left bank . Elevation of study area varies between 0 m and 1435 above sea level. (Fig. 2 ). Lithostructural conditioning is evident in the section immediately above the town of Gimigliano, where the NE-SW trend of Corace River suggests the presence of an anticlinal.
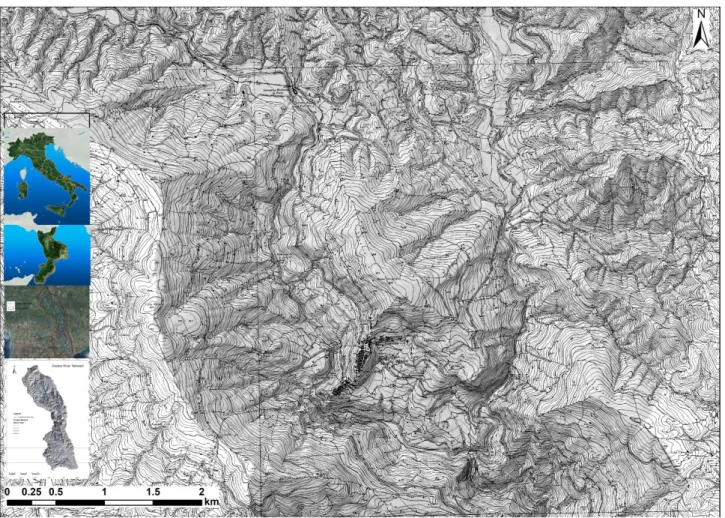
Figure 7 Geomorphological field observations of the north western area of Catanzaro Basin were carried using 1:10.000 scale topographical map. In particular Gimigliano Municipality.
Basin Square kmq Perimeter Km Higth m Maximum H m Mean H m Corace 295 113 1 1385 565
Fiume Corace from the confluence with the
Borgia Fiumarella up to its closing point. 3.5 9 1 99 32
Fiumarella di Borgia 19 27 13 375 229
Fiume Corace from the confluence with
Torrente Usito and Fiumarella di Borgia 16 17 12 369 80
Torrente Usito 22 24 39 350 162
Fiume Corace from the confluence with
Fiume Fallaco and T. Usito 10 15 37 225 103
Fiume Corace from the confluence with F.
Melito and F. Fallaco 31 31 51 800 349
Fiume Fallaco 36 29 53 620 200
Fiume Corace from the confluence with F.
Pomo with Fiume Melito. 13 17 350 930 655
Fiume Melito 41 43 360 1322 858
Fiume Pomo 44 33 567 1381 970
Fiume Corace from start poin and
confluence with Fiume Pomo 59 48 575 1385 881
Figure 8 a-b Corace Stream is a 7th order basin and has two 6 order tributaries, 5 fifth tributaries and 32 fourth order tributaries (Tab.1 ). It is flanked by the Sila Piccola Massif in the North, in south, Catanzaro straight in the west, Serre
Massif in the east and Ionian Sea in south. c Corace ipsometric Curve.
The morphology of the range reflects a dynamic equilibrium between present-day tectonics and surface processes.
On the southeaster portion of Gimigliano municipality a antiformal fold is recognized (Van Dijk et al., 2000; Rossetti et al., 2004). Tectonic control is also evident on south side of Gimigliano municipality in correspondence of the Melito River confluence. Some large landslides involved more erodible lithology (Fig.9 ).
Although also the Melito River is conditioned by the geological structure and in particular variations of erodibility in the stretch upstream of the confluence with the Corace River: this main tributary is oriented NE-SW, corresponding to a significant structural discontinuity.
Immediately downstream of the confluence with the Fosso Patrone, the Melito River cuts across the anticline structure of the area of up to the confluence with the Corace River, thereafter the main stream follows quite closely the axis of the anticline structure.Base levels on the flanks of the range
Order Numbers Length km
1 3110 689 2 724 277 3 158 146 4 32 59 5 6 67 6 2 22 7 1 10 a b c
may be controlled by either the tectonics of the underlying thrust fault or by external conditions related to sediment deposition or erosion by the fluvial system.
Figure 9 Tectonic control evidents on south side of Gimigliano municipality in correspondence of the Melito River confluence. Melito River is conditioned by the geological structure and in particular variations of erodibility in the stretch upstream of the confluence with the Corace River: this main tributary is oriented NE-SW, corresponding to a significant
structural discontinuity.
The terraces provide good constraints on incision rates across the Monte Gimigliano frontal folds where rivers are forced to cut down into rising anticlines and have abandoned numerous terraces. Sediment yield derived from the measurement of suspended load in the Corace River basin suggests that fluvial incision drives hillslope denudation of the landscape at the scale of the whole range. These hydrographic and orographic phenomena unconformity is probably due to phenomena of river network superimposition. Path stream network has preserved during this first incision phase despite the possible lithostructural control.
Low gradient paleosurface that represents an old local base level was recognized at altitude reach from 600 to 650 m above sea level and the velocity and eroding power of the water was temporarily lost. This slope failures suggest a steady state of incision processes, responsible of erosion of the paleosurface.
The topographic area is 294 km2 extended and presents an elongated shape. The upper reaches of the basin, with elevation ranging from 700 to 1000 m asl, are made up of conglomerate rocks. The gravels are constituted of metamorphic rock fragments and are highly permeable and resistant to
erosional processes. In the lower reaches the source rock lithology changes to silts clays interbedded with silty and sandy marine deposits. The Corace river-mouth is constituted of sediments varying the texture from granules to cobbles.
Carta geologica 25000 faglie idrotuttutooooo
2.
Climate
The study area (Calabria region) is a peninsula in Italy (Figure 1) with a high climatic variability due to its geographic position and its mountainous nature (Buttafuoco et al., 2001a). In fact, in Calabria orography controls the rainfall amount and distribution over the region and the interaction between the orography and mesoscale circulations leads to a precipitation gradient between the Tyrrhenian and Ionian side of the Calabrian peninsula. In particular, the Ionian side, which is influenced by currents coming from Africa, has high temperatures with short and heavy precipitation, while the Tyrrhenian side is influenced by western air currents and presents milder temperatures and considerable orographic precipitation. In the inland zones there are colder winters (with snow) and fresher summers (with some precipitation) than those marking the costal zones (Buttafuoco et al., 2011b). Large-scale patterns play a role in the type of storms affecting this region; in fact, western Calabria is more exposed to storms originating in the lee of the Alps, while eastern Calabria is more exposed to African storms (originating in the lee of Atlas and propagating toward the central Mediterranean). The influence of the Azores anticyclone in summer favours a rather dry and temperate climate, while breeze circulations develop on the coast and inland. In the other seasons, Mediterranean cyclogenesis affects Calabria.
The precipitation data was prepared using the last 10 years (2006–2016) of historical rainfall data. In our methodology we used long-term precipitation for a 30 year period. An average annual rainfall contour map is mapped out from the daily rainfall data measurements. Also, the IDW method using Gis Software was used for spatial interpolation on the contour maps. IDW interpolation explicitly implements the assumption that things that are close to one another are more alike than those that are farther apart. To predict a value for any unmeasured location, IDW will use the measured values surrounding the prediction location. Those measured values closest to the prediction location will have more influence on the predicted value than those farther away. Thus, IDW assumes that each measured point has a local influence that diminishes with distance. It weights the points closer to the prediction location greater than those farther away, hence the name inverse distance weighted. The annual average rainfall depth is about 1500 mm. (Fig.10)
Figure 10 IDW Map of precipitation. It assumes that each measured point has a local influence that diminishes with distance. It weights the points closer to the prediction location greater than those farther away, hence the name inverse distance
weighted. The annual average rainfall depth is about 1500 mm. 1339 450 1348 1486 1151 1132 1204 1144 912 1164 1125 1371 602 1151 933 1659 2050 1479 1155 1372 V iv o li R o cc e lle tta C ar lo p o li Fi o re n za Umb ri O liv e lla G imi gl ian o Bo rg ia Ti ri o lo M ar ce lli n ara C ar af fa Se rr astr e tta C atan zar o Sa n t' El ia Sta le tti D e co llatu ra M ar ti ran o M ig lie ri n a V e n a d e M ai d a So ve ri a S ime ri Pluvio_Station
3. Slope Instability
Calabria Region is known as one of the most landslide-prone areas in Italy due to its geological and climatic characteristics (Antronico et al., 2001b; Antronico et al., 2013; Gullà et al., 2008; 2009). Geomorphological survey aims to characterize geomorphological setting of a wide area in Calabria Region.
An accurate identification of unstable slopes and an exhaustive landslide inventory map based on aerial photointerpretation and conventional field geology surveying including the slope-rupture zone and the downward zone of mass accumulation was carried out.
In order to delineate geomorphological features such as scarps, landslide masses and related features an initial survey was made using 1:33.000 aerial photos from 1995 to 1998 provided by Military Geographic Institute-IGM. The field observations were plotted on a 1:10.000 topographical map and the mapped informations were digitalised and introduced into a GIS database.
A geomorphological analysis of the land morphology temporal evolution was performed through a set of aerial photographs, referred to the period from 1991 to 1994. Orthophotos analysis is exploited to identify geomorphologic evidences, soil erosion indications, anomalies or differences in vegetation coverage, allowing the possible identification and mapping of ground instabilities and land movements. Photointerpretation of optical aerial and satellite images is a traditional tool for geomorphological studies; its combination with topographic maps or DEM layers facilitates the recognition of counter slope variations as landslide indicators and the delimitation of the geometry of unstable areas.
The geomorphologic setting is characterized by widespread slope movements. Diffuse landslides with occasional deep-seated gravitational slope deformations have been recognized in the whole area. The overlap of recent and past cartographic maps evidences that area already affected by hydrogeological hazard (Fig.11 a-b).
Geological structure deeply controls geomorphological context: structural discontinuities and variation in erodibility of different lithotypes.
Figure 11
a. Overview of the Gimigliano landslides system.
b. The landslide on the right affects the entire town and has a translational kinematics with low rotational component. The landslide on the left shows a more pronounced rotational component.Widespread slope movements. Diffuse land sliding with
occasional deep-seated gravitational slope deformations have been recognized in the whole area.
a
Second section
Impact Factor of Active Tectonics as determinant factor in GIS
susceptibility landslide mapping
Using and developing of GIS provide a powerful tool for spatial data analysis and management in almost all the science disciplines, above all structural geology, tectonics, geomorphology, etc. GIS allows not only representing data, but also performing geostatistical analysis and building models. In geomorphology, the traditional use of GIS capabilities can be found in works that require multi-criterium analysis.
All of the analyses require the combination of different spatial data in addiction with statistical analysis. GIS is becoming a powerful tool to evaluate tectonic geomorphology and landscape evolution linked to the recent tectonics of the area. Activity of folds and faults can be assessed by the analysis of drainage network and the evaluation of geomorphic indexes. Through the application of new GIS-based methodologies for drainage network and landscape analysis it is possible to reach a better understanding of the tectonic activity and landscape evolution. The technologies that GIS provides to perform statistical analyses, as well as the great availability of high-precision DEM, have allowed the advance in the field of geomorphic indexes. It is possible to extract river networks with stream gradients and catchment areas from DEM. The analysis of drainage networks is a powerful tool to detect recent tectonic activity and uplift (e.g. Ouchi, 1985; Clark et al., 2004) as river channels are very sensitive to changes in the parameters that control their shape and gradient (e.g. Whipple and Tucker, 1999; Korup, 2006).
By means of geomorphic indices it is possible to detect landform responses to tectonics and therefore it have been broadly used to investigate tectonic geomorphology (El Hamndouni, 2008). Active deformation that may affect the topography in this region can be quantified using geomorphic indices.
Geomorphic indices are capable of detecting landform responses to tectonics and therefore have been broadly used to investigate tectonic geomorphology (Keller and Printer, 2002; Chen et al., 2003; Kobor and Roering, 2004; El Hamdouni et al., 2008).
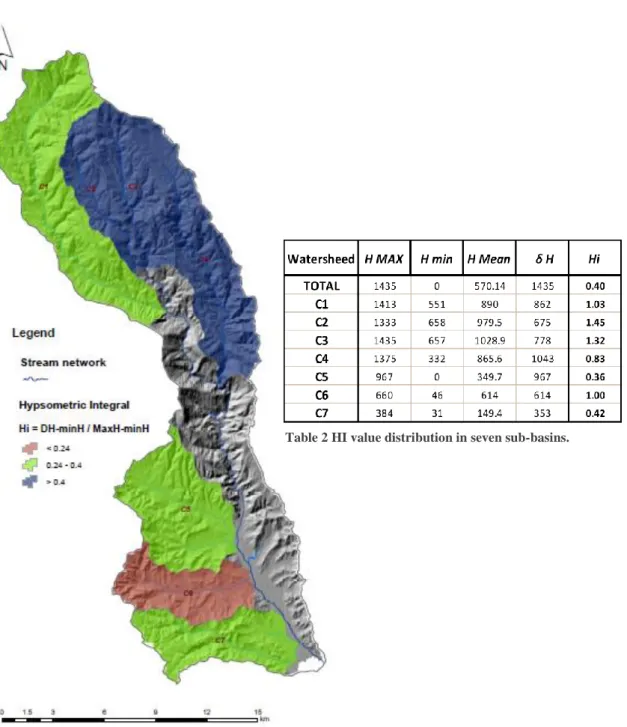
The present study is based on the calculation of five geomorphic indices: Hypsometric integral (Hi), Stream-length gradient index (SL), asymmetry factor (AF), drainage basin shape (Bs), valley floor width-to-height ratio (Vf) and Index of mountain front sinuosity (Smf) for seven sub-basins of the Corace river basin. All the measurements have been carried out by using drainages and contours extracted from DEM in GIS environment.
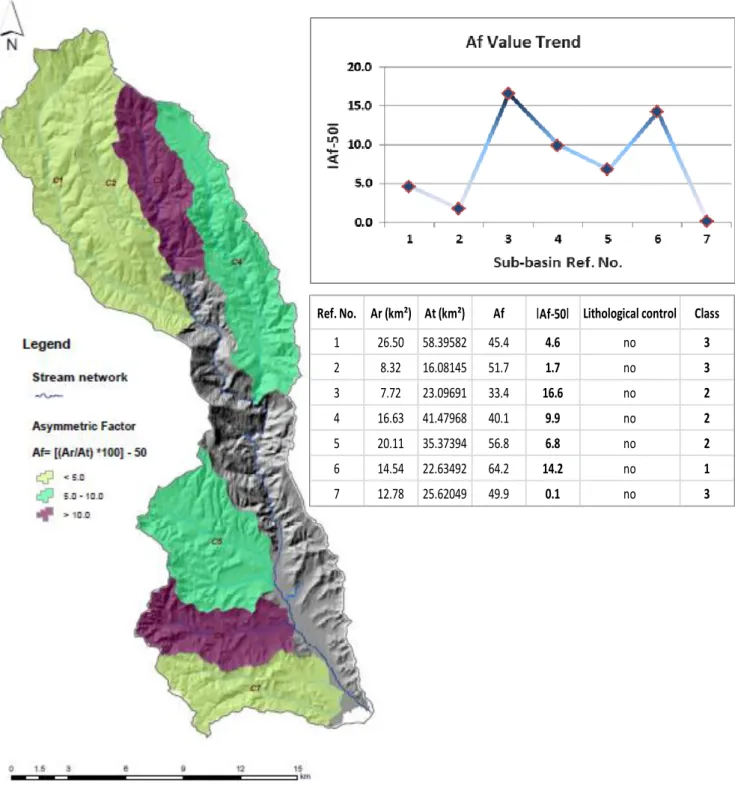
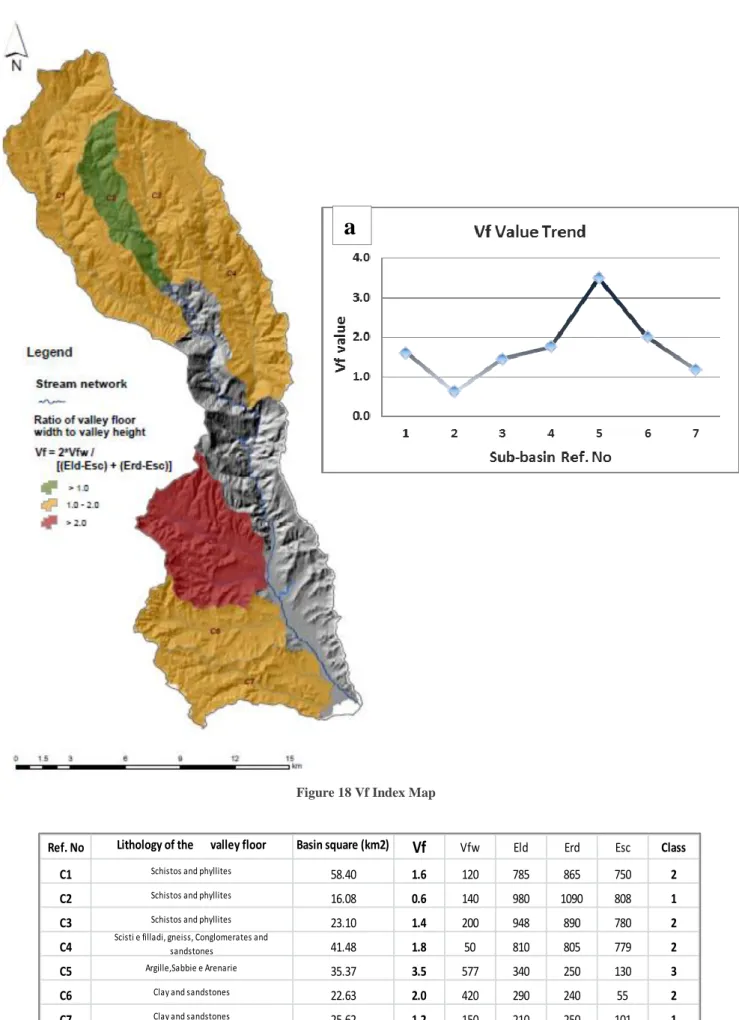
A high value of SL index near the Gimigliano municipality, expresses lithological changes in metabasites, serpentinites, and phyllites of the Liguride Complex tectonically overthrusted by metamorphic and crystalline rocks of the Calabrian Complex, such as orto- and para-gneisses. (Tansi et al., 2007) The outcropping rocks show a resistant behaviour, even if weathering throughout schistosity and jointing leads to the formation of granular layers that turn out to be meccanically soft and highly erodible. (Fig. 1).The Af index was computed for 7 selected sub-basins of third drainage network order. Higher values of Af index in the NE and NW sub-basins of the Corace River basin correlate to tectonic activity and lithological control.The computed Hi values of the sub-basins range from 0.24 to 0.51. Specifically those sub-basins, in the southeasten part of the basin, show low Hi values. Nevertheless sub-basins with structural control show concave-convex hypsometric curves with anomalies and high integral values. The Vf index is a measure of incision and not uplift; but in an equilibrium state, incision and uplift are nearly matched. For each of the selected basin, the required valley width and height data were obtained along valley cross-sections perpendicular to the drainage basin axis to calculate the Vf. The obtained values were classified into three categories: <0.5; 0.5-1.5; 1.5-2.5;>2.5. Relatively young drainage basins in tectonically active areas tend to be elongated in shape normal to the mountain topographic slope. In the study area, northern sub-basins show moderate to high Bs values which indicate its elongated shape. On the contrary, sub-basins in the southwestern part show low Bs values. Values of Smf were readily calculated from topographic maps or aerial photography. However, the value obtained depends upon the scale.
A method to evaluate an index over an area that represents impact factor of active tectonics (IFAT) is present. The various indices are divided into three classes, with class one being high activity and class three being low activity. In order to develop an aerial index, IFAT is obtained by the average of the different classes of geomorphic indices and divided into four classes, where class 4 is very high tectonic activity class 3 is high tectonic activity, class 2 is moderately active tectonics and class 1 is low active tectonics. The proposed GIS methodology allows a map showing impact factor of active tectonics of the landscape is prodeuces . This method has been linked to landslide susceptibility mapping.
A higher frequency of landslides is related to areas with higher indexes of active tectonics in the northeaster slopes of Corace basin and most of all in the Gimigliano village. These correlations between density of landslides and active tectonics intensity, expressed by geomorphic indexes, suggest the usefulness of the integration of the active tectonics between the main determinant factors in landslide susceptibility assessment of mountain alpine areas which may be applied to similar areas around the world.
Chapter two
Analysis and evaluation of susceptibility landslide mapping
The concept of landslide “susceptibility” was originally design in the USGS to indicate “how prone to generate a landslide is a geological unit”; this can be measured from the correlation between determining factors together with the spatial distribution of the movements . The main steps for this kind of analysis were
a collection of information about historical or antecedent events;
compilation of a landslide inventory from field and aerial photography surveys;
GIS (ArcGIS, ESRI) implementation using a DEM and detailed thematic maps and analysis of landslide determinant factors;
Landslide inventory map
A landslide classification system based on Varnes (1978) was applied, whereby five basic movement types were distinguished: rockfalls; slides; debris flows; shallow and very slow creeping and solifluction. Movements were considered to be complex if they resulted from a combination of two or more of the main types. At the first the inventory map was compiled by interpretation of the 1:33.000-scale stereoscopic aerial photographs provided by IGM Military Geographic Institute, that cover a time period from 1954 to 1998.
Once the movements have been mapped, a field survey was carried out in order to verify the typology of each movement and state of activity.
Determining factors were analysed, some derived from the digital elevation model (DEM) such as altitude, slope, aspect, hillshade, curvature of the slope, and other one obtained from thematic maps, resulting from field research or from published maps such as lithology, land cover usage, average annual precipitation, proximity to flow channel and last but not least the relative active tectonic index.
Chapter three
Matrix method
The matrix method of susceptibility analysis (DeGraff and Romesburg, 1980, with GIS development by Irigaray, 1995) is a quantitative method for establishing an instability index for a given area. The modelling was performed using the matrix method (DeGraff and Romesburg, 1980) in a GIS environment (Irigaray, 1995; Irigaray et al., 1999; Fernandez, 2001; El Hamdouni, 2001), based on the determination of all the possible combinations between the types of factors considered. The resulting landslide susceptibility map of the Corace River Basin was expressed using five classes.
The ‘‘Landslide Matrix’’ was built from the inventory of rupture zones of the slope movements, calculating the surface area affected by the movements in each combination of factors. In the ‘‘Management Unit Matrix’’, the total surface area of each combination of factors was calculated. Finally, in the ‘‘Landslide-Susceptibility Matrix’’ the value of each cell was determined by dividing those corresponding to the landslide matrix by those of the management unit matrix. The landslide-susceptibility matrix values constitute the proportion of slope movements with respect to the total area and represent the relative susceptibility of each combination of factors. Finally, the values obtained are visualized showing 5 susceptibility levels (very low, low, moderate, high, very high (Irigaray, 1995) using the natural-breaks method.
The landslide susceptibility analysis was carrying out using matrix method. Furthermore, the analysis results were validated checking-out degree of adjustment between landslide inventories and resulting susceptibility classes.
The relative distribution of movements was calculated by ratio of the relationship Mi / ti in which Mi represents the area, in km2, of the observed movements lie in different levels of susceptibility and ti as well as the total area in km classified with a certain level of susceptibility (ti). The Σ mi / ti multiplied by 100 is that best defines the degree of adjustment (Baeza, 1994). When the majority of the movements are left very low or low susceptibility levels, will mean that the method does not capable of reproducing conditions of instability; On the contrary, if the majority are located at higher levels (moderate, high or very high) will indicate a better fit.
Chapter One
Impact Factor of Active Tectonics (IFAT) using geomorphic indices
Introduction
Using and developing of GIS provide a powerful tool for spatial data analysis and management in almost all the science disciplines, above all structural geology, tectonics, geomorphology, etc. GIS allow not only representing data, but also performing geostatistical analysis and building models. In geomorphology, the traditional use of GIS capabilities can be found in works that require multi-criterium analysis.
All of the analyses require the combination of different spatial data in addiction with statistical analysis. GIS is becoming a powerful tool to value tectonic geomorphology and landscape evolution, too to link recent tectonics. Activity of folds and faults can be assessed by the analysis of drainage network and the evaluation of geomorphic indexes. Through the application of new GIS-based methodologies for drainage network and landscape analysis it is possible to reach a better understanding of the tectonic activity and landscape evolution The technologies that GIS provide to perform statistical analyses, as well as the great availability of high-precision DEM, have allowed the advance in the field of geomorphic indexes. It is the possible DEM to extract river networks with stream gradients and catchment areas. The analysis of drainage networks is a powerful tool to detect recent tectonic activity and uplift as river channels are very sensitive to changes in the parameters that control their shape and gradient (Whipple and Tucker, 1999).
Landscapes in tectonically active areas result from a complex integration of the effects of vertical and horizontal motions of crustal rocks and erosion or deposition by surface processes. In a sense, many landscapes can be thought of as resulting from a competition among those processes acting to elevate the earth's surface and those that tend to lower it. The study of this competition and the interpretation of the geodynamic and geomorphic implications of such landscapes is the focus of tectonic geomorphology.
1. GIS as tool for tectonic geomorphology
Surface dynamics and tectonic geomorphology can indicate tectonic activity of a region
Gis allow performing geostatistical anlysis, building models and in this case representing and analysing drainage networks with a view to link recent tectonic activity.
GIS and DEM have greatly developed the value and efficiency of investigations into the processes of tectonics uplift.
Geomorphology studies that require multi-criterium analysis GIS capabilities can be used. All of these analysis require the combination of different spatial data and statistical analysis.
A DEM can be represented as a raster (a grid of squares, also known as a height map when representing elevation) or as a vector-based triangular irregular network (TIN). The TIN DEM dataset is also referred to as a primary (measured) DEM, whereas the Raster DEM is referred to as a secondary (computed) DEM. The DEM could be acquired through techniques such as photogrammetry, Lidar, InSAR, land surveying, etc. (Li et al. 2005). DEMs are commonly built using data collected using remote sensing techniques, but they may also be built from land surveying. DEMs are used often in geographic information systems, and are the most common basis for digitally produced relief maps. While a DSM may be useful for landscape modelling, city modelling and visualization applications, a DTM is often required for flood or drainage modelling, land-use studies, geological applications, and other applications. Digital Topographic Models (DTM) include elevation data at very different scales, bathymetry of marine basins and even data from other planets obtained in spatial mission (Luo, 2002).
GIS techniques are relatively recently in study of tectonic geomorphology and landscape evolution, The availability of DEM, has produces a great revolution in this field. Nowadays it is possible to extract river network with stream gradients, catchment areas and other value directly from DEM, allowing for better and faster analysis of topographic parameters.
2. Geomorphic indices
By means of geomorphic indices it is possible detecting landform responses to tectonics and therefore it have been broadly used to investigate tectonic geomorphology (El Hamndouni, 2008). Active deformation that may affect the topography in this region can be quantified using geomorphic indices.
Geomorphic indices are capable of detecting landform responses to tectonics and therefore have been broadly used to investigate tectonic geomorphology (Keller and Printer, 2002; Chen et al., 2003; Kobor and Roering, 2004; El Hamdouni et al., 2008), and some indices are particularly useful for identifying relative tectonic activity.
Geomorphic indices applicable to fluvial systems in different regions and of varying size correlate with independently derived uplift rates (Kirby and Whipple, 2001) and are applicable to a variety of tectonic settings where topography is being changed (Bull and McFadden, 1977; Azor et al., 2002). On this purpose, some geomorphic indexes were calculated in the area of Corace Basin catchment and seven sub-basins. Some geomorphic indexes of active tectonics known to be useful in active tectonic studies were selected. The present study is based on the calculation of five geomorphic indices:
Hypsometric integral (Hi),
Stream-length gradient index (SL), Asymmetry factor (AF),
drainage basin shape (Bs),
valley floor width-to-height ratio (Vf) and Index of mountain front sinuosity (Smf)
for seven, third sub-basins of the Corace River basin. All the measurements have been carried out in GIS environment, by using drainages and contours extracted from DEM, provided by Calabria Region.
2.1. Hypsometry and Hypsometric integral (Hi)
Hypsometry is one of the most useful parameters that describe and analyse the distribution of elevations in an area at different elevations (Strahler, 1952; Schumm, 1956) and can be estimated using the hypsometric curve or the hypsometric integral (HI).
The hypsometric curve represents the relative proportion of area below (or above) a given height (Figure 1a).
The hypsometric integral corresponds to the area below the hypsometric curve and therefore is correlated with the shape of this curve (Pike and Wilson, 1971; Keller and Pinter, 2002).
The hypsometric intergral can be approximated by means of the following equation: 𝐻 = 𝑚𝑒𝑎𝑛 𝑒𝑙𝑒𝑣𝑎𝑡𝑖𝑜𝑛 − 𝑚𝑖𝑛𝑖𝑚𝑢𝑚 𝑒𝑙𝑒𝑣𝑎𝑡𝑖𝑜𝑛
𝑚𝑎𝑥𝑖𝑚𝑢𝑚 𝑒𝑙𝑒𝑣𝑎𝑡𝑖𝑜𝑛 − 𝑚𝑖𝑛𝑖𝑚𝑢𝑚 𝑒𝑙𝑒𝑣𝑎𝑡𝑖𝑜𝑛
In this study we obtain HI values for regular squares of an analysis grid instead of values for basins and sub-basins. This way, we obtain a regular HI value distribution that is independent of basin geometry and drainage area.
HI values do not strictly represent a measure of dissection but instead represent how rapidly elevation changes within each square (van der Beek and Braun, 1998). We examine variations in the hypsometric integral for grid obtained for a drainage basin in the central Calabria, the Corace River. This river drains the sediments of the Catanzaro Strait, one of the largest half-graben of the Central Calabria. Its evolution is marked by strike-slip tectonics during the Pliocene-Lower Pleistocene time and extensional reactivation of faults starting from Middle Pleistocene.
2.1.1. Extraction of HI Values
In this study, the analysis using different digital elevation models (DEMs) of 40m and 5m of resolution was performed. Both DEMs were provided by Calabria regional government database. This model is georeferenced on a universal transverse Mercator projection using UTM WGS 84 33N. All the models were pit filled using geographic information system software generic tools in order to fill possible voids HI values was calculated for basins and sub-basins utilising DEM of 40m of resolution and also for 1 km regular squares in order to obtain a regularly spaced value distribution for the area. To obtain HI values for a grid of regular squares (analysis grid), zonal statistics over a DEM to extract maximum, minimum, and mean elevations was used. With the aid of geographic information system software, this procedure becomes almost direct. Where tectonics play an important role, HI values should follow a general trend, showing high HI value and a convex curve in lower part.
The HI values in the six cases follow a normal distribution with a mean average slightly under 0.5 The spatial distribution in each case offers a view of value distribution because of high local variations (Fig. 9; Tab.1). Nevertheless, there are similarities between HI distributions for the two different approachs.
Figure 12 HI distributions using elevation models of 5 m and for an analysis grid sizes and sub basin area.
Hypsometry is affected principally by tectonic, lithologic, and climatic factors. Masek et al. (1994) proposed a climatological effect on hypsometry by comparing two large-scale basins in central Andean plateau. Lifton and Chase (1992) pointed to the influences of lithology in the hypsometric integral at small scale (100 km2) and the influence of tectonics at larger scales (1.000 km2). They also showed, through a numerical model, that the hypsometric integral is positively correlated with
the uplift rate. Lithology are correlate with the HI values obtained for the 1 km analysis grid using the 5 m DEM. This lithologic analysis was carried out on the basis of 1:25,000 geologic maps, reclassifying and simplifying the different lithologies in 14 lithological classes in accordance with the geotechnical behaviour.
High HI values are present in the sub-basin, S and SW edges of the Corace basin and in the northern flank There are also high values in the NE corner of watershed Nevertheless, there are no high values at the mouth of the Corace River, where the capture by the Melito took place
In the NE corner of the Corace sedimentary basin, the distribution of HI values coincides with the distribution of the main active faults in this area. High HI values are concentrated in the footwall of the main active NW-SE normal faults where tectonic uplift is most active.
These normal faults have been active in the upper Pleistocene (Monaco and Tortorici, 2000; Tansi et al., 2007) and are associated with large historical earthquakes.
The high HI values in the SW corner of the Corace basin occur in the hanging wall of the separates Jurassic marls and limestones (Fig.12) from Plio-Quaternary sediments.
In the NE corner of the Catanzaro sedimentary basin, the distribution of HI values coincides with the distribution of the main active faults in this area (Fig. ). Low HI values occur in regions of Holocene sedimentation in the hanging wall of the main active faults. The low HI values also coincide with the region where the shallowest earthquakes occur in the hanging wall of the main normal SW dipping faults . The convexity of the hypsometric curve is an indicator of the erosional stage of the basin (Strahler,1952). Younger less eroded basins yield convex shapes with higher hypsometric integrals. The area below the hypsometric curve portrays the amount of material left after erosion. Thus, when the curve gradient becomes higher in its upper part the amount of material left after erosion is smaller (Lou, 2000). This fact can be considered a sign of maturity of the basin, since it indicates that the lateral erosion must have been intensive in the river head ( Keller and Printer, 2002).
All the curves of the eastern termination of the Catanzaro Strait were formed when the range started to develop, thus having roughly the same age. As climatic and lithologic factors are very similar in both slopes, the differences in the curves of the north and the south slopes can be attributed to tectonic factors. The southern mountain front is fault-controlled, while the norther one has no relevant faults. The faulting zone in the southern mountain front have been active during the Neogene and Quaternary, having uplift the footwall, where the catchments are located. This relative uplift is responsible for a continuous base level lowering in the rivers, thus maintain high vertical erosion rates. Therefore, the basins of the southwestern slope of Gimigliano have been suffered continuous rejuvenation processes and preserving convex profile overtime (Fig.13-14)
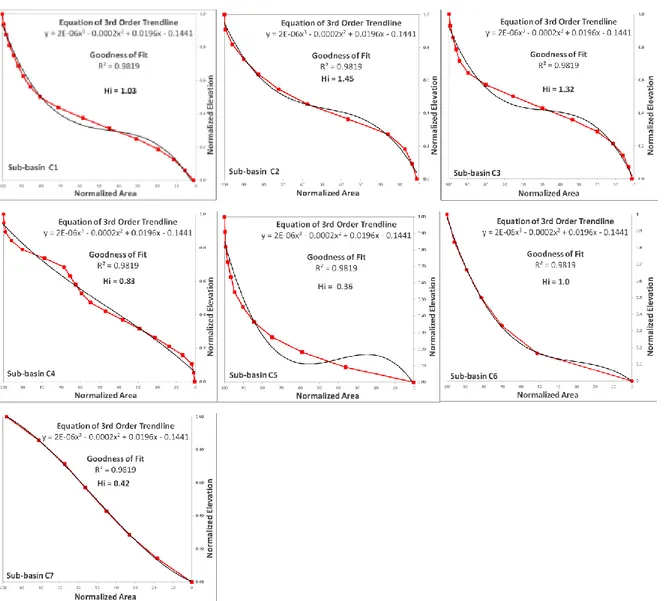
Figure 13 Sub-basins hypsometric curves, constructed in an XY scatter chart, and fit a trendline to it, based on normalized data.
All the curves present the same upper section with high gradient. The reaming sections of the curves progressively change from concave in westernmost river to convex in easternmost one. This eastward steepening in the lower sections of hypsometric curves might be related to the captures processes of the catchments previously draining to the North into the Amato River.
As this process advances over time, different curve shapes give an idea of relative chronology of this piracy process.
Assuming that lithology does not play a unique role in making differences among hypsometric curve shapes, and that climate is homogeneous all over this region, tectonic activity influences the evolution and the landform.
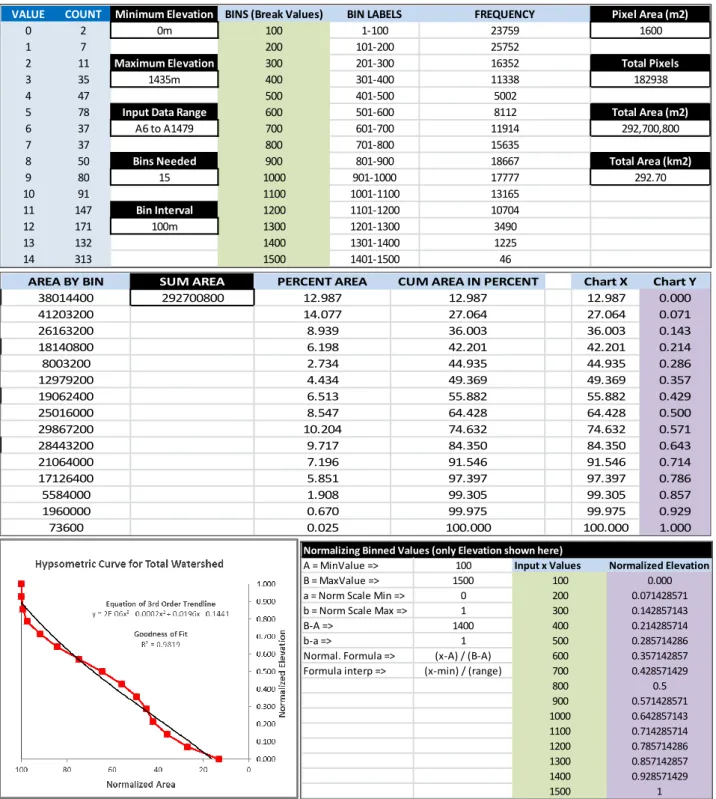
Figure 14 This assignment will test and build Excel skills oh Hypsometry. Elevation VALUE column contains DEM pixel values extracted from a single watershed. Pixel COUNT column contains the number of pixels at that same elevation in the watershed. Through a series of calculations in Excel, it will bin the data, generate hypsometric values, create a few summary
statistics, convert some values.
First two columns came from .dbf export of filled DEM (integer). VALUE column is elevation in Meters. COUNT column is the number of pixels at the corresponding elevation.
BINS Break Value Using a 100m bin interval, It is needed 15 bins to cover the range of elevation data (0m-1435m). Each bin is defined by its upper limit.
BIN LABELS Labels for bin ranges.
FREQUENCY Number of pixels contained in each bin. Drag-highlight the cells in the COUNT column corresponding to the first bin range.
AREA BY BIN. The area (m2) for each Bin of elevation data by multiplying pixel area by pixel count in the bin. DEM has pixels that are 40m x 40m in size, thus area for a single pixel = 1600m2. Converting from m2 to km2 requires dividing by one million. SUM AREA Sum of AREA by BIN values, which will be used for normalization. This value is the total area of the watershed in m2. PERCENT AREA of bins CUM AREA IN PERCENT Cumulative, normalized area data for the watershed.
VALUE COUNT Minimum Elevation BINS (Break Values) BIN LABELS FREQUENCY Pixel Area (m2)
0 2 0m 100 1-100 23759 1600
1 7 200 101-200 25752
2 11 Maximum Elevation 300 201-300 16352 Total Pixels
3 35 1435m 400 301-400 11338 182938
4 47 500 401-500 5002
5 78 Input Data Range 600 501-600 8112 Total Area (m2)
6 37 A6 to A1479 700 601-700 11914 292,700,800
7 37 800 701-800 15635
8 50 Bins Needed 900 801-900 18667 Total Area (km2)
9 80 15 1000 901-1000 17777 292.70 10 91 1100 1001-1100 13165 11 147 Bin Interval 1200 1101-1200 10704 12 171 100m 1300 1201-1300 3490 13 132 1400 1301-1400 1225 14 313 1500 1401-1500 46
AREA BY BIN SUM AREA PERCENT AREA CUM AREA IN PERCENT Chart X Chart Y
38014400 292700800 12.987 12.987 12.987 0.000 41203200 14.077 27.064 27.064 0.071 26163200 8.939 36.003 36.003 0.143 18140800 6.198 42.201 42.201 0.214 8003200 2.734 44.935 44.935 0.286 12979200 4.434 49.369 49.369 0.357 19062400 6.513 55.882 55.882 0.429 25016000 8.547 64.428 64.428 0.500 29867200 10.204 74.632 74.632 0.571 28443200 9.717 84.350 84.350 0.643 21064000 7.196 91.546 91.546 0.714 17126400 5.851 97.397 97.397 0.786 5584000 1.908 99.305 99.305 0.857 1960000 0.670 99.975 99.975 0.929 73600 0.025 100.000 100.000 1.000
Normalizing Binned Values (only Elevation shown here)
A = MinValue => 100 Input x Values Normalized Elevation
B = MaxValue => 1500 100 0.000
a = Norm Scale Min => 0 200 0.071428571 b = Norm Scale Max => 1 300 0.142857143
B-A => 1400 400 0.214285714
b-a => 1 500 0.285714286
Normal. Formula => (x-A) / (B-A) 600 0.357142857 Formula interp => (x-min) / (range) 700 0.428571429
800 0.5 900 0.571428571 1000 0.642857143 1100 0.714285714 1200 0.785714286 1300 0.857142857 1400 0.928571429 1500 1
2.2. Stream Length (SL)
SL is one of the most broadly used geomorphic index to characterizes active tectonics. It is strongly dependent on stream length. The SL index shows the variation in stream power along the river reach. This index is very sensitive to changes in channel slope, thus allowing the evaluation of recent tectonic activity and/or rock resistance.
The SL index in a river reach is defined as follows (Hack,1973): 𝑆𝐿 =𝑑ℎ
𝑑𝑙 𝐿
where dh/dl is the slope (dh is the change in elevation and dl is the length of the reach) and L is the channel length upstream from the midpoint of the reach to the river head.
This geomorphic index is very sensitive to changes in lithology and/or tectonic uplift. Most of studies were based on comparisons of SL profiles along different rivers. However, the fact that the SL index is strongly influenced by river length makes comparing SL values in rivers of different length difficult.
Several locations along the head water regions of the river basin show anomalous SL values where the river crosses the fault planes, but in the downward part of the river, SL values are found to be distributed uniformly. The SL Index analysis was performed using 1:10.000 topographic maps and following Hack's (1973) method.
SL Index is used to detect recent tectonic activity by identifying anomalously high index values on a specific rock type.
The whole dataset was collected calculating the values along longitudinal profiles of the third order stream network and relative watershed, for 100 m long reaches, from the divide towards the valley floor. The dataset obtained was georeferenced and processed with GIS software in order to obtain a map by using zonal statistic interpolation (Tab.5). A map, with a resolution of 1 Km, was produced to show the spatial distribution of the SL parameter. In the SL Index map the values are grouped in 9 classes. The anomalous SL values that are observed in uniform lithological conditions maybe are due to tectonic activities according Keller and Pinter (2002).
The SL index value increases as rivers and streams flow over an active uplift, and had lesser values when they are flowing parallel to features such as valleys produced by strike-slip faulting.
A high value of SL index also expressed lithological changes in metabasites, serpentinites, phyllites, orto- and para-gneisses. The outcropping rocks show a resistant behaviour, even if weathering throughout schistosity and jointing leads to the formation of granular layers that turn out to be meccanically soft and highly erodible.
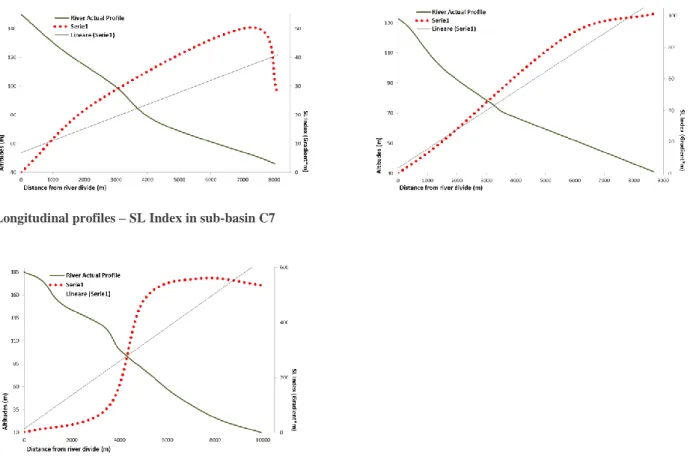
Table 3 SL value from C1 Sub.basin.
Longitudinal profiles – SL Index in sub-basin C1 Longitudinal profiles – SL Index in sub-basin C2
Longitudinal profiles – SL Index in sub-basin C3 Longitudinal profiles – SL Index in sub-basin C4
Longitudinal profiles – SL Index in sub-basin C5 Longitudinal profiles – SL Index in sub-basin C6
13.5 0.135 238.7 238.7 119.4 119.4 915.0 900.0 15.0 16.1 7.6 0.076 824.2 1062.9 412.1 650.8 900.0 850.0 50.0 49.5 3.9 0.039 1983.0 3046.0 991.5 2054.4 850.0 800.0 50.0 80.1 4.7 0.047 3469.7 6515.7 1734.9 4780.8 800.0 750.0 50.0 224.7 7.1 0.071 3693.1 10208.8 1846.5 8362.2 750.0 700.0 50.0 593.7 7.6 0.076 3641.2 13849.9 1820.6 12029.3 700.0 650.0 50.0 914.2 5.5 0.055 4398.19 18248.1 2199.1 16049 650 600 50 882.696 6.8 0.068 3906.77 22154.9 1953.39 20201.5 600 551 49 1373.7 Elev min (m) Delta h (m) SL REACH LENGHT CUM LENGHT HALF L (m) LENGHT (L) (m) Elev MAX Calulate d Slope Average Slope
x-DISTANCE SLOPE(S) REACH LENGHT (m) CUM LENGHT (m) HALF L (m) LENGHT (L) (m) Elev MAX (m) Elev min (m) Delta h (m) SL
0 0
2420 0.009979841 3507.07 3507.07 1753.535 4173.535 185 150 35 41.65
2420 0.033181142 1506.88 5013.95 753.44 6680.51 150 100 50 221.67
2420 0.021112101 2368.31 7382.26 1184.155 8618.105 100 50 50 181.95
Longitudinal profiles – SL Index in sub-basin C7
.
Table 5 Longitudinal river profiles in the NE border of Catanzaro Straight and the measured SL index
Figure 15 SL Index map and its relative anomalies
In detail, the highest values are located along both flanks of the Gimigliano town, where the SL (Fig. 15; Tab 3-5). Index reaches the maximum value of 440m in correspondence with a deep seated landslide affecting its south and north-eastern slope. Anomalous high values are also recorded along the middle sector of the Melito River.
Immediately downstream, the SL Index values increase to approximately 300 m in correspondence with a NW–SE trending fault and landsliding.
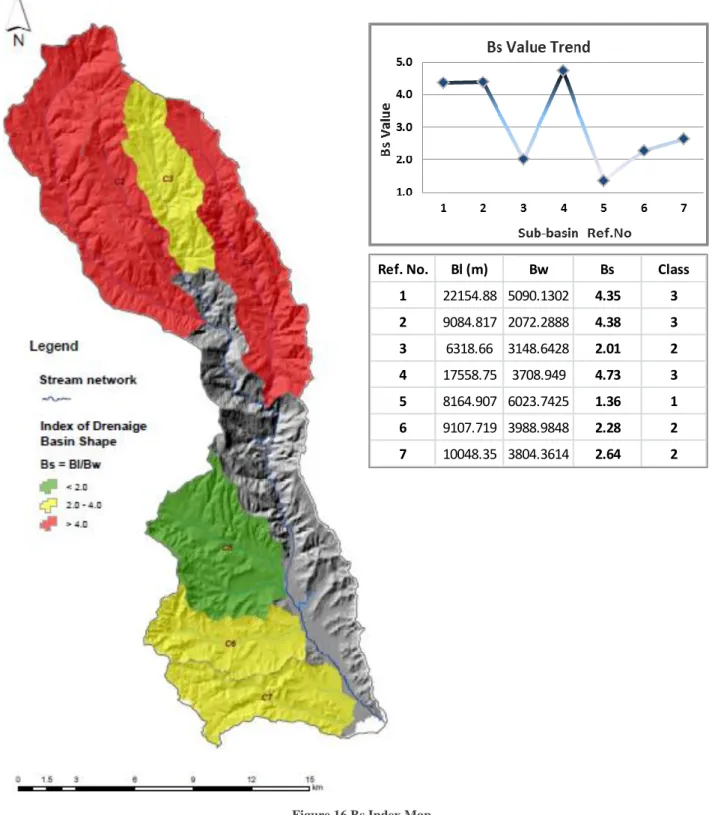
2.3. Index of drainage basin shape (Bs)
The index reflects differences among Relatively young elongated drainage basins with high values of Bs associated with relatively higher tectonic activity, and more circular basins with low values