UNIVERSITY OF CATANIA
International PhD Course in Chemical Science
XXIV Cycle
Dr. ZELICA MINNITI
Advanced characterization methods of organic materials
of environmental and historical-artistic relevance through
Micro-FTIR Mapping and Raman Microscopy
INDEX
Abstract 1
INTRODUCTION 2
ABOUT TECHNIQUES 5
Fourier-Transform Infrared spectroscopy 5
Infrared theory 6
Fourier-Transform Infrared Spectrometer 9
Michelson Interferometer 10 Advantages 11 Spectra 11 Transmission method 12 Reflectance method 12 ATR method 13 Micro-sampling method 13
FTIR application field 14
Raman spectroscopy 15
Raman theory 16
Dispersive Raman Spectroscopy 18
Dispersive Raman key applications 20
FTIR vs Raman 21
ABOUT PAPER 22
Papermaking history 22
Chemical pulping 24
Mechanical pulping 25
Coating and paper fillers 25
Paper structures 26
Hydrolysis 27
Oxidation 29
Others degradation processes 32
ABOUT PARCHMENT 34
The parchment production 36
The parchment biochemical structure 39
The parchment conservation 40
The importance of fragments: Maculature 41
The inks 43
ABOUT PARTICULATE MATTER 46
Particulate matter 46
EXPERIMENTAL SECTION 49
Scope of the work on writing materials 49
Scope of the work on PM samples 49
Methods 49
Spectroscopic analysis on writing materials 51
Paper samples 51
Results 58
Characterization of ancient books 67
Parchment characterization 71
Inks characterization 73
Interpretation of spectra from foxed paper 78
FTIR characterization of stained paper samples 79
Spectroscopic analysis on particulate matter 87
Sample preparation 87
Interpretation of spectra from fractionated PM 92
Inorganic absorption assignments 94
Organic Absorption Assignments 97
FTIR Mapping 101
CONCLUSIONS 105
Abstract
For many centuries paper was the main material for recording cultural achievements all over the world. Paper is mostly made from cellulose with small amounts of organic and inorganic additives which allow its identification and characterization and may also contribute to its degradation. Prior to 1850, paper was made entirely from rags, using hemp, flax and cotton fibres. After this period, due to the enormous increase in demand, wood pulp began to be commonly used as raw material, resulting in a rapid degradation of paper.
Spectroscopic techniques represent one of the most powerful tools to investigate the constituents of paper documents in order to establish its identification and its state of degradation. This work describes the application of Fourier-Transform Infrared spectroscopy and Raman techniques for the characterization of organic writing materials focusing the attention on the study of paper stained by the foxing process.
The spectroscopic techniques were also used for the characterization of the particulate matter (PM) collected in Catania using an high-volume cascade impactor. Assignment of PM vibrational bands has been studied and the distribution of functional groups in different size fraction stages were discussed. FTIR mapping was applied in order to better observe the particles distribution throughout the impactor stages.
INTRODUCTION
During my PhD course, I have dealt with application of FTIR and Raman spectroscopy on both cultural heritage and environmental samples.
One of the subject of my thesis is the application of FTIR and Raman spectroscopic techniques for the investigation of the degradation processes occurred on writing materials. The attention was focused in particular on cellulose paper samples coming from damaged or ancient books; some analysis were also carried on ancient parchment samples and inks used on them.
Infrared spectroscopy for its non-destructive approach represents a great potential for surface materials characterisation (Hon, 1986). Many authors have applied this spectroscopic technique to paper characterization. Calvini et al. (2006) studied the composition of old and modern Japanese papers. Hon (1986) demonstrated the effectiveness of FTIR in analyzing and determining acid impurities distributed on the surface of paper documents produced during the period 1790-1983. In one study (Mossini, 1990) , some naturally aged papers were subjected to FTIR analysis. In a study by Zotti et al. (2008) the main surface components of bio-deteriorated papers from the XVIII century were characterized by FTIR spectroscopy, the author also referred to the presence of gelatin, wood pulp, calcium carbonate, gypsum, hemicelluloses and glue in the paper composition, as well as to the corresponding bands in the FTIR spectra. The presence of fungi in these papers was also verified.
Raman spectroscopy has been applied to different types of artworks too. On paper artworks, the presence of fillers in the cellulose can be detected, a Raman analysis of a map from the XVII century (Castro, 2008) showed that gypsum (CaSO4·2H2O) was used as a filler in the cellulose. Bicchieri et al.
examined degraded papers with several non-destructive spectroscopic techniques, including Raman spectroscopy (Bicchieri, 2006). Cellulose undergoing accelerated hydrothermal ageing gives rise to a pattern of carbonyl groups; their vibrational modes were observed in Raman spectra by Lojewska et al. (2007).
The other subject of my thesis was the exploration of a non-destructive method for the study and the characterization of the particulate matter (PM) collected in Catania using an high-volume cascade impactor (which separates different sized particles into fractions) loaded with aluminium foil over which organic micro-pollutants are adsorbed.
A number of methods have been developed to determine the loadings of inorganic species in size segregated PM. Ion chromatography interfaced with impactors (John et al., 1989 a-b) proton induced x-ray emission (Cahill et al., 1989; Ouimette and Flagan, 1982) and x-ray fluorescence (Groblicki et al., 1981; Ondov et al., 1990) are just a few of the available methods. On the other hand, methods for analysis of organics in size segregated PM are limited, and most of the methods that are available rely on organic and elemental carbon analysis (McMurry and Zhang, 1989; Turpin et al., 1989a, b), or on extraction followed by mass spectroscopic analysis, which requires large sample mass (Mazurek et al., 1989; Rogge et al., 1993).
In my work a method for the analysis of size segregated PM based on infrared spectroscopy was developed. This method has a number of advantages
compared to more traditional methods of PM analysis. First, it is a non-destructive analytical method, requiring no solvent extractions. Second, this method is suitable for the characterization of a large fraction of the inorganic and organic PM mass. Third, due to the high sensitivity of the method, short sampling runs are possible. Balancing these advantages is the fact that individual organic species are not identified, only compound classes are. Overall, however, the chemical insight provided by infrared spectroscopy represents a significant advance in the analysis of size segregated PM. The use of infrared spectroscopy in PM analysis was used extensively in the 1970s and early 1980s to investigate the composition of atmospheric PM (Blanco and McIntyre, 1975; Cunningham et al., 1974, 1976; Kellner, 1978; Bogard et al., 1982); however, these methods were largely abandoned because of the difficult sample collection and the lack of sensitivity. Recent advances in infrared optics and detectors have now overcome the problem of the samples preparation (Kellner and Malissa, 1989). A complete review of recent advances in PM analysis by infrared spectroscopy has been presented by Allen and Palen (1989).
During my work, some of the pros and cons of different FTIR methods of spectral-data acquisition were studied. The main spectra features were analyzed in order to get useful information for the characterization of PM functional groups distribution on different sized particles. Determining the composition of atmospheric PM, as a function of the PM size, is a challenging problem. The challenge is due partly to the complex nature of atmospheric PM, which are a mixtures of inorganic salts, metals, organic compounds and water. Despite these difficulties, sample collection and spectral interpretation of infrared absorbance bands was discussed.
ABOUT TECHNIQUES
Fourier-Transform Infrared spectroscopy
Infrared spectroscopy is one of the most important methods for the identification and characterization of chemical structures (Hon, 1986), is a versatile experimental technique and it can be used to obtain important information about everything from delicate biological samples to though minerals. One of the great advantages of infrared spectroscopy is that virtually any sample in virtually any state may be studied. Liquids, solutions, pastes, powders, film, fibres, gases and surfaces can all be examined with a judicious choice of sampling technique.
Infrared spectroscopy is of major importance in paper characterization (Workman, 2001), it covers several different fields of application in paper analysis. Mainly, it allows the identification of the origin of the fibres and the determination of the chemical composition of the additives used in the papermaking.
Moreover, infrared spectroscopy plays an important role in the study of paper deterioration processes (Bitossi et al., 2005). In museums, archives and libraries, the application of analytical techniques free of chemicals or solvents is mandatory. Furthermore, considering the huge number of items surveyed to establish the state of preservation of a collection, the time of analysis must be short. Sampling of historical artefacts for analysis is rarely permitted. More and more, only non-destructive or at best micro-destructive analytical techniques are allowed. Infrared spectroscopy is suitable for all these
demands and shows great potential for conservation and restoration of surface materials studies (Hon, 1986).
Infrared spectrometers have been commercially available since the 1940s. At this time the instruments relied on prisms to act as dispersive elements, but in the mid of 1950s, diffraction gratings had been introduced into dispersive machines. The most significant advances in infrared spectroscopy, however, have come about as a result of the introduction of Fourier-transform spectrometers. This type of instrument employs an interferometer and exploits the well-established mathematical process of transformation. Fourier-transform infrared (FTIR) spectroscopy has dramatically improved the quality of infrared spectra and minimized the time required to obtain data. In addiction with constant improvements to computers, infrared spectroscopy has made further great strides.
Infrared theory
Infrared spectroscopy is a technique based on the vibrations of the atoms of a molecule. An infrared spectrum is commonly obtained by passing infrared radiation through a sample and determining what fraction of the incident radiation is absorbed at a particular energy. The energy at which any peak in an absorption spectrum appears corresponds to the frequency of a vibration of a part of a sample molecule.
In order to show infrared absorptions, a molecule must possess a specific feature, i.e. an electric dipole moment of the molecule must change during the vibration. This is a selection rule for infrared spectroscopy.
The dipole moment of such a molecule changes as the bond expands and contracts. An example of an ‘infrared-active’ molecule is an heteronuclear diatomic molecule. By comparison, an example of an ‘infrared-inactive’
molecule is a homonuclear diatomic molecule because its dipole moment remains zero no matter how long the bond.
So, the interactions of infrared radiation with molecules may be figured out in terms of changes in molecular dipoles associated with vibrations and rotations.
Figure 1 shows stretching and bending movements that are collectively referred to as vibration. Vibrations can involve either a change in bond length (stretching) or bond angle (bending). In the bending vibrations the atoms can move in-plane or out-of-plan.
Near
Far
Far Far
Fig.1: Molecule Vibrational Modes
Symmetrical molecules will have fewer ‘infrared-active’ vibrations than asymmetrical molecules. This leads to the conclusion that symmetric
vibrations will generally be weaker than asymmetric vibrations, since the former will not lead to a change in dipole moment. It follows that the bending or stretching of bonds involving atoms in widely separated groups of the periodic table will lead to intense bands. Vibrations of bonds such as C-C or N=H will give weak bands. This again is because of the small change in dipole moment associated with their vibrations.
There will be many different vibrations for even fairly simple molecules. The complexity of an infrared spectrum arises from the coupling of vibrations over a large part of or over the complete molecule (Stuart, 2004). Such vibrations are called skeletal vibrations. Bands associated with skeletal vibrations are likely to conform to a pattern or fingerprint of a molecule as a whole, rather than a specific group within the molecule (fig.2).
Fig. 2: Group frequencies
(3650 – 2500 cm-1)ĺ stretching single bond X–H (2300 – 2100 cm-1)ĺ stretching triple bond (1800 – 1500 cm-1)ĺ stretching double bond (1650 – 1300 cm-1)ĺ bending in-plane X–H
(1300 – 900 cm-1)ĺ stretching single bond X–Y; fingerprint region (< 1000 cm-1)ĺ bending out-of-plane H – X
Fourier-Transform Infrared Spectrometer
FTIR spectroscopy is based on the idea of interference of radiation between two beams to yield an interferogram (Griffiths and de Haseth, 1986). The latter is a signal produced as a function of the change of pathlenght between the two beams. The two domains of distance and frequency are interconvertible by the mathematical method of Fourier-transformation.
The basic components of an FTIR spectrometer are shown schematically in figure 3. The radiation emerging from the source is passed through an interferometer to the sample before reaching a detector. The data are transferred to the computer for Fourier-transformation.
Source Michelson Interferometer Detector Sample Beam Splitter
Michelson Interferometer
The most common interferometer used in FTIR spectroscopy is a Michelson interferometer, which consist of two perpendicularly plane mirrors, one of which can travel in a direction perpendicular to the plane (fig. 4) A semi-reflecting film, the beamsplitter, bisect the plane of these two mirrors. So 50% of the incident radiation will be reflected to one of the mirrors while 50% will be transmitted to the other mirror. The two beams are reflected from these mirrors, returning to the beamsplitter where they recombine and interfere.
Fig.4: Michelson interferometer
The moving mirror produces an optical path difference between the two arms of the interferometer. The result interference pattern is shown in figure 5.
Advantages
FTIR instruments have several advantages over older dispersive instruments: improvement in SNR (signal to noise ratio) per time unit and the total source output can be passed through the sample continuously. This results in a substantial gain in the energy at the detector, hence translating to higher signals and improved SNRs.
Spectra
Early infrared instruments recorded percentage of transmittance or absorbance on the wavenumber scale.
The infrared spectrum can be divided in to three regions: the far-infrared (<400 cm-1), the mid-infrared (4000-400 cm-1) and the near-infrared (13000-4000 cm-1) (fig.6). Many infrared applications employ the mid-infrared region, but the near- and far-infrared region also provide important information about certain materials (Gunzler and Gremlich, 2002).
Transmission Method
Transmission spectroscopy is the oldest and most straightforward method. This technique is based upon the absorption of infrared radiation at specific wave-lengths as it passed through a sample. It is possible to analyse sample in liquid, solid or gaseous forms when using this approach (Sommer, 2002).
I0 I
The amount of radiation absorbed may be measured in a number of ways Transmittance: T = I / I0
Absorbance: A = log 1 / T
Reflectance Method
Reflectance technique may be used for samples that are difficult to analyse by the conventional transmittance methods. Reflectance methods can be divided into two categories: external and internal..
External reflectance measurements involve an infrared beam reflected directly from the sample surface
Internal reflectance measurement can be made by using an attenuated total reflectance (ATR) cell in contact with the sample.
ATR Method
Attenuated total reflectance (ATR) is a sampling technique used in conjunction with infrared spectroscopy which enables samples to be examined directly in the solid or liquid state without further preparation.
ATR uses a property of total internal reflection called the evanescent wave. A beam of infrared light is passed through the ATR crystal in such a way that it reflects at least once off the internal surface in contact with the sample. This reflection forms the evanescent wave which extends into the sample, typically by a few micrometres. The beam is then collected by a detector as it exits the crystal.
This evanescent effect works best if the crystal is made of an optical material with a higher refractive index than the sample being studied.
Typical materials for ATR crystals include i.e. germanium, zinc selenide, but the excellent mechanical properties of diamond make it an ideal material for ATR.
Micro-sampling Method
It is possible to combine an infrared spectrometer with a microscope in order to study very small samples (Humecki, 1999). It is possible to work in reflection, transmission and also with micro-ATR accessory.
The sample is placed in direct contact with the crystal mounted on the accessory in the picture. The principle of analysis is the same one used by ATR.
Infrared Mapping (FTIR equipped with a single element mercury-cadmium-telluride MCT detector) and infrared imaging (FTIR equipped with focal plane array FPA detector) using FTIR micro-spectroscopic techniques has emerged as an effective approach for studying complex or heterogeneous specimens (Kidder et al., 2002). The technique can be used to produce a two- or three-dimensional ‘picture’ of the properties of a sample. In particular Imaging, due to the development of FPA detectors, allows thousands of interferograms to be collected simultaneously and then transformed into infrared spectra.
FTIR application field
Applications of FTIR spectrometer to the different fields of investigation are considerably large and related to different types of analysis. Here are the most significant.
Cultural Heritage
The most interest applications concern the field of cultural heritage. They can be schematized as follows:
¾ Characterization of materials and colours of binders ¾ Identification of degradation products
¾ Monitoring of degradation processes ¾ Characterization of protective materials
¾ Dating works of art and accuracy of the findings ¾ Analysis of glass inclusions
Analysis of pharmaceuticals
Most of the classic pharmaceutical products have a specific chemical structure, and a specific molecular target on receptor. FTIR spectrometer can serve as an excellent analytical tool for the analysis of natural medicines, with
advantages in sensitivity, selectivity, speed and regulatory compliance through validation protocols.
Biology and Biochemistry:
¾ Bacteria classification
¾ Identification of biomolecules such as aminoacids, proteins, DNA / RNA.
Environmental
Analysis of biodiesel, exhausts, hazardous air pollutants, greenhouse gases and other emissions from wide-ranging products such as derivatives from coal mines, agricultural plants and industrial sites.
Geological
¾ Analysis of diamonds, emeralds, rubies and wedges ¾ Identification of mineral species
Forensic science
¾ Analysis and identification of illegal substances (cocaine identification, etc..)
¾ Analysis and characterization of trace organic and inorganic explosive materials, flammable compounds, fiber, etc..
¾ Analysis of different types of ink and tracking of paper materials. ¾ Identification of drugs
Raman spectroscopy
In 1928, Sir C.V. Raman documented the phenomenon of inelastic light scattering. Radiation, scattered by molecules, contains photons with the same frequency as those of the incident radiation, but may also contain a very small number of photons with a changed or shifted frequency. The spectroscopic process of measuring these shifted photons was later named after Sir Raman, with the shifting of frequency referred to as the Raman effect. By the end of
the 1930s, Raman spectroscopy had become the principle method of non-destructive chemical analysis. Infrared spectroscopy replaced Raman as the preferred method after World War II, when the development of sensitive infrared detectors and advances in electronics made infrared easier to use. Infrared spectroscopic measurements became routine, whereas Raman spectroscopy still required complex instrumentation, skilled operators and darkroom facilities.
Later developments, such as the availability of less expensive and more sensitive Charge Coupled Devices (CCDs), the availability of holographic notch filters and the advent of Fourier transform Raman (FT-Raman), launched a renaissance of Raman as a routine laboratory technique. Today, the most advanced modern Raman instruments are completely integrated into a single unit and computer controlled, are interlocked for laser safety, have automated protocols for calibration and offer large spectral libraries. These advances make the collection and utilization of Raman spectra a routine exercise.
Raman theory
In Raman spectroscopy, a sample is irradiated with a strong monochromatic light source (usually a laser). Most of the radiation will scatter “off” the sample at the same wavelength as that of the incoming laser radiation, a process known as Rayleigh scattering. However, a small amount – approximately one photon out of a million (0.0001%) – will scatter from that sample at a wavelength shifted from the original laser wavelength (fig. 8).
Fig.8. Raman scattering
As illustrated in the following simplified energy level diagram (fig. 9), a molecule at rest resides in the ground vibrational and electronic states. The electric field of the laser raises the energy of the system for an instant by inducing a polarization in the chemical species. The polarized condition is not a true energy state and is widely referred to as a “virtual state”. Relaxation from the virtual state occurs almost instantaneously and predominately returns to the initial ground state. This process results in Rayleigh scatter. Relaxation to the first excited vibrational level results in a Raman shift. Stokes-Raman shift scatter is of lower energy (longer wavelength) than that of the laser light.
Fig.9: Raman scattering
Most systems have at least a small population initially in an excited vibrational state. When the Raman process initiates from the exited vibrational level, relaxation to the ground state is possible, producing scatter of higher energy (shorter wavelength) than that of the laser light. This type of scatter is called anti-Stokes- Raman scatter (not illustrated).
Dispersive Raman Spectroscopy
To observe the Raman spectrum, it is necessary to separate the collected Raman scattered light into individual wavelengths. In dispersive Raman instruments, this is accomplished by focusing the Raman signal on a grating, which spatially separates the different wavelengths (fig. 10). This spatially dispersed beam is directed to a CCD. Dispersive Raman usually employs visible laser radiation. Typical laser wavelengths are 780 nm, 633 nm, 532 nm, and 473 nm although others are common.
Fig.10: Basic components of a dispersive Raman spectrometer
The efficiency of Raman scatter is proportional to 1/O4
, so there is a strong enhancement as the excitation laser wavelength becomes shorter. This would suggest that all Raman should be done with the shortest wavelength lasers available. However, one factor hindering the practice of Raman as a routine tool is the unpredictable fluorescence that often occurs. Fluorescence is a very efficient emission several orders of magnitude stronger than the Raman signal, so minor fluorescence can overwhelm the desired Raman measurement.
Fluorescence occurs when the virtual energy level overlaps an upper Electronic level, so as the energy of the laser gets higher (shorter wavelength), the likelihood of fluorescence increases. The phenomenon is excitation wavelength dependent, so a sample that fluoresces at one wavelength may not at another. Thus, when selecting an instrument, it is important to look for rapid and effortless exchanges between two difficult excitation lasers. The grating has a strong influence on spectral resolution and instrument throughput. Gratings have many lines or grooves “blazed” into the surface, which disperse the incoming light. The higher the number of grooves on the grating, the wider the dispersion angle of the exiting rays.
Ideally, gratings should be specifically matched to the laser and experimental conditions of the experiment.
The CCDs commonly used for dispersive Raman are silicon devices with very high sensitivity. The detecting surface of the CCD is a two-dimensional array of light-sensitive elements, called pixels (usually each pixel is <30 µm). Each pixel acts as an individual detector, so each dispersed wavelength is detected by a different pixel (or closely spaced group of pixels).
It is advantageous to couple the strength and flexibility of Raman spectroscopy with a microscope that allows analysis of very small samples. The goal of microscopy is to analyze the smallest samples possible and to distinguish the substance of interest from its surroundings. This is known as spatial resolution, and in microscopy, the highest spatial resolution is attained using small pinholes or “apertures” somewhere in the microscope.
Dispersive Raman Key Applications
Dispersive Raman spectroscopy has been applied to many types of samples. Shorter laser wavelengths and more sensitive CCDs make the technique ideal for minor component analysis, offering low detection limits for such applications as impurity analysis in solutions, polymers or environmental sampling. Major applications for visible Raman are in the semiconductor and microelectronics industries where silicon and various coatings are routinely analyzed. Dispersive Raman is often very powerful for analyzing very dark samples, such as carbon black loaded or highly coloured samples. Many other techniques suffer from total absorbance or sample heating, which is often not present when using the dispersive Raman technique, owing to lower laser powers that can be used.
Inorganic analysis and identification in areas such as geology and gemmology are more commonly done using dispersive Raman because it is often free of the metal oxide fluorescence background that may be seen in FT-Raman. The confocal approach has also been used to probe inclusions in gems and stones by focusing on the region within the body of the material.
FTIR vs Raman
The vibrational states probed by Raman spectroscopy are the same as those involved in infrared spectroscopy. As such, Raman spectroscopy is very similar to the more frequently used Fourier transform infrared (FTIR) spectroscopic technique. The two vibrational spectroscopy techniques are, in fact, complementary. Vibrations that are strong in an infrared spectrum (those involving strong dipole moments) are usually weak in a Raman spectrum. Likewise, non-polar functional group vibrations that give very strong Raman bands usually result in weak infrared signals (Thermo Electron, 2008).
ABOUT PAPER
Papermaking History
Papermaking is considered to have originated in China. In AD 105 the court Tsai Lun presented to the emperor a process for papermaking with specific reference to its use for writing and record keeping. They produced the first usable writing material from tree bark and plant fibres, as well as from old rags and fishing nets. Since that time, paper has been in general use all over China (Winter, 2008) and has been playing a major role in the development of cultures all over the world. Papermaking technology has undergone extensive development in the past 200 years. Prior to 1850 paper was made essentially from cellulose and water in almost equimolar amounts. Antique paper was made entirely from rags, i.e., from linear long cellulose fibres, only with the addition of sizing compounds (Erhardt and Tumosa, 2005), whilst contemporary paper can be manufactured from short fibres, hemicelluloses and lignin, and may contain non-fibrous components including various colouring agents, fillers, coatings and other additives used to improve paper properties.
Originally, animal glue was used for sizing. It was substituted in the XIX century by rosin and alum, and more recently by other synthetic products (Blumich et al.,2003; Capitani et al., 2002; Viola et al., 2004). The change of fibre resource from cotton and linen rags to wood fibres and the use of alum rosin sizes had significant adverse effects on the permanence and durability of paper materials (Hon, 1986).
¾ Rosin+ Sodium carbonate+S tarch+Alum Additives:
¾ Gelatin+Alum
¾ ADK (alkylketene dimes)
¾ ASA (alkenylsuccinic anhydride)
Additives for sizing purposes may be mixed into the pulp and/or applied to the paper web later in the manufacturing process. The purpose of sizing is to establish the correct level of surface absorbency to suit the ink or paint.
Internal sizing is applied to almost all papers while surface sizing is added for the highest grade bond, ledger, and writing papers.
Surface sizing solutions consists of mainly modified starches or sometime other hydrocolloid as gelatin and a surface sizing agent such as AKD or acrylic co-polymers. Surface sizing agents are amphipathic molecules, having both hydrophilic (water-loving) and hydrophobic (water-repelling) ends. The sizing agent covers the cellulose and forms a film, with the hydrophilic tail facing the fibre and the hydrophobic tail facing outwards. This creates a water-repellent situation. Sizing improve the surface strength, printability and water resistances of the paper surface. In the sizing solution also optical brightening agents are added to improve the opacity and whiteness of the paper surface.
Internal sizing chemicals used in papermaking at the wet end are ASA, AKD and rosin. By making the paper web more hydrophobic, the sizing agents influence dewatering and retention of fillers and fibres in the paper sheet. Internal sizing agents main effect is on runability of the paper machine next to paper quality.
Modern paper from wood pulp can be divided into chemical and mechanical pulp.
Chemical pulping
The purpose of a chemical pulping process is to break down the chemical structure of lignin and render it soluble in the cooking liquor, so that it may be washed from the cellulose fibers. Because lignin holds the plant cells together, chemical pulping frees the fibres and makes pulp. The pulp can also be bleached to produce white paper for printing, painting and writing. Chemical pulps tend to cost more than mechanical pulps, largely due to the low yield, 40–50% of the original wood. Since the process preserves fibre length, however, chemical pulps tend to make stronger paper. Another advantage of chemical pulping is that the majority of the heat and electricity needed to run the process is produced by burning the lignin removed during pulping.
Papers made from chemical wood-based pulps are also known as woodfree papers.
The Kraft process is the most commonly practiced strategy for pulp manufacturing and produces especially strong, unbleached papers that can be used directly for bags and boxes but are often processed further, e.g. to make corrugated cardboard.
The main process to obtein paper are: kraft process, sulfite process, and soda pulping.
Chemical pulp content: ¾ Calcium bisulphite
¾ Sodium bisulphite ¾ Soda sulphate ¾ Lime
Mechanical pulping
There are two major mechanical pulps, thermomechanical pulp (TMP) and mechanical pulp. In the TMP process, wood is chipped and then fed into large steam-heated refiners where the chips are squeezed and fibreized between two steel discs. In the groundwood process, debarked logs are fed into grinders where they are pressed against rotating stones and fibreized. Mechanical pulping does not remove the lignin, so the yield is very high, >95%, but also causes paper made from this pulp to yellow and become brittle over time. Mechanical pulps have rather short fibre lengths and produce weak paper. Although large amounts of electrical energy are required to produce mechanical pulp, it costs less than chemical pulp.
¾ Hemicellulose
Mechanical pulp content:
¾ Lignin ¾ Tannins ¾ Resins ¾ Rubber
Coating and paper fillers
Coated paper has a thin layer of material such as calcium carbonate or china clay applied to one or both sides in order to create a surface more suitable for high-resolution halftone screens. Coated papers are divided into matte, semi-matte or silk, and gloss. Gloss papers give the highest optical density in the printed image.
Coating and paper fillers are inorganic substance natural or artificial powder which give the paper a high degree of whiteness, opacity and printability (Copedè, 2003).
Coating and Fillers: ¾ Kaolin Al2Si2O5(OH)4
¾ Calcium carbonate CaCO3
¾ Talc Mg3Si4O10(OH)2
¾ Barium sulfate BaSO4
¾ Gypsum CaSO4
¾ Kieselguhr (diatom powder) ¾ Titanium dioxide TiO2
Paper structures
Paper consists of mostly bonded cellulose fibres that are linear polymers of glucose (E-D-glucopyranose) monomers linked by E-1,4-gycosidic bonds (fig.11). Cellulose from native wood exhibit degree of polymerization (number of linked monomers) up to 10 000, while the one from native cotton can reach up to 15 000.
Fig.11: cellulose chain (E-1,4-gycosidic bonds)
All chemical reactions occur at hemiacetal bond (the glycosidic linkage) and/or hydroxyl groups. These two determine chemical properties of cellulose. Cellulose chains are held together by strong intramolecular hydrogen bonds that promote aggregation of single chains into highly
oriented structure. Also water molecules, since cellulose is naturally hydrophilic, that are embedded into cellulose matrix play a very important role in hydrogen bond formation. This aggregates are ordered up to even 80% (crystalline forms). The rest, that is unordered, is called ‘amorphous’ form (Fengel et al., 1989). In addition to cellulose fibres, paper contains hemicellulose (wood polyoses), lignin and certain amount of additives, e.g. fillers, pigments, metal ions. Paper is a relatively stable material but undergoes natural aging process that causes the degradation of cellulose. This process is related to the presence of acid substances, moisture, oxidative agents or microrganisms. Especially, the presence of acidic substances results in the hydrolysis of cellulose that appears in shortening of its chain along with changes in content of crystalline form (Browing, 1977; Wilson, 1979).
Hydrolysis
Hydrolysis causes the depolymerization of cellulose by attacking the E-glycosidic bond. Strong mineral acids dissolve cellulose completely up to the formation of glucose. Weak mineral acids and organic acids cause partial hydrolysis (Bicchieri and Brusa, 1997).
The mechanism of hydrolysis is the protonation of oxygen and the cleavage of glycosidic bond with formation of new reducing terminal units (fig. 12).
Fig.12: Cellulose Hydrolysis
The proton H+ binds to oxygen Step a)
Step b) The charge is transferred on carbon 1
Step c) The link between oxygen and carbon is broken and a water molecule is fixed on carbon 1, positively charged
Step d) A proton is detached from the molecule of water and continue the action of hydrolysis.
The result is the breaking of the bond and the formation of two OH (on the C1 and C4).
The progressive fragmentation of the chains makes the paper brittle, leading to increased oxidation also causes yellowing.
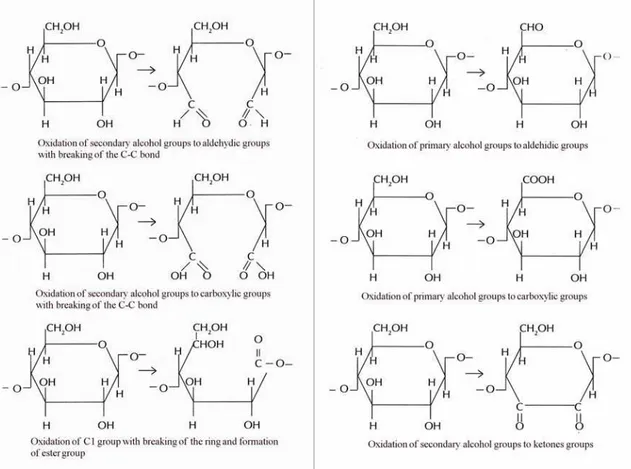
Oxidation
The oxidative degradation occurs both in acidic and in alkaline environment. This process may involve primary and secondary alcohol groups (fig. 13), but it is also possible the formation of double and triple carbon-carbon bonds in the ring. The primary alcohol group at C6 can be oxidized to aldehyde and then to carboxyl; the secondary alcohol group in C2 and C3 can be oxidized to ketones. The reducing end groups of each chain are oxidized to carboxyl.
There is synergy between hydrolysis and oxidation, for this reason the study of the alterations is very difficult. Indeed, the presence of oxidants groups accelerates the reactions of hydrolysis.
Foxing
Foxing is the term that describes the stains, spots, and blotches on old papers or documents which doesn’t affect the integrity of the paper (fig. 14). The name “Foxing” is believed to come from the fox-like reddish-brown colour of the stains. The foxing stain may be due to metals (iron or copper), fungi or microganisms.
However in correspondence of the spots there is a strong oxidation of the cellulose chain, characterized by a high content of carbonyl groups and the presence of double and triple carbon-carbon bonds.
Fig. 14: Foxed paper
The main reason for the destruction of old paper lies in the oxidation of the cellulose fibers, which leads to paper yellowing and gives rise to foxing stains
(yellowish or dark brown spots). The nature of foxing stains is still debated in spite of extensive studies in this field (Brandt et al. 2009).
Some authors observed a biological attack, others the presence of chemical salts, others again both fungal spores and chemicals. It is then difficult to state whether biological attack caused the degradation or whether it simply happened on the surface of an already degraded paper substrate. Nevertheless, it is known that foxing is characterised by a three-dimensional structure, since it can penetrate into the paper, and even migrate through successive pages (Buzio et al. 2004).
At present, the nature of foxing is still under discussion. The complexity of the problem is related to a variety of chemical reactions and physical processes that take place during the ageing of paper. Moreover, these processes can vary depending on external conditions and the original composition of the paper.
The problem of the foxing diagnostics at early stages is also very important. At present, several methods have been developed to prevent oxidative damage. They are based on the application of chemicals that neutralize the paper’s acidity and of antioxidants, in particular, molecules that form complexes with metal ions with variable valence (Brandt et al. 2009).
Several spectra from foxed paper are characterized by the presence of conjugated (C=C, C=O, or C=N) bonds. More accurate identification of the bonds is unavailable. It is not clear whether different types of foxing correspond to different processes of their evolution or different stages of a single degradation process.
FTIR-ATR analysis of foxed stains appears very promising (Choisy et al. 1997; Manso et al. 2009) as this technique has been used for the analysis of paper composition and degradation (Calvini and Gorassini 2002; Calvini and Vassallo 2007; Zotti et al. 2007, Zotti et al. 2008), as well as for the analysis
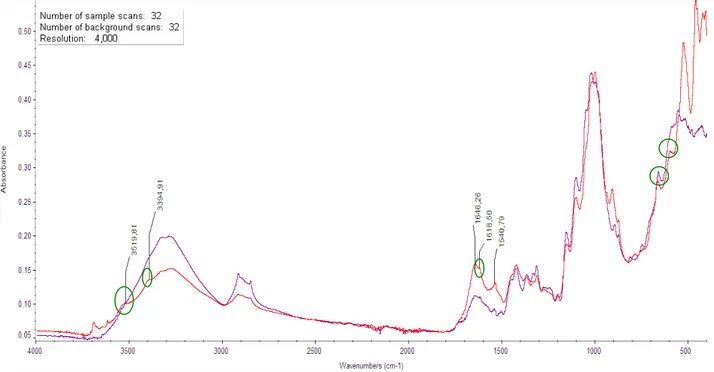
of fungal strains in mycological research (Gordon et al. 1997; Irudayaraj et al. 2002; Erukhimovitch et al. 2005; Fischer et al. 2006; Szeghalmi et al. 2007). However, the interpretation of FTIR spectra is severely hampered by the similarity between the organic compounds present in fungi (e.g., polysaccharides, lipids, and proteins) and sizing compounds or surface coatings of paper documents. Since FTIR-ATR spectroscopy is sensitive to several organic chemical groups that are in common with both fungi and gelatin-sized ancient paper, FTIR analysis was performed both on the spots and on the neighbouring unstained paper surface. Zotti el al. applied FTIR spectroscopy to still living fungi isolated from the surface of a wood pulp cardboard (fig. 18). In particular, in order to prove the biological nature of the foxing stains, it was showed the presence of the main absorption bands observed for living fungi: amide I at about 1635 and amide II at about 1540 cm-1 and the presence of the broad plateau between 1500 and 1200 cm-1 typical of fungal agents.
Others degradation processes
The nature of paper manufacturing can also affects its degradation. The use of wood pulp rather than rags, causes an increase in lignin content which is easier to hydrolyze. The products of the lignin hydrolysis catalyze acid reactions and cause paper browning. Also additives, bleaching substances, glues and colours significantly accelerate the degradation.
Many additives in modern paper cause degradation: the calcium carbonate (which stabilizes the acid reaction) if used in large quantities change the mechanical properties of paper.
Environmental factors can influence the cellulose physical condition. Among these: the climate, lighting, air pollution and dust. Infact, both the absorption of water and the temperature increase catalyze the hydrolysis reactions and promote microbial attack. Moreover wrong lighting (artificial or natural) can cause photo-degradation phenomena.
The pollutants in the atmosphere catalyze many reactions of degradation, especially in association with water. The most harmful substances are sulphurs compounds which cause oxidation.
Dust increases chemical and physical damage absorbing water vapour, pollutants and microrganisms (Copedè, 2003).
ABOUT PARCHMENT
Throughout the entire Middle Ages, parchment, alongside papyrus, was the predominant writing material in Europe and in the Near and Middle East. Only after the invention of paper and the diffusion of bookmaking, the parchment was not used anymore for ordinary documents.
According to the reports of various Classical authors, parchment was 'invented' by Eumenes II of Pergamon (197–159 BC). To perpetuate his memory and fame, he wanted to establish a library in Pergamon that would rival the most famous library of the time, the Alexandria library (Fuchs, 2004).
However, writings on treated animal skin are even older: some Egyptian Fourth Dynasty texts were written on parchment. Though the Assyrians and the Babylonians impressed their cuneiform on clay tablets, they also wrote on parchment from the 6th century BC onward. Rabbinic culture equated a "book" with a parchment scroll. Early Islamic texts are also found on parchment.
In the Middle Ages calfskin and split sheepskin were the most common materials for making parchment in England and France, while goatskin was more common in Italy.
There was a short period during the introduction of printing when both parchment and paper were used.
In the later Middle Ages, parchment was largely replaced by paper. New techniques in paper milling allowed it to be cheaper and easer to manufacture than parchment.
B A
Fig. 15: A) In the early Middle Ages, even parchment with holes was used for manuscripts; B) Old stitched repair in a manuscript in the Berlin Staatsarchiv.
After the invention of printing in the later fifteenth century, the demands of printers far exceeded the supply of animal skins for parchment.
The shortage of raw materials led to the reuse of early medieval damaged manuscripts whose texts were erased in order to be written on again.
There were different qualities of parchment, more or less thick, rough or clear. Depending on the use one product might be preferred over another. So, while the parchment for bookbinding (from the sixteenth century onwards) was thinner, parchment for documents of relevant importance (for example, the papal brief) resulting from pieces of young or dead animal skin was bright white and very thin. Although in Europe since the thirteenth century the use of parchment in books had greatly reduced, there were areas in which this did not happen. In fact the vast majority of public documents issued by kings, emperors and popes continued to be written on this support beyond the end of the nineteenth century and, although rarely, the same parchment was also used for printing, at least until the end of the nineteenth century (Fuchs, 2004).
Fig. 16: Folchart psalter, 9th century AD (Stiftsbibliothek, St. Gallen). The parchment maker and his client. 1255 Hamburg Bible (Royal Library, Copenhagen).
The parchment production
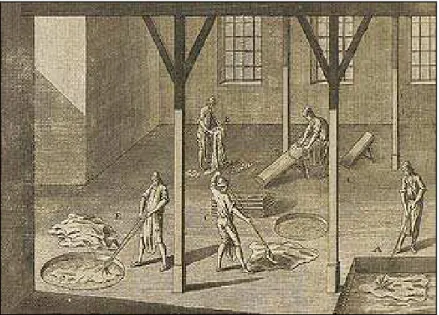
The parchment preparation methods was quite similar both in ancient times and in the Middle Ages, and indeed remained fairly unchanged right into modern times (fig. 17).
Only after the introduction of industrial technology and modern chemistry the process has changed significantly. The ancient preparation methods was the following: soaking the fresh animal skin for 2–6 weeks in a 5–10% solution of slaked lime (Calcium hydroxide - Ca(OH)2), a process called liming. The
different layers of the skin swell at different rates and gradually begin to break up (fig. 18).
Fig. 18: A skin being removed after 3 weeks from the lime bath for dehairing.
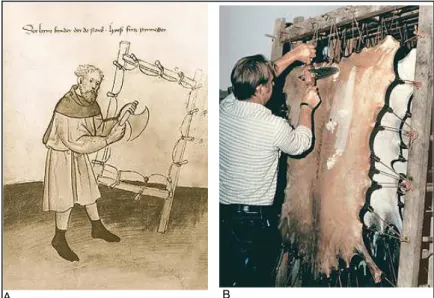
The epidermis reacts most quickly. Because the hairs have their roots here, after the soaking process, the hairs along with the roots are easily removed by draping the skin over a beam and shaving with a dull blade (fig. 19).
The skin is then reversed and the remains of fat, muscle and loose flesh are likewise removed from the flesh side. After washing, the transparent skin is stretched and dried on a frame. These physical and chemical processes orient the fibers in sheets and open up the inner structure of the collagen so that air penetrates between the layers causing the parchment to become opaque, and thus suitable for writing or decoration on both sides. To enhance the properties of the surface for writing, both sides of the dried parchment are carefully polished so that they are neither too rough nor too smooth. Polishing (also known as pouncing) is done while the skin is still stretched on the frame, either with a crescent-moon-shaped (semi-lunar) knife (Latin lunelarium) (fig. 20), with pumice or with a specially prepared sanding bread.
B A
Fig. 20: Pouncing of stretched parchment with the lunelarium. A) Yesterday: Fritz Pyrmenter, 73rd brother of the Nuremberg 'Mendelschen Zwölfbrüderstiftung', 1425. B) Today.
For the latter, bread dough is mixed with glass splinters, formed into small rolls and baked. The parchment surface can be treated far more sensitively with such sanding bread than with pumice or a knife. With inattentive use of the knife, the skin can be damaged quite quickly; pumices are not completely homogenous and contain hard stone-like nodules which leave scratches on the
parchment surface. Cuts and tears that occur before the stretching procedure are usually sewn before the skin is put into the frame, so that they don't stretch or expand during drying. They can be cut out after drying, but often they are left in the parchment and can be seen today in the old manuscripts. In the modern manufacture of parchment, sodium sulphide and enzymes are used for dehairing. The result is a product differing significantly in durability and quality from historic parchment, which can cause problems if modern material is used in parchment restoration (Fuchs, 2004).
The parchment biochemical structure
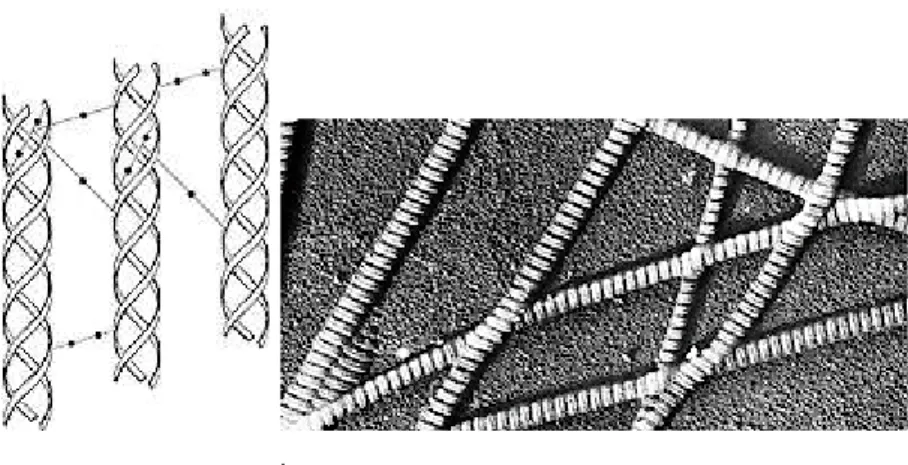
The essential components of parchment from animal skins are the fibers of the connective tissue. This extracellular matrix in the skin is composed of bundles of long-chained fibrils of the scleroproteins collagen and elastin. The basic unit of collagen is tropocollagen (MW 300 kD), a right-handed helix of three polypeptide chains. A single tropocollagen molecule is a microfibril that, packed together by hydrogen bonds, salt bridges and covalent intermolecular bonding, form fibrils with a diameter of approximately 250– 500 nm. Adjacent intertwining molecules in the fibrils are displaced relative to one another by a quarter of their length, giving rise to a periodicity of about 70 nm visible as dark bands in the electron microscope (fig. 21).
a b
Fig. 21: a) Intermolecular bonds between the triple helices of collagen fibers. b) Scanning electron micrograph of collagen.
In contrast to the relative stiffness of collagen, elastin stretches and recoils. It is assembled from tropoelastin monomers, and hydrophobic domains alternate with intramolecular cross-linking (at lysine residues) domains which confer the elasticity on the randomly coiled molecules (Fuchs, 2004).
The parchment conservation
The biochemical structure of parchment influences its response to the environment. The collagen fibers are heat sensitive. Above 70°C, they begin to shrink irreversibly and denaturation sets in. The fibers also respond to changes in humidity by continuous shrinking and stretching. This can only be prevented by keeping the parchment in a constant environment. This is one of the most important basic conditions for the preservation of painted parchment manuscripts. The pigment layers have a tendency to peel off if heat and humidity keep changing. In addition, high humidity or water are hostile to all parchments: they cause the parchment to become transparent and to decompose.
Parchment is a material of outstanding stability that can survive for many centuries; if correctly archived, it can theoretically be preserved, in an unchanging state, indefinitely. Nevertheless, it has certain peculiar properties requiring a restorer special skills and a feeling for the skin (Fuchs, 2004).
The importance of fragments: Maculature
‘Maculature’ is a word used to describe a recycled fragment of parchment. Fragments of manuscripts and printed books were used, especially in XV-XVII century, to reinforce the worn pages, the books binding and cover. Those pieces of parchment, therefore, are in poor condition and unreadable. During the Middle Ages, the reuse of manuscripts was a common practice in monastic libraries, where the old manuscripts were dismantled and the parchment was re-used. Obviously these parchment fragments quote a printed text which has no relationship with the body of the volume and therefore, identification work, is problematic. A thorough investigation of the fragments (procurement, inventory, description, allocation, etc..) has became important nowadays .The pioneers of this type of investigation are Wolfenbùttel Librarians, that in the twentieth century inspected the bindings of stored books, finding more than thirty fragments of the same manuscript “Historia
Francorum” by Gregorio of Tour (IX century) (Butz-Mann, 1966).
In the current century, notable is the work of Ker on the Oxford books bindings (XVII - XXIII century) that revealed more than 2,000 manuscript fragments used as sheets guard (Ripley Ker, 1954). Is also very important the survey made by Lehmann and Glauning on the bindings stored in two libraries in Monaco.
In Italy the first survey of parchment fragments, unfortunately unpublished, was made by Filippo Di Benedetto, who has streamlined the fragments cataloging method (Innocenti, 1994).
Fig. 22: The fragments of Codex Gregorianus (III century AD) an ancient text on Roman law, considered a lost book, were found between the "parchment recycled" used to bind together the pages of other books of later times.
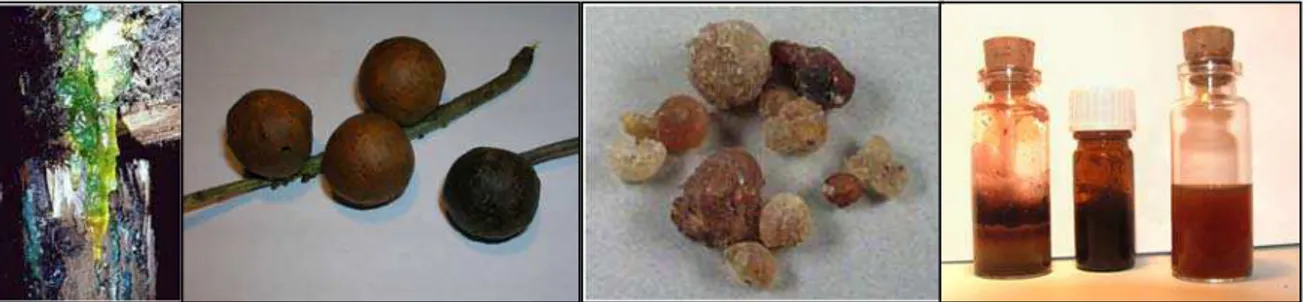
The inks
Usually inks can be described as liquid, semi-liquid or solid preparations, which can be used to draw graphic signs on a support. Ink recipes have been modified over the ages: the Chinese were the first to use ink, usually mixing lake colours and a black pulverized stone, but the birth of real ink occurred in the Third century B.C. Two centuries later Vitruvius wrote the first true ink recipe in his book De Architectura: he mixed lamp black (a pigment from burnt wood) with camphor and gelatine. Between 2500 and 3000 B.C. a mixture of lamp black ink and oil was used in Egypt while the Arab world only knew of the existence of metal–gall inks. Later Pliny and Cicero described inks based on lamp black, water and Arabic gum. In several Medieval and Renaissance recipe collections the first iron–gall inks were described: for example, in Schedula diversarum artium Theophylus described its steps production from vegetable extract maceration to ferrous sulphate addition (Gambaro et al., 2009).
Fig. 23: Carbon black powder and inked papers
From the 17th century on detailed recipes were written and marketed inks were produced using scientific methods. In 1663 Boyle attempted to discover the reaction between vitriol and oak galls; in 1666 Tachen created an ink by mixing oak galls with silver, copper or mercury. In 1748 Lewis listed a series
of products to be used in order to prepare long-lasting ink. In 1785 Schule synthesized gallic acid, while ten years later Dejeux and Seguin artificially produced tannins.
Fig. 24: Ingredient to make iron-gall ink: vitriol, oak galls, Arabic gum, iron-gall inks.
By the 19th century innovative synthetic colorants were employed in ink formulations. The aging of inks is one of the most important causes of corrosion of paper, the mechanism of which depends on the nature of the components and their interactions with paper. Different ink types age differently: the literature pays particular attention to iron–gall inks, which have been shown to be the principal cause of paper penetration. This is due to the acid hydrolysis of cellulose (caused by an excess of sulphuric acid in the recipe) or to iron (II) ion oxidation reactions (caused by an excess of Fe ions) (Calvini, 2001; Reißland et al. 2001).
Conversely carbon black inks are stable due to their chemical inactivity, they just become duller with age. Synthetic inks do not cause paper corrosion but they are very photosensitive (Maraval and Flieder, 1993).
FTIR techniques may provide further information on different types of paper and/or on the writing itself. Some preliminary tests have been carried on original drawings, in order to identify the type of ink used (Burandt, 1994).
The identification of metal-gallic or organic ink via FTIR spectroscopy appears rather difficult, since the main signal is due to the cellulose absorption: indeed, the cellulose remains the major component of the sample even in inked and damaged paper and only small discrepancies are observed between inked or damaged paper spectra and pure cellulose spectra. The interpretation of discrepancies measured on original samples remains difficult since the ink and the paper degradation processes.
ABOUT PARTICULATE MATTER
Particulate matter
Particulates are dust-size pollutants dispersed in the atmosphere. They can originate from numerous sources such as automobiles, power plants and mines. Research on the effects of particulate matter on human health was initiated in the 1970s (Larsen, 1970; Holland et al., 1979) and have been strongly developed since then.
There is a growing body of clinical evidence indicating that adverse public health effects are caused by the presence of respirable or inhalable particulate matter (PM) in the ambient air (Neukirch et al., 1998). Particles with diameters smaller than 10 Pm (denoted PM10) are problematic. The deleterious effects increase with decreasing size. The most signifcant dangers occur for particles smaller than 2.5 Pm (PM2.5) (Monn et al., 1997; Wilson and Suh, 1997) because these penetrate deeply into the lungs, from where they cannot be removed by respiration. Of course, particles are not dangerous simply because they are small, but rather because of the material on and in them, which they carry into the lungs.
The mechanisms by which particulate organic matter affects the human body remain controversial. Some researchers hypothesize that ‘ultrafine’ particles (one hundredth of a micrometer in diameter) are the major cause of the deleterious effects (Environment Protection Agency, 1994). They suggest that these very fine particles reach lungs in abundance and, when bound to alveoli, may induce oxidant production and lung inflammation. Other hypotheses point to the hazardous effects of the reaction between organic matter with
attached transitional metals and cell membranes, protein and cell receptors (Mastalerza et al., 1998).
Because of these public health dangers, it is important to have accurate and sensitive analytical methods for the detection and analysis of carbonaceous particles. Chemical speciation of these particles, however, is difficult due to their complexity.
The atmospheric PM particles are composed of a mixtures of water soluble inorganic salts, insoluble mineral dust and carbonaceous material. This carbonaceous fraction includes organic compounds plus elemental carbon. The organic fraction of atmospheric PM contains hundreds to thousands of chemical components (Schuetzle et al., 1975). Identifying and determining the concentration of individual compounds in mixtures of this complexity is extremely difficult. Most methods for speciation require large quantities of sample, analysis times are long and only a small fraction of the organics can be identified. Due to these constraints, some recent work on analyzing PM organics has focused on functional group and compound class characterization (Gordon et al., 1988). Most functional group characterizations of PM have focused on material extracted from hi-volume quartz and glass filters. The organics are extracted, separated chromatographically, and the separated fractions are examined using infrared spectroscopy (Gordon et al., 1988). This allows a much larger fraction of the PM organics to be characterized but still involves long analysis times and large sample sizes. The large mass required for analysis makes size segregated sampling particularly difficult. Methods for size segregated sampling interfaced with compound class characterization have been reported by Kellner and Malissa (1987) and Dangler et al. (1987). Size segregated samples are collected using impactors and the size fractions are analyzed directly using infrared spectroscopy. The advantage of this approach is the
information it provides about the size distribution of compound classes. A further advantage is that the spectroscopy is done directly, with no extraction. The disadvantage of this approach is that no individual organic molecules, only compound classes, can be identified in ambient PM. A complete discussion of methods for compound class characterization of atmospheric PM is given by Allen and Palen (1989).
EXPERIMENTAL SECTION
Scope of the work on writing materials
The main objectives of this work were the use of the FTIR and Raman spectroscopy to:
x characterize cellulose paper samples and their degradation products; x characterize cellulose paper samples from great historical and artistic
value books;
x characterize the main components detected on parchment samples; x identify inks on paper and parchment samples;
x characterize stained cellulose paper samples from great historical and artistic value books;
Scope of the work on PM samples
The main objectives of this work were the use of the FTIR and Raman spectroscopy to:
x increase the knowledge about the atmospheric particulate matter composition, using different FTIR analytical techniques;
x using the spectroscopic analysis for the determination of the loadings of organic and inorganic functional groups in size segregated ambient PM.
Methods
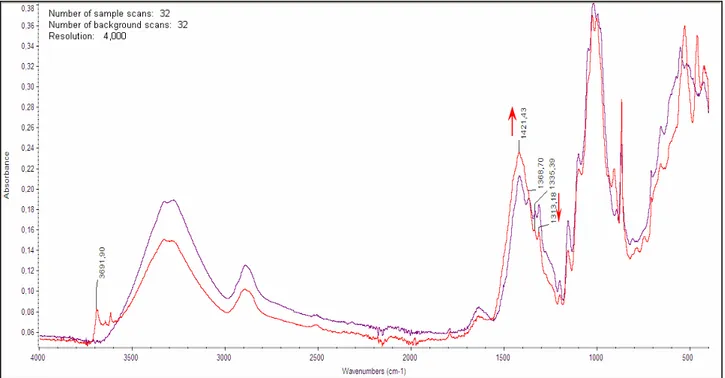
The infrared analysis was carried out at room temperature and humidity, spectra were acquired on a Thermo-Nicolet 6700 FTIR spectrometer with Attenuated Total Reflectance (ATR) sampling accessory (Diamond Crystal window).
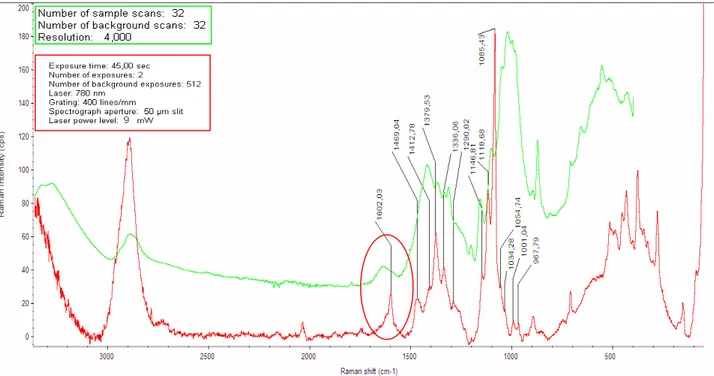
Raman spectra were recorded on a Thermo Dispersive Raman DXR equipped with a 780 nm excitation laser and full range grating coupled to a micro-probe (CCD detector). The head of micro-probe implements a 10x, 50x and 100x magnifying lenses. Neutral density filters implemented in the system were used to attenuate the laser power on the samples (between 1 and 14 mW). All the configurations and sampling data are reported on spectra figures.
Spectroscopic analysis on writing materials
Paper samples
In order to characterize new and aged paper two analytical methods were performed on paper using strips sampled from no-printed page area of 14 books (age ranging from 1934 to 2009) (fig. 25). Spectra from different aged paper samples were compared to each other and to modern paper in order to point out the differences among the new and old samples and the increase of the degradation process in older samples ones.
To characterize the cellulose in ancient paper samples, the spectroscopic analysis were carried out on samples from ancient books of high artistic and historical interest. Spectra from ancient paper samples were compared to each other and to modern paper in order to point out the different degradation pattern among the samples.
These samples, provided by the Siracusa Public Library, come from the following books: “Histoire Naturelle generale et particulaire” volume 13th written by Georges Louis Leclerc de Buffon1 and published in Paris in 1789 (fig.26);
Fig. 26: “Histoire Naturelle generale et particulaire”.
1
Georges Louis Leclerc de Buffon (1707–1788) was an eighteenth-century French naturalist.
Buffon developed his interest in natural history after being appointed by Louis XV in 1739 as director of the Jardin du Roi (Royal Gardens and Natural History Collections) in Paris. He was ambitious and produced a collection of books about natural history (animals, plants, and minerals). In 1749 he published (along with a set of co-workers) the first three volumes of his famous Histoire Naturelle, générale et particulière that ultimately comprised thirty-six volumes published over a period of fifty years. The Histoire naturelle was an enormous success and became one of the most widely read books of the century.
Buffon also included a number of theoretical essays in his Histoire Naturelle that were historically important for the theory about the evolution of life and on the concept of species.
“Tractatus in Quinque Ecclesiae Praecepta”, written by Tommaso Tamburino2 and published in Lyon in 1626 (fig. 27).
Fig. 27: “Tractatus in Quinque Ecclesiae Praecepta”.
In order to characterize cellulose and parchment some fragments belonging to two prestigious books were analyzed: "Augustini" (1533) and "Officia
Propria Sanctorum" (1794). These samples, although not datable, have
proved important about the main constituents of such media and its inks. These samples, also provided by the superintendence of BBCCAA Siracusa, include:
2
The Jesuit, " Tommaso Tamburino " (Caltanissetta, March 6, 1591 - Palermo, October 10, 1675) is the dominant figure of Italian casuistry production, which had developed in Sicily in the seventeenth century following the Spanish one (School of Salamanca). Tamburino works, thanks to the efforts of the Jesuits, were widespread throughout Europe since the mid-seventeenth century. Tamburino’s writings of moral theology collected in "Opera Omnia", were published several times in Italy and abroad, and were used as reference books in Europe for a century even after his death.
- six cellulose fragments glued to the board of the back plate of the Restoration Project n. 22/07 "Augustini" published in Lugduni (Lyon) in 1533, belonging to the Gubernale Fund, samples were glued on a non-acid paper (Canson gr. 8/10) neck with an adhesive compound based on methyl cellulose MH300p diluted to 4% (fig. 28)
- three parchment fragments from Restoration Project n. 20/07 "Officia
Propria Sanctorum" published in 1794, belonging to the Gubernale Found
(fig. 29).
Fig. 29: “Officia Propria Sanctorum”: restored book and its fragments.
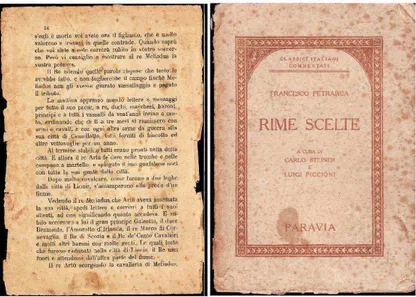
In order to better figure out the foxing process and to verify the biotic nature of foxing, spectroscopic analysis were performed on paper from strongly stained books: “I cavalieri della tavola rotonda” published in 1924; “Francesco Petrarca – Rime scelte” published in 1945. The paper from those two books shows many yellow-brown spots, so although they have little historical-artistic interest they were chosen for the characterization of foxed paper (fig. 30).