UNIVERSIT `
A DEGLI STUDI DI CATANIA
Facolt`
a di Scienze Matematiche Fisiche e Naturali
Dottorato di ricerca in Informatica
AUTOMATIC PATTERN CLASSIFICATION AND
STEREOSCOPIC VISION IN MEDICAL IMAGING
ALESSANDRO TORRISI
A dissertation submitted to the Department of Mathematics and Computer Sci-ence and the committee on graduate studies of University of Catania, in fulfill-ment of the requirefulfill-ments for the degree of doctorate in Computer Science.
ADVISOR Prof. Giovanni Gallo COORDINATOR Prof. Domenico Cantone
Contents
1 Introduction 3
1.1 Dissertation organization . . . 5
I
Automatic Classification of Frames from Wireless
Capsule Endoscopy
7
2 Wireless Capsule Endoscopy 8 2.1 WCE system details . . . 102.2 Benefits and risks of capsule endoscopy . . . 14
2.3 Typical capsule endoscopy images . . . 16
2.4 Manual annotation . . . 17
2.5 The digestive tract . . . 19
3 Literature review 22 3.1 Topographic segmentation . . . 23 3.2 Event detection . . . 26 3.2.1 Intestinal contractions . . . 27 3.2.2 Intestinal juices . . . 27 3.2.3 Bleeding detection . . . 28 3.2.4 Anomaly detection . . . 29
4 Information Theoretic Method 33 4.1 Entropy . . . 34
4.2 Kolmogorov complexity . . . 37
4.3 Algorithmic Information Distance . . . 38 i
CONTENTS ii 5 Ensemble Learning 41 5.1 AdaBoost . . . 42 5.1.1 Real application . . . 44 6 Experiments 49 6.1 Dataset . . . 49
6.2 Information Theory based WCE video summarization . . . 50
6.2.1 Feature extraction . . . 50
6.2.2 Classification method . . . 51
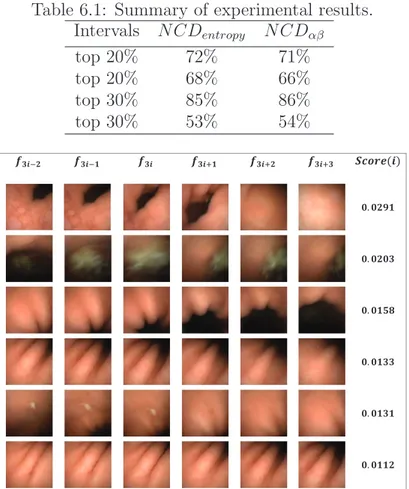
6.2.3 Experimental results . . . 54
6.2.4 Conclusion . . . 57
6.3 Lumen Detection in Endoscopic Images: A Boosting Classifi-cation Approach . . . 58
6.3.1 Feature extraction . . . 59
6.3.2 Classification method . . . 63
6.3.3 Experimental results . . . 66
6.3.4 Conclusion . . . 72
6.4 Random Forests based WCE frames classification . . . 73
6.4.1 Classification method . . . 73
6.4.2 Experimental results . . . 76
6.4.3 Conclusion . . . 78
7 Conclusion and future work 80
II
Depth estimation in Bronchoscopic Intervention 83
8 Stereoscopic Vision 84 8.1 Stereoscopic system . . . 858.1.1 Disparity . . . 85
8.2 The correspondence problem . . . 87
8.3 Epipolar geometry . . . 91
CONTENTS iii
9 Literature Review 94
9.1 Stereoscopy in medicine . . . 95
9.2 Augmented Reality in surgery . . . 97
10 Experiments 99 10.1 Depth extraction from monocular bronchoscopy . . . 103
10.1.1 Depth clues extraction . . . 104
10.1.2 Experimental results . . . 106
10.1.3 Discussion . . . 107
10.2 3D reconstruction in virtual reality . . . 110
10.2.1 Depth clues extraction . . . 112
10.2.2 Augmented Reality . . . 114
10.2.3 Discussion . . . 116
10.3 Stereoscopic bronchoscope prototype . . . 119
10.3.1 Hardware . . . 119
10.3.2 Software . . . 121
10.3.3 Experimental results . . . 128 11 Conclusion and future work 132
List of Figures
2.1 Graphical scheme of the endocapsule. . . 12
2.2 The antennas array that transmits the capsule’s signal to a recorder worn by the patient. . . 13
2.3 A typical Wireless Capsule Endoscopy frame. . . 16
2.4 Different examples of capsule endoscopy scenarios. . . 17
2.5 Rapid Reader exam annotation software developed by Given Imaging. . . 18
2.6 A schematic illustration of the human GI tract. . . 20
2.7 The lower GI tract. . . 21
3.1 Examples of endoscopic frames showing intestinal juices. . . . 28
3.2 Examples of endoscopic frames showing ulcers. . . 30
4.1 Grouping property of the entropy. . . 35
4.2 Entropy of a binary source. . . 36
5.1 AdaBoost pseudo-code. . . 43
5.2 Haar features proposed by Viola-Jones for face detection. . . . 44
5.3 Integral image representation. . . 46
5.4 Evaluation of a two-rectangle feature. . . 46
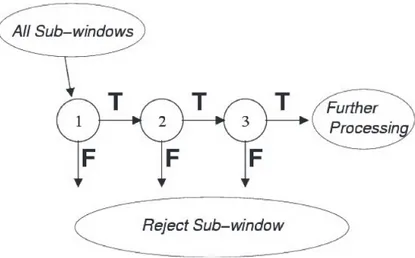
5.5 Cascade of strong classifiers. . . 48
6.1 Example of an image extracted from a WCE video. . . 50
6.2 A schematic illustration of the Textons method. . . 52
6.3 Representation of frames as a “bag of visual words”. . . 53
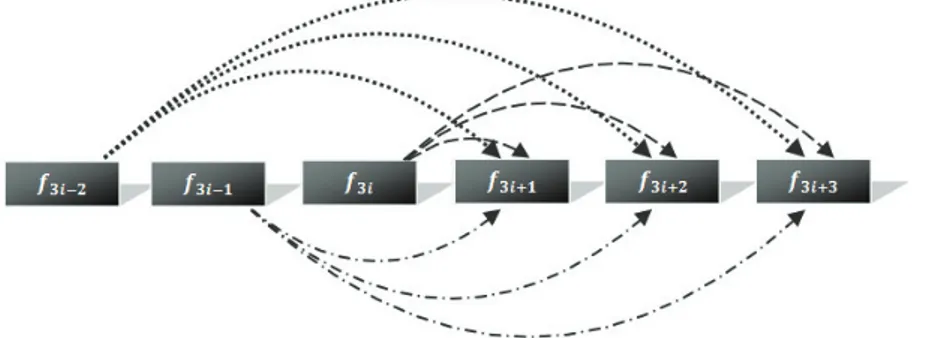
6.4 The computation of function Score(i). . . 54
LIST OF FIGURES v
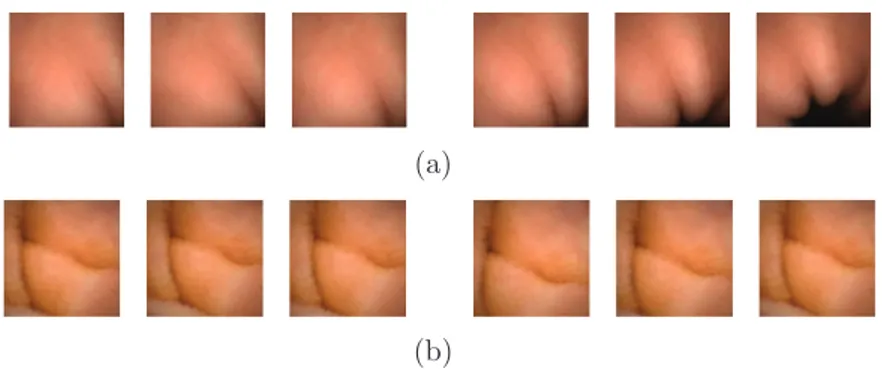
6.5 Two examples of sequences of consecutive frames. . . 55
6.6 Percentage of events and not-events in a WCE video. . . 56
6.7 Two ROC curves compare the performance of tested methods. 56 6.8 Examples of events found with the Information-theoretic method. 57 6.9 Examples of lumen and not lumen frames extracted from a WCE video. . . 58
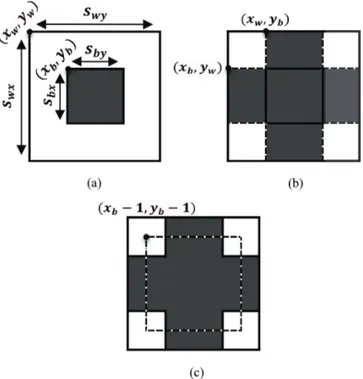
6.10 The three kinds of features proposed for lumen detection. . . . 61
6.11 Schematic representation of Haar-based features used for lu-men detection. . . 63
6.12 Schematic representation of the scales used for each feature. . 64
6.13 Example of a cascade of strong classifiers obtained in the ex-periments. . . 68
6.14 ROC curve for each dataset obtained by varying the stiffness threshold of each classifier from 0.1 to 1. . . 70
6.15 Example of some false positives detected by the system. . . 70
6.16 The three features used in the proposed method. . . 74
6.17 Comparison of recall and precision rate as a function of the number of trees in the forest. . . 77
6.18 Percentage distribution of the three types of features in the final classifier. . . 78
6.19 Some misclassified of our classifier, false positives (a) and false negatives (b) respectively. . . 79
8.1 Example of a binocular stereo system. . . 85
8.2 Scheme of a binocular stereo system with parallel optical axes. 86 8.3 Projections of two points in a binocular stereo system. . . 88
8.4 An example of a standard stereo pair. . . 89
8.5 Epipolar geometry. . . 92
9.1 The surgical robot “DaVinci”. . . 96
9.2 Schematic representation of the VisionSense technology. . . 97
10.1 The three type of bronchoscopic images used in the experiments.100 10.2 Example of application of the region growing technique. . . 106
LIST OF FIGURES vi 10.3 Disparity maps obtained using a monocular bronchoscopic video.108
10.4 A typical real bronchoscopic image. . . 110
10.5 Scheme of the canonical stereo system used in virtual reality. . 111
10.6 Examples of stereo images extracted from the proposed virtual model. . . 112
10.7 Examples of depth maps estimated with the proposed method. 115 10.8 Color depth maps integrated in the reference images. . . 116
10.9 Hardware information of the prototype of stereo bronchoscope. 120 10.10Hardware configuration of the prototype of stereo bronchoscope.122 10.11The prototype of flexible stereo bronchoscope. . . 123
10.12Checkerboard pattern used for the calibration of the stereo system. . . 124
10.13Selection of the four angles of the checkerboard. . . 124
10.14Extrinsic parameters of the stereo system. . . 125
10.15Image rectification. . . 126
10.16GUI of the acquisition software. . . 127
10.17The simulation dummy used in the experiments. . . 129
10.18Disparity maps obtained using the prototype of flexible stereo bronchoscope. . . 130
11.1 Two examples of Augmented Reality effects that can be used in the bronchoscopic context. . . 134
List of Tables
2.1 The first generation of video-capsules produced by Given Imag-ing. . . 11 6.1 Summary of experimental results. . . 57 6.2 Features number per scale. . . 65 6.3 Details on trained cascades using ten different training sets. . 67 6.4 Classification results using Boosting. . . 69 6.5 Classification results using Support Vector Machine. . . 72 6.6 Classification Results. . . 78
List of Abbreviations
AdaBoost Adaptive Boosting CE European Community DCT Discrete Cosine Transform FDA Food and Drug Administration GI GastroIntestinal
KNN k-nearest neighbor LBP Local Binary Pattern M2A Mouth 2 Anus
MLP Multilayer Perceptron
NCD Normalized Compression Distance NID Normalized Information Distance PAC Probably Approximately Correct PCA Principal Component Analysis RFID Radio Frequency Identication SBI Suspected Blood Indicator SVM Support Vector Machine WCE Wireless Capsule Endoscopy
Every passing minute is another chance to turn it all around
Chapter 1
Introduction
M
edical imaging is a generic term used to define the use of medicalpractices to create images of the human body for clinical purpose. Today it includes a wide range of different techniques and these have greatly enhanced the quantity and quality of information available in the clinical practice. The clinician may now obtain a comprehensive view of internal structures of the human body, such as heart, kidney, lung, gut and so on. Computer assistance plays a relevant role in all these clinical applications. Each imaging technique is indeed associated with some kind of specialized workstation which maintains the appropriate tools for manipulating images, performing measurements and extracting relevant information from the avail-able data. The major strength in the application of computers to medical imaging hence is the use of Computer Vision and Image Processing tech-niques to automate some specific analysis tasks.Among the thousands of possible areas, in this dissertation we exploit the current Computer Vision technologies to propose new methods in two re-search fields: “Automatic Classification of Frames from Wireless Capsule Endoscopy” and “Depth Estimation in Bronchoscopic Intervention”. In both cases the exploration of tubular internal structures of the human body through the analysis of endoscopic images asks for innovative and “smart” algorithms to translate the rough image data into useful information for the doctors.
CHAPTER 1. INTRODUCTION 4 Automatic Classification of Frames from Wireless Capsule Endoscopy Wireless Capsule Endoscopy (WCE) is a diagnostic technique used to ex-plore intestinal regions which are difficult to reach with traditional endoscopy. The large number of images produced by this technology requires the use of computer-aided tools to select only meaningful frames to speed up the analy-sis time by the expert. In the first part of this dissertation a machine learning system to automatically categorize the frames in WCE videos is proposed. Our research focus in two different classification/detection tasks. In partic-ular, we tackle the problem of the automatic detection of sudden changes in endoscopic video sequences in order to help the clinician to locate only the relevant frames for diagnostic purpose. The second problem is the auto-matic detection of specific events such as the intestinal contractions, that are often related to certain gastrointestinal disorders. It should be known that the interpretation of a medical examination by an expert is strongly related to his/her experience. The presence of low-skilled staff, together with the potential distractions of the observer, can affect directly the final report of the examination. Performing a computer-aided analysis or use a fully au-tomated one as a second opinion is hence very useful. These considerations motivated the research of classification algorithms that are addressed in this dissertation.
Depth Estimation in Bronchoscopic Intervention
3D vision systems are currently used for enhancing depth perception and to provide a greater immersive experience for different research domains. Other than for entertainment, stereo viewing has being proposed for medical appli-cations even if real appliappli-cations are at the present time at their begin. In the second part of this dissertation we intend to exploit the stereo-camera setup available in stereo-viewing systems for 3D reconstruction. In particular, we aim at extracting depth information of the bronchial scene observed through an experimental stereo bronchoscopic probe. Although we focus on broncho-scopic images, our ideas can be applied to different endobroncho-scopic procedures. In particular, the information provided by a depth map representation can
CHAPTER 1. INTRODUCTION 5 be used in different ways in an endoscopic station and it might be useful to improve the visual navigation and surgical intervention. The main important advantage of the 3D reconstruction that we try to achieve is to enable the use of Augmented Reality to support the endoscope teleguide. As a proof of concept for this research, we initially report the experiments that we have conducted on a bronchoscopic video obtained from the application of a stan-dard monocular bronchoscope. In a second section, we describe a simulation of virtual environment of a stereo-setup system over a synthetic model of a tracheo-bronchial tree. Finally, we introduce a real prototype of a stereo bronchoscope, i.e., a flexible probe equipped with a couple of micro cameras and a light source. This technological step has been developed at the labs of the “School of Engineering and technology”, University of Hertfordshire (UK), where the author of this dissertation has spent a significative time of his graduate studies, partecipating to this project.
1.1
Dissertation organization
This dissertation is structured in two parts: throughout the first part, which comprises the first seven chapters, we introduce the research conducted to au-tomatically detect specific events in endoscopic images. In particular, Chap-ter 2 describes in detail the WCE technique that provides the ensemble of endoscopic images under examination. Chapter 3 reports and discusses the relevant works that have already been published regarding the capsule en-doscopy technology. In this occasion, it is possible to know which classifica-tion problems are typically addressed and the algorithms employed to solve them. The following two chapters (Chapter 4 and Chapter 5) discuss the theory behind our experiments: Information Theory and Ensemble Learning respectively. The experiments conducted to verify our proposals are reported in Chapter 6. Chapter 7 closes the first part of this dissertation with the gen-eral discussion of our work. It also discusses which future activities may be taken to improve the results obtained insofar.
The second part of the dissertation, which includes the remaining chapters, is devoted to study the Stereoscopic Vision in the context of endoscopic
imag-CHAPTER 1. INTRODUCTION 6 ing. Chapter 8 gives to the reader some useful information on Stereoscopy. It is explained how it is possible to obtain depth clues from a pair of stereo images. It also gives some useful information on the calibration step needed to extract the camera information and to bring a pair of rough images in a standard stereo form. A literature review about Stereoscopy applied in med-ical devices is reported in Chapter 9. Chapter 10 reports the experiments conducted to test the validity of our proposal. Finally, Chapter 11 draws the conclusion and closes this dissertation.
Part I
Automatic Classification of
Frames from Wireless Capsule
Endoscopy
Chapter 2
Wireless Capsule Endoscopy
Endoscopy is the most prevailing modality for diagnosing gastrointestinal dis-orders. Nowadays, there are several different endoscopic procedures varying from colonscopy and enteroscopy to full intraoperative endoscopy. The tra-ditional “push” endoscopy involves the use of a surgical probe-tube equipped with a micro camera and a light source. The physician conducts the probe by moving it forward along the bowels and examines the recorded images projected on a screen. Modern endoscopes also contain an accessory chan-nel, which allows to insert medical instruments to take tissue sample and perform endoscopic resections. Although this procedure is efficient both for diagnostic and therapeutic purposes, it is usually limited by the depth of the insertion of the scope allowing only the exploration of the upper small intestine. The exam also requires the presence of a qualified staff and the need of hospitalization and sedation of the patient.
While progressive size reductions in probes and imaging enhancements are enabling ongoing technical improvements in endoscopes, the rigid structure and the thickness of the probe do not allow the exhaustive exploration of long and convoluted regions like the small intestine. Limitations of current endo-scopic techniques in the identification of small bowel disorders have prompted a search for alternative technologies. For this reason, a new technique called Wireless Capsule Endoscopy (WCE) [1],[2] has been introduced as a new less invasive and painless kind of endoscopy.
CHAPTER 2. WIRELESS CAPSULE ENDOSCOPY 9 WCE employs the use of a pill-shaped device that is swallowed by the patient and it is propelled through the gut by the physiological intestinal peristalsis. The front-end of the capsule is equipped with a tiny camera and a transmitter wirelessly sends the recorded images to an external receiver. Once the study is finished, the recorded movie can be easily downloaded into a workstation with the appropriate software for its posterior analysis by the expert. As the quality of the images obtained with WCE improves, this technology is strongly elective to detect abnormalities such as ulcers, bleedings or the presence of tumors in the small intestine. The exam is also less uncomfort-able to the patient because it is required only to swallow a capsule. Once activated, the capsule approximatively captures two frames per second; WCE operates for about 8 hours, that corresponds to the lifetime of the battery of the capsule, reaching up to 50000 useful images at the end of the exam-ination. Images taken during the entire route of the capsule through the intestine are successively analyzed by an expert. He/She may spend up to one or more hours to gather the relevant information for a proper diagnosis. This greatly limits the use of the capsule technology as a diagnostic routine tool. Recognition of frames displaying a pathology is indeed a hard problem, and pre-processing of the whole ensemble of the frames to eliminate those that do not carry relevant information is a much needed step.
The advent of WCE endoscopic imaging technique has led to the develop-ment of a new branch of computer-aided support systems. Such systems may be deployed using Computer Vision techniques to assist a medical expert in improving the accuracy and the annotation times of medical diagnosis. Some typical tasks that can be facilitated by the use of these computer-aided tools are related to anomaly detection and categorization, data reduction and clus-tering, and automatic topographic segmentation of an endoscopic video. This chapter reviews the fundamentals of WCE. Special care is paid to the structure of the capsule, with the relative benefits and drawbacks. After presenting some basic theoretical notions, we focus on the images we get out of this imaging technique, analyzing how these ones differ according to the digestive tract in which they were recorded. In order to make easier the understanding of this work, this chapter ends with a brief overview of the
CHAPTER 2. WIRELESS CAPSULE ENDOSCOPY 10 human digestive system.
2.1
WCE system details
The first prototype of the modern WCE was made in 1981. Its creator, the Israeli Gavriel Iddan, worked at the research center of the Israel Defense Forces (IDF) to design elettro-optical visors applicable on rockets. Iddan ex-ploited the latest miniaturization technologies to create a new revolutionary system for gastrointestinal endoscopy, in which images are acquired by means of a swallowable micro-camera traveling within the digestive tract driven by the peristaltic movements. Once built an initial prototype and carried out their feasibility studies, it was performed testing on animals. In 2001, with the approval of FDA (Food and Drug Administration) and applying the CE mark , the application was extended to human people as a system to routine diagnostic endoscopy [3]. Around the capsule, Iddan founded the company “Given Imaging” [1] that aims to develop and commercialize worldwide this new technology. The system was patented under the name “Mouth 2 Anus (M2A) Given Diagnostic Imaging System.” Capsule endoscopy immediately raised great interest as it opened the opportunity to exhaustively explore the entire small intestine without any discomfort. With thousands of physi-cians now using the capsule as part of the initial endoscopic check-up, several articles have been written indicating this new technology suitable for some diseases as small bowel tumors, celiac disease, bleedings [4, 5].
The WCE technology is composed by means of three main subsystems: a ingestible capsule, a recording device and a workstation equipped with pro-prietary data processing software.
The capsule is disposable, which means it will not be recovered after the expulsion that naturally occurs 10 to 72 hours after the ingestion. The characteristics of the capsule may vary depending on the manufacturer. The pioneer WCE company, Given Imaging, commercializes capsules for the vi-sualization of the mucosa in the small bowel (PillCamTM SB), esophagus
CHAPTER 2. WIRELESS CAPSULE ENDOSCOPY 11
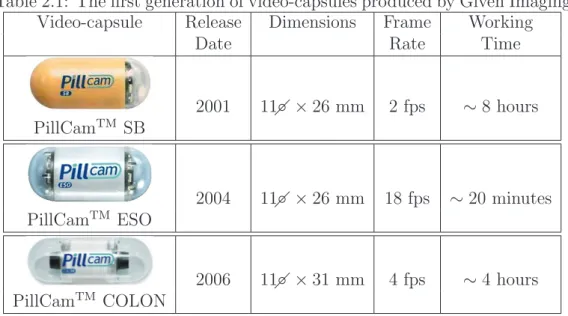
Table 2.1: The first generation of video-capsules produced by Given Imaging. Video-capsule Release Dimensions Frame Working
Date Rate Time
2001 11◦ × 26 mm 2 fps ∼ 8 hours PillCamTM SB 2004 11◦ × 26 mm 18 fps ∼ 20 minutes PillCamTM ESO 2006 11◦ × 31 mm 4 fps ∼ 4 hours PillCamTM COLON
capsules have the same dimensions, even if they acquire images at two differ-ent frame rates. This is due to the differdiffer-ent travel times of the capsule, which takes about 8 hours to go through the small intestine and 15-20 minutes in-side the esophagus. All small bowel capsules have only one camera, whereas Given Imaging’s esophagus and colon capsules have two of them. The idea of adding a camera comes from the need to maximize the covered surface for intestinal regions of higher diameter. It also helps to store more information in regions where the capsule travels quickly. PillCamTM COLON captures
4 frames per second and the imaging devices on either end of the capsule provide a near 360◦ view of the colon (Table 2.1).
The quality of WCE imaging has improved through the years. The reso-lution and lighting conditions are now significantly better. Given Imaging company has already reached the next generation of the capsules, which sat-isfies a higher frame rate maintaining the dimensions of the old generation. Another capsule distributor, Olympus [2], produces capsules based on the same size as the Given capsule but with a charged-coupled device (CCD) rather than a CMOS imager. It also provides a viewer showing real time information on the route covered by the capsule inside the patient’s torso.
CHAPTER 2. WIRELESS CAPSULE ENDOSCOPY 12
(a) (b)
Figure 2.1: (a) Illustration of a video-capsule together with the distribution of its components in scale (b).
Figure 2.1 shows the structure of the PillCamTM SB capsule1. It is an
as-sembly of well-tried image acquisition components. The external case is a biocompatible plastic capsule weighting 3.7g and measuring 11 mm ×26 mm. The body of the capsule hosts the following components: an optical dome (1), a lens holder (2) with a short focal length lens (3), four illuminating LEDs (4), a CMOS (Complementary Metal Oxide Semiconductor) sensor (5), two bat-teries (6), an application-specific integrated circuit (ASIC) radio-frequency transmitter (7) and an external receiving micro-antenna (8). The capsule comes from the manufacturer ready to use and it starts to transmit on re-moval from a storage compartment, which contains a magnet that keeps the capsule inactive until use.
The recorder device involves the use of eight receiving antennas taped to the patient’s torso, similarly to the electrodes adhesives used for the elec-trocardiograms. These collect the signal transmitted by the capsule and send it to the receiver carried on the patient’s belt (Figure 2.2). It starts to record as soon as a signal is received from the video-capsule. The characteristics of the recorder allow the patient to wear it easily under clothing and to continue a normal daily activity. Patients are asked to avoid abrupt movements and
1Notice that the specific Given Imaging products are used here to explain the WCE
technology. After Given PillCam was introduced, many types of video-capsules have been developed and are available in the market [6, 7, 8].
CHAPTER 2. WIRELESS CAPSULE ENDOSCOPY 13
(a) (b)
Figure 2.2: (a) The antennas array that transmits the capsule’s signal to a recorder worn by the patient (b).
to constantly monitor a flashing light on the receiver for the confirmation of a good signal reception. In the last years the recorders have been improved. The capacity, battery life and reliability are now significantly better to re-flect different types of capsules. They are easy to use and contain intuitive LEDs for signal reception and battery level. A typical capsule endoscopy exam takes approximatively 7-8 hours. Once the exam is finished, the pa-tient comes back to ambulatory to deliver the recorder containing all the images captured by the capsule and wirelessly transmitted.
The workstation is a dedicated computer equipped with a proprietary data analysis software. It allows to watch the entire examination, with a special utility enabling to get quickly any image within the video. The physician reads the video in one of several formats, captures and labels the salient information, and then prepares a final report. As already mentioned, this is one of the main drawbacks of endoscopy through video-capsule. Notice that a good diagnosis requires up to two hours, and it highly depends on the physician’s experience. This process is also so exhausting that the physician rarely performs two consecutive diagnoses. At the end of the analysis all the annotated information are automatically saved. These findings files can be saved on a CD, a DVD or any other storage device and then sent to colleagues for consultations. For further details on using this software, refer to Section 2.4.
CHAPTER 2. WIRELESS CAPSULE ENDOSCOPY 14
2.2
Benefits and risks of capsule endoscopy
Since its introduction, more than 1.000.000 patients worldwide have benefited from the capsule endoscopy. As with all new technologies, the practical use of the capsule led to the introduction of improvements to the diagnostic system that, in turn, has opened new fields of clinical use. Already in the early studies it was possible to assess the operational characteristics and the limits of the capsule:
• Usability: It is much less invasive than traditional endoscopy, since the patient simply has to swallow a vitamin-size capsule, which will be expelled in the normal cycle through the defections. The application of the system (antennas, recorder, batteries) to the patient is very easy and can be carried out, with a minimum of training, even by unskilled staff.
• Tolerability: The majority of the patients succeeds in swallowing the capsule with some sips of water. The application of the antennas on patient’s torso has not resulted in complaints by patients.
• Completeness of the examination: As already mentioned, the cap-sule is strongly indicated to the exploration of the small intestine. It sometimes allows to capture images of the esophagus, but the rapidity of oesophageal transit rarely allows to capture significant findings. In such cases it is suggested to use the Given PillCam ESO: it contains an imaging device at both ends of the capsule and take up to 18 frames per second as it passes through the esophagus. Nowadays, however, capsule endoscopy cannot exhaustively replace the use of standard en-doscopic procedure; indeed, it is often complementarily used with other examinations. Since the capsule has not therapeutic capabilities, any abnormalities detected by the capsule must be further investigated by the standard endoscope. This has the proper tools for the extraction of intestinal tissue destined to a later histological investigation. Further-more, the movement of the capsule within the digestive tract is passive and driven by peristalsis. The recorded area is hence unpredictable, it
CHAPTER 2. WIRELESS CAPSULE ENDOSCOPY 15 is patient dependant, and it is not conceivable the employment of the capsule in place of the standard endoscopy.
One of the main concern, although it rarely appears, is related to the cap-sule retention when it is not naturally excreted in the feces within two weeks after the ingestion. If it occurs, it is necessary to remove it through the surgery. Capsule endoscopy is hence controindicated in patients with known or suspected intestinal stenosis or with the presence of severe deformities of the digestive tract. Recently, a “patency” capsule that does not require any preparation has been introduced in the market. The utility is to scan the bowels to verify an adequate patency of the gastrointestinal tract in patients with known or suspected strictures prior to administration of the video cap-sule in safety and tranquillity. This capcap-sule is made of specific materials decomposing with the contact to the intestinal contents in a few days after the ingestion. It also contains a Radio Frequency Identication (RFID) tag to determine capsule location.
Other contraindications to the application of the video-capsule refer to pa-tients which have suffered previous invasive surgery on the abdomen and when there is the presence of pacemakers or other electrical medical equip-ment. This is due to the possible interferences between those systems and the WCE radio transmitter. Some technical malfunctions related to the capsule have been reported but were rarely significant [9]. The increasing interest in this technique and the technology improvement would make these issues occurring less frequent.
The most critical limitation concerns the discharge time of the images from the portable recorder and the long annotation time that each exam needs from a trained specialist. He/She may spend up to one or more hours to gather the relevant information for a proper diagnosis. This greatly limits the use of the capsule as a diagnostic routine tool. Such shortcoming may be overcome if the WCE video is automatically segmented into shorter videos, each one relative to a different trait of the bowels, and if reliable automatic annotation tools are available to the clinicians. Unfortunately, the goal of automatically producing a summary of the whole WCE video remains yet unaccomplished. Tools to extract semantic information from such videos,
CHAPTER 2. WIRELESS CAPSULE ENDOSCOPY 16 such as the one presented in this work, are relevant research products for applied Pattern Recognition investigators.
2.3
Typical capsule endoscopy images
Wireless Capsule Endoscopy produces images of the digestive tract, covering a circular 140◦ field of view. An average exam has around 50.000 images
where 1000 are captured in the gastrointestinal tract entrance, 4000 in the stomach, 30000 in the small bowel and 3000 in the large intestine. The cap-tured frames have three 8 bit color planes with a 256×256 pixels resolution, rendering a circular area of 240 pixels of diameter. The black area surround-ing each rendered frame usually contains some further information, like the exam’s date and the patient’s name (Figure 2.3).
Figure 2.3: A typical Wireless Capsule Endoscopy frame.
Each incoming frame can be visually classified according to the characteris-tics of the intestinal mucosa and other typical elements that may be present into the bowels, like bubbles, bleedings, residuals, ulcers, etc. The physician recognizes these events mainly using color and texture pattern, determining the status of the intestinal mucosa. Figure 2.4 illustrates sample images of healthy regions and organic lesions of the gastrointestinal tract. In particu-lar, Figure 2.4(a) shows a detailed view of the normal mucosa of the small bowel. It is an intestinal region with uniform pink hue. Bleeding is defined as the flow of blood from a ruptured vein into the digestive tract. The visual feature used to characterize this scenario may rely on the intensity of the red
CHAPTER 2. WIRELESS CAPSULE ENDOSCOPY 17
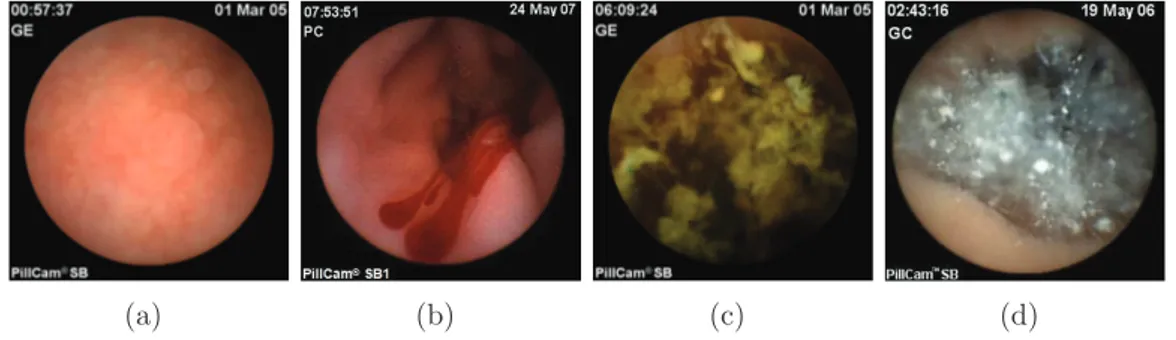
(a) (b) (c) (d)
Figure 2.4: Different examples of capsule endoscopy scenarios. (a) Normal small bowel mucosa. (b) Bleeding. (c) Residual. (d) Intestinal juices.
color component (Figure 2.4(b)). Instead, green color is usually related to the presence of fecal materials (Figure 2.4(c)). In WCE, the good visibility of the internal tissue is sometimes obstructed by the intestinal juices, which can be visualized as a turbid liquid accompanied by bubbles or other elements related to the flow of different gastric juices (Figure 2.4(d)).
It should be noticed that the gut is not motionless; the physiological motion peristalsis may reverse or incline the capsule recording a variety of orien-tations of the scene. In addition, it is needed to consider external factors such as the lighting of the capsule which can sometimes falsify the perceived colors. The number of scenarios in which a certain event can be recognized is hence very impressive.
2.4
Manual annotation
Once the examination is finished, the patient delivers the data recorder con-taining the images captured by the capsule. A workstation with proprietary software is used by the physician for the analysis of the video. This means that the physician needs to view the full 50 thousand images2, annotate all
the relevant ones, and create a final medical report with the summary of the conducted investigation. The expert also includes all the diagnostic conclu-sions and any checks to be performed for the monitoring of certain diseases.
2The number of collected frames may range depending on which type of examination
CHAPTER 2. WIRELESS CAPSULE ENDOSCOPY 18
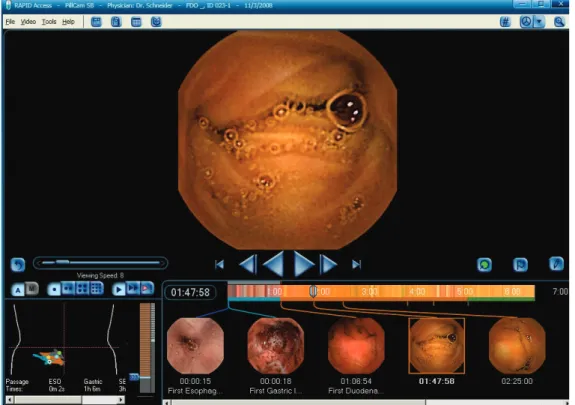
Figure 2.5: Rapid Reader exam annotation software developed by Given Imaging.
Performing correctly the analysis is difficult, requires trained staff and time to perform the needed analysis.
Figure 2.5 shows a snapshot of the visualization tool provided by Given Imag-ing: Rapid Reader. Two main motivations lead us to adopt this software. Considering that we have a dataset of images coming from Given capsules, the only way to handle this data is with the dedicated software. It can also be downloaded for free directly from the manufacturer’s site.
The RAPID (Reporting And Processing of Images and Data) software suite enables efficient management of capsule endoscopy studies from initiation, through review and analysis, to report generation. With solutions for every capsule endoscopy workflow, this software suite provides multiple reading modes, advanced analysis features that aid in image interpretation, intuitive report generation, convenient study management, and network connectivity. The physician can review the WCE video by using all the available features
CHAPTER 2. WIRELESS CAPSULE ENDOSCOPY 19 and utility provided with the application software. Video images can be viewed in single or mosaic format and with different frame rates. This de-pends on the experience of the physician; specialized users tend to display multiple images at once while maintaining a higher reading frame rate. The software also contains three important utilities:
• The first is a time bar that allows the doctor to understand the context of a specific intestinal image. This bar contains the average color of the images to which it refers. In this way it is possible to track the movement of the capsule and its travel times through each intestinal organ.
• The doctor is facilitated in the preparation of the report by the presence of a comprehensive atlas. This provides side by side comparison of an image in a case currently under review with atlas reference images. • Rapid Reader software includes a Suspected Blood Indicator (SBI)
designed to detect bleedings in the video. However, this tool has been reported to have insufficient specificity and sensitivity. This means that it may display a high number of false positives but it is useful for capture regions with active bleedings.
2.5
The digestive tract
In this section we give some useful information to the reader about the human digestive system. This is done to better understand the classification tasks addressed in this work and how these differ according to different organs of the intestinal tract. A simplified description of the human gastrointestinal tract appears in Figure 2.6.
The digestive system, also known as the gastrointestinal (GI) system , can be seen as a long tube (about 4-7 meters) that passes through the body, starting at the mouth and ending at the anus. It is capable of absorbing the nutritional contents from the ingested food eliminating the waste out of the body. The function and the visual appearance of each different section of the
CHAPTER 2. WIRELESS CAPSULE ENDOSCOPY 20
Figure 2.6: A schematic illustration of the human GI tract.
gut highly depends on the physiological task to which is part is devoted. A first distinction is generally done between the upper GI tract and the lower GI tract. The first one is composed by the oral cavity (mouth and pharynx), the esophagus, and the stomach. Typically, these portions of the digestive system are viewed using standard probe-based endoscopic procedures. The stomach is a big bag covered with a thick mucosa membrane containing gastric juices. In its relaxed state contains several longitudinal folds and in the pylorus, the terminal region of the stomach, the diameter is about two centimeters. Automatically locating the pylorus is of great advantage because it provides the expert with the point at which food passes into the duodenum, the first part of the small intestine.
CHAPTER 2. WIRELESS CAPSULE ENDOSCOPY 21
Figure 2.7: The lower GI tract.
The lower GI section is hardly practicable as it is much longer and articulated; it comprises the small intestine, large intestine, and anus (Figure 2.7). The small intestine presents three different areas: duodenum, jejunum and ileum. The main duty of the duodenum is to continue the digestion done by the stomach. The next part of the small intestine is called the jejunum, and the third is called the ileum. Except by close internal histological inspection, these two parts cannot be readily separated as they present a similar visual appearance: the intestinal walls are plain in the relaxation state, but they contract creating folds during the motility activity. The ileum has a paler color, and tends to be of a smaller caliber as well. Together the jejunum and the ileum contribute more than 15 feet to the small intestinal length. The ileum ends by opening into the large intestine, or colon, via the ileocecal junction.
The last region of the intestinal tract is the large intestine which is about 150 cm long and 6 cm in diameter. It does not contain many folds as the small intestine and the larger diameter makes the diagnosis difficult for capsules designed for the small intestine.
Chapter 3
Literature review
The previous section has provided a description of WCE as a technological advancement in the area of diagnostic endoscopy. The increasingly clini-cal relevance is evidenced by different studies that compare the examination through the video-capsule with the traditional endoscopic procedures. It is quite clear that capsule endoscopy performs better than push enteroscopy in diagnosing patients with difficult gastrointestinal bleedings [5],[10]. It is also commonly used in other clinical conditions, such as the detection of Chron’s disease in the small bowel [11],[12], celiac disease [4], small bowel polyposis and tumors [13]. Sometimes is used to study the impact of drugs on the gas-trointestinal tract [14]. Moreover, children can benefit from this technology as well as adults [15].
The main issue is related to the final report of the examination. A consid-erable amount of time is required to view and interpret the many thousand of images produced during the examination. This is a difficult and tedious task that requires a qualified staff.
Since the vision is the main feature of an optical system such as the video capsule endoscopy, Computer Vision techniques may help to automatically select and detect the salient information enclosed in WCE data. Although the research conducted on this new endoscopic technology is still in an intro-ductory phase, a significant number of papers have already been published. The application of Computer Vision in capsule image analysis can be
CHAPTER 3. LITERATURE REVIEW 23 vided in two categories. The first considers the topographic segmentation of a WCE video into meaningful parts such as mouth, esophagus, stomach, small intestine, and colon. Regarding the second category, there are several works which seek to identify clinically relevant video events. Some instances include the automatic detection of bleedings, intestinal juice, intestinal con-tractions, ulcers.
In this chapter we offer a brief survey of research related to the classification of images extracted from WCE videos.
3.1
Topographic segmentation
One of the main issue in wireless capsule imaging is the creation of a map of the data recorded by the capsule during the navigation through the gut. To this aim, topographic segmentation performs a segmentation of an endo-scopic video into shorter videos, each one relative to a different trait of the gut. Some intestinal diseases may reside in a specific segment of the intes-tine; each digestive organ thus requires a different level of attention by the clinical viewer. A comprehensive map of the examination enables a medical expert to browse to a particular areas of interest, making the analysis of the examination faster.
Most of the work found in literature tend to split the endoscopic video into four main sections (for a better understanding see Section 2.5):
• Entrance: Once it is activated, the capsule is outside the body for no more than few seconds. Then, it is swallowed by the patient and it quickly reaches the esophagus until the esogastric junction separating this from the stomach. This subset of data is clinically irrelevant be-cause the capsule travels very fast in these areas that can adequately be observed using traditional probe-based endoscopic procedures. From an Image Processing perspective, it is possible to find images with sev-eral color and texture variations: we can see the capsule cover, outside world, teeth, tongue, etc.
CHAPTER 3. LITERATURE REVIEW 24 • Stomach: This area begins in the esogastric junction and ends in the pylorus. Although it is clinically relevant, it is difficult to find relevant events since the peristalsis may reverse or incline the capsule due to the higher diameter of this tract. The images in this area are usually light red and smooth. Finding the pylorus in the video can be difficult and time-consuming, even for an experienced viewer, as visually the stomach tissue in the pyloric region and the tissue at the beginning of the intestine appear very similar.
• Small Intestine: This is the region in which the capsule has the most significant clinical impact. The small intestine is the longest region of the gastrointestinal tract. This tubular section usually contains semi-digested foods, intestinal juices, enzymes. It is divided from the colon by the ileocecal valve. Annotating this boundary is even more diffi-cult because intestine and colon tissue are very similar and are often contaminated with faecal residuals that occludes the camera view. • Large Intestine: The last topographic section encountered by a WCE
begins in the ileocecal valve and normally ends when the capsule’s battery runs out. This area suffers from very low visibility due to the high concentration of food and faecal material. It does not contain as many folds as the small intestine, but the larger diameter leads the capsule to freely move making the diagnosis difficult for capsules designed for the small intestine.
The topographic segmentation task is roughly equivalent to the search of those boundaries in the video. Since 2001, a considerable number of works have been published regarding this task.
The authors in [16] propose a technique to perform the boundary detection task based on color change pattern analysis. When a capsule travels around a boundary between two different digestive organs, the corresponding color signal has a sudden change. This methodology characterizes the contractions of WCE videos using energy function in a frequency domain. They segment a WCE video into events by using a high frequency content function. The de-tected boundaries event indicate either entrance in the next organ or unusual
CHAPTER 3. LITERATURE REVIEW 25 events in the same organ, such as bleedings, intestinal juices, and unusual capsule movements. It is hence possible that boundary events may contain other smaller events representing something else. The authors classify these events through a threshold-based correlation rule into higher level events that represent digestive organs. The experimental results indicate that a high percentage (76%) of detecting correct boundaries events and a precision of 51% have been achieved. The methodology manages to detect the most of stomach and duodenum, but the accuracy in the ileum and cecum is worse. A relevant series of papers performs an automatic gastrointestinal tissue dis-crimination resulting in the segmentation of various intestinal organs [17, 18, 19, 20, 21, 22, 23]. In these papers, feature extraction procedure is per-formed in the same way: the authors create a feature vector using color and texture information. To this aim, images are initially converted in HSI color space. They derive a color features from Hue Saturation chromaticity histograms, compressed using a hybrid transform, incorporating the Dis-crete Cosine Transform (DCT) and Principal Component Analysis (PCA) . Because of the abrupt intensity changes in WCE images, the intensity com-ponent is removed to achieve intensity invariance and data size reduction. In [17] a second feature combining color and texture information is derived using Local Binary Pattern (LBP). Having extracted feature vectors, the next stage involves classifying them as belonging to a specific digestive tract. There are several classifiers which can perform this task. In [19] the system is trained to detect mouth/esophagus and stomach, stomach/intestine, and intestine/colon using k-nearest neighbor (KNN) and Support Vector Machine (SVM) classifiers. The work in [20] is similar to the previous one; additional regions have been discriminated both in stomach and intestine. Histograms built using the entire image may contain visual contamination present in the image. Some examples of such noise is the presence of bile, saliva, food re-mains, air bubbles and so forth. In order to minimize the affect of noise in the image, the authors divide the WCE image into 28 sub-regions and process only those regions where tissue is clearly visible. They derive five parame-ters for each of the sub-images (Mean Intensity, Saturation, Hue, Standard Deviation of Intensity and Hue). Then, each sub-image is tested and it is
CHAPTER 3. LITERATURE REVIEW 26 discarded if exceeds the range of reference values for visually clear images of stomach or intestine tissue.
Coimbra et al. [24, 25, 26, 27] deal with the task of topographic segmentation by using a novel visual descriptor called MPEG-7 [28]. This defines a variety of visual descriptors for multimedia content, including audio, speech, graph-ics and their combination. In [24] the authors use this descriptor adapted to the WCE specific scenario. The final segmentation is based either on Bayesian or SVM classifiers. In particular they trained four SVMs classi-fiers, one for each boundary (esogastric junction, pylorus, ileo-cecal valve), determining thereby the belonging topographic section of each frame. De-spite good results have been achieved in [24, 25], the authors suggest to use content features with context information [29]. Such new information may include the approximated capsule spatial location inside the body with the relative capsule velocity.
All these works disregard the computational cost to perform the segmenta-tion. Notice that some capsules manufacturers [2] offer original viewer to physician providing real-time examination imagery. It is hence highly desir-able that these computer-assisted tools can run on simple portdesir-able hardware that might be incorporated, for example, next to the portable hard-drive car-ried in the patient’s belt during the procedure. To this aim, in a more recent paper Coimbra et al. [30] show how a compressed domain color information can be used to perform topographic segmentation as well as algorithms using fully decoded images saving about 20% of the computational cost.
3.2
Event detection
With the video segmentation into coherent intestinal sections, the expert can easily access to the images taken in a specific intestinal tract. The next step consists in automatically detect some typical intestinal scenarios in order to reduce the analysis time by the expert to do a diagnosis. Only a small amount of interesting images for diagnostic purposes are indeed usually spread in thousands of useless images. Notice that a higher amount of false positives than of false negatives is typically preferred for this kind of applications. The
CHAPTER 3. LITERATURE REVIEW 27 presence of a high number of false positives result in more time spent by the expert to do a diagnosis. Losing a rightful event is a worse event because it means to miss relevant information with the resulting inaccuracy in the final report.
3.2.1
Intestinal contractions
Dysfunctions of the intestinal motility are often related to certain disorders that may occur with different symptoms [31]. The analysis of intestinal contractions in the small intestine, in terms of number, frequency and distri-bution, represents one of the methods with greater clinical significance. An intestinal contraction involves a sequence of frames in which the intestinal lumen shrinks, tending to the maximum closure, and then expands again. The typical appearance hence consists in a dark area surrounded by the typ-ical rays that muscular tone produces due to the folding of the intestinal wall. In [32] the authors propose a technique based on anisotropic image filtering and efficient statistical classification of contraction features. The procedure to detect the typical star-shape of a contraction is accomplished in three steps. The skeleton of the wrinkle pattern is extracted. Then, it is verified whether the point at which all the rays converge corresponds to the closure of the intestinal lumen. Finally, a set of descriptors were estimated taking into account the radial organization of the wrinkle skeleton around the intestinal lumen. Classification is performed by using a SVM classifier with radial basis function. The system reaches a sensitivity of the order of 90.84% and a specificity of the order of 94.43% respectively.
3.2.2
Intestinal juices
In many images the information needed for a correct diagnosis is sometimes obscured by intestinal elements, such as gastric juice, bubbles, residuals. These intestinal elements are constituted by turbid liquids with color ranging from green to white. They often are visualized together with bubbles or other artifacts related to the flux of different fluids into the gut (Figure 3.1). The authors in [33] point out the the most relevant feature of the intestinal
CHAPTER 3. LITERATURE REVIEW 28
Figure 3.1: Examples of endoscopic frames showing intestinal juices.
fluids is the presence of bubbles of different sizes and circular shapes. To characterize these items they rely on the use of a Gabor filters bank of 16 units with orientations 0◦, 45◦, 90◦, 135◦ and standard deviations σ = 1, 2, 4, 8. By
using a threshold-based mechanism, they obtain a binary image in which the intestinal fluids are emphasized. Those images with detected region of bubbles greater than 50% of the useful visualization area are excluded. It can be observed that an overall reduction in visualization time about 23% is achieved.
3.2.3
Bleeding detection
Bleeding in the digestive tract is often a symptom of some diseases, rather than a disease itself. The cause of bleeding may not be serious, but locating the source of bleeding is critical. The Given proprietary software provides an automatic image analysis tool called Suspected Blood Indicator (SBI), which is devoted to find in the video areas with active bleedings. However, this tool has been reported to have insufficient sensitivity and specificity [34]; to be safe, the physician must continue to manually check for bleedings.
To overcome this problem, in [35] a technique to automatically detect the bleedings regions using the expectation maximization (EM) clustering algo-rithm and Bayesian information criterion (BIC) is proposed.
When it is performed a visual inspection of gastrointestinal images, one of the most salient feature indicating the presence of bleeding is a deeply red
CHAPTER 3. LITERATURE REVIEW 29 appearance or the presence of dark red regions. Finding a red dominant color in the gut is very common, but the red in non-bleeding regions usually appear with lower color saturation. The authors in [36] exploit this idea and propose a two-steps bleedings detection algorithm. The first step provides an efficient block-based discrimination of the input frames that contain bleed-ing features from those that do not correspond to bleedbleed-ing. The second step refines the initial classification and increase its reliability using a pixel-based saturation-luminance analysis. To make the classification more complete, im-ages are categorized into several levels of bleeding activity or as non-bleeding. A 4-level bleeding classification is applied: level 0 indicates non-bleeding and level 3 indicates highly intensity bleeding. The system sensitivity achieved is 88.3%.
Recently Li et al. [37] propose a method to detect either bleeding and ulcer by means of chromaticity moments, which make use of the Tchebichef poly-nomials and the illumination inviariant provided by the HSI color space. To reduce effects of visual contaminations such as bubble, fecal material and the dark regions that occur often in this kind of images, the authors divide the endoscopic frame into a grid of 36 non-overlapping blocks calculating six chromaticity moments for each one. The blocks are finally classified using an MLP (multilayer perceptron) Neural Network with 4-fold cross-validation.
3.2.4
Anomaly detection
In this section we provide a brief overview of published works related to the detection of abnormal lesions in endoscopic images. In this way, one of the first Image Processing studies was conducted by Boulougoura et al. [38]. The authors propose to use a feature vector composed by nine measures (stan-dard deviation, variance, skew, kurtosis, entropy, energy, inverse different moment, contrast and covariance) extracted from histograms of six channels (R,G,B,H,S,V). The implementation of an advanced neural network scheme and the concept of fusion of multiple classifiers dedicated to specific feature parameters have been adopted to classify the images as normal or abnormal. The detection accuracy achieved by this system is 100%. However, at the
CHAPTER 3. LITERATURE REVIEW 30
Figure 3.2: Examples of endoscopic frames showing ulcers.
time of this paper the system was evaluated using only 73 capsule images, which were split into the training set and the test set, and therefore it is difficult to draw conclusions about its potential application in a diagnostic station.
Li et al. [39] propose a new feature extraction scheme based on the use of curvelet transformation and LBP to discriminate ulcer regions from normal regions (Figure 3.2). The traditional wavelets transform extracts directional details capturing only horizontal, vertical and diagonal activities in an im-age, and these three directions cannot in general provide enough directional information in images. To this aim, curvelet transform is employed as a new multi-resolution analysis tool. The basic idea is to represent a curve as a superposition of functions of various lengths and widths obeying a specific scaling law. Taking into reference 2D images, this may be obtained by decom-posing an image into wavelet sub-bands. Each sub-image of a given scale is then analyzed with a ridgelet transformation, another type of tool for multi-resolution analysis. It should be known that capsule endoscopy images suffer from sudden changes in lighting due to the movement of the capsule and the
CHAPTER 3. LITERATURE REVIEW 31 limited range of illumination inside the digestive tube. The authors propose to use LBP after they applied curvelet transformation to images. In this way they obtain robust performance to illumination variations. By using uniform LBP histogram, they obtain six statistical measurements of the histogram as features of texture in order to reduce the number of features. These fea-tures are standard deviation, skew, kurtosis, entropy, energy and mean of the histogram. To reduce effects of visual contaminations such as bubble, faecal material and dark regions that occur often in capsule endoscopy im-ages, they divide each frame into small patches extracting textural features from each one of them. To verify the performance of this features extraction scheme, the authors deploy MLP neural network and SVM to demonstrate their power in differentiating normal regions and ulcer regions in capsule endoscopy images. The best results are obtained using the MLP classifier and the YCbCr color space. With these parameters the system achieves an accuracy of 92.37%, a specificity of 91.46% and a sensitivity of 93.28%. More recently, Bejakovic et al [40] present a method that uses color, texture and edge features to detect lesions (in particular Chron’s disease) in capsule endoscopy images. They use MPEG-7 visual descriptors and Haralick tex-ture featex-tures. This includes MATLAB adaptation of dominant color (DCD), homogeneous texture (HTD) and edge histogram (EHD). Haralick features include angular moments, contrast, correlation, and entropy measures, which are computed from 1 pixel co-occurrence matrix. They used SVM to classify images into three categories: lesion, normal tissue, and extraneous matter (food, bile, stool, air bubbles, etc). The dataset used to evaluate their sys-tem is composed by images selected from ten studies. For each study only 10% of the data was used to train the classifier; the remaining data was used for validation. Over the ten studies, lesions could be detected with an accu-racy rate of 96.5%, normal tissues 87.5% and extraneous matter 87.3% using dominant color information alone.
Finally, Li et al. [41] develop a computer aided system to diagnose small bowel tumors. They propose a new textural feature built by using wavelet and LBP. Notice that tumors exhibit great variations in color, size and shape, so a single classifier may not be discriminative enough to make a right decision
CHAPTER 3. LITERATURE REVIEW 32 about status of these difficult images. To this aim, the system is evaluated using an integration of KNN, MLP neural network and Support Vector Ma-chine. The database used for the classification consists of 600 representative small bowel tumor images and 600 normal images previously labeled by the physician. Comparative experimental results show that this scheme achieves a promising performance for small bowel tumor detection.
Chapter 4
Information Theoretic Method
Information Theory aims to identify the theoretical concepts for the study of problems related to the transmission, reception, processing and storing infor-mation. Although at first sight it seems to be a very specific application, this theory has important implications (and applications) in many areas. Infor-mation Theory is usually dates back to 1948, when Claude Shannon published “A mathematical Theory of Communication” in which he introduced for the first time a systematic study about information and communication. He also formulated the key concepts of the theory, such as entropy and mutual information and introduced the fundamental laws of data compression and transmission. Entropy is a measure that quantizes the information contained in a random process. Mutual information is a measure of the information contained in one process about another process. However, Shannon’s entropy is relative to some probability distribution generating data. In many cases such a distribution is unknown or does not even exists. To this aim, Kol-mogorov complexity has been connected with Information Theory and proved to be closely related to Shannon’s entropy rate of an information source. In both theories, the amount of information in an object may be defined as a function of the length of the object’s description. In the Shannon approach, however, the method of encoding objects is based on the presupposition that the objects to be encoded are outcomes of a known random source; it is only the characteristics of that random source that determine the encoding, not
CHAPTER 4. INFORMATION THEORETIC METHOD 34 the characteristics of the objects that are its outcomes. In the Kolmogorov complexity approach we consider the individual objects themselves and the encoding of an object is a short computer program (compressed version of the object) that generates it and then halts [42]. Kolmogorov complexity is a measure that answers the question: how random is an individual bit string or message? Complexity is in this case intended to define the amount of information contained in a particular message in terms of the number of bits necessary to describe it. More random objects would require more bits to de-scribe them, so the Kolmogorov complexity is also a measure of how random a particular message is. In contrast, the Shannon entropy is an answer to the question: how random is an entire distribution of messages overall? En-tropy measures the expected amount of information contained in any given message within that distribution.
In this chapter, some basic notions of Information Theory and Algorithmic Information Theory describing an absolute information-theoretic distance be-tween bit strings are presented.
4.1
Entropy
Given a generic event E, how can we define the informative content of this event? Shannon starts from the consideration that the observer should have some ideas of the probability that such an event occurs. The basic idea is that the information has to deal with uncertainty: more the observer is surprised to see a symbol, the more the level of informative content will be high (and viceversa). Suppose we have a set of possible events with a-priori distribution probability of occurrence P = (p1, p2, ..., pN). To numerically estimate how
much information is gained on average or the degree of uncertainty with a given function H(P ), the following basic properties must be guaranteed:
• The function must exist, i.e., it must be possible to associate a link between the numerical uncertainty of a probability distribution and the real numbers.
CHAPTER 4. INFORMATION THEORETIC METHOD 35 • H(p1, ..., pN) is continuous in p1, ..., pN. This means that to small
vari-ations of P correspond small varivari-ations of H.
• If all the piare equal, pi = N1, then H should be a monotonic increasing
function of N . In other words, as the number of events increases, if they are equally probable, the associated uncertainty also increases. • H must guarantee the additive property: if a event is splitted into two
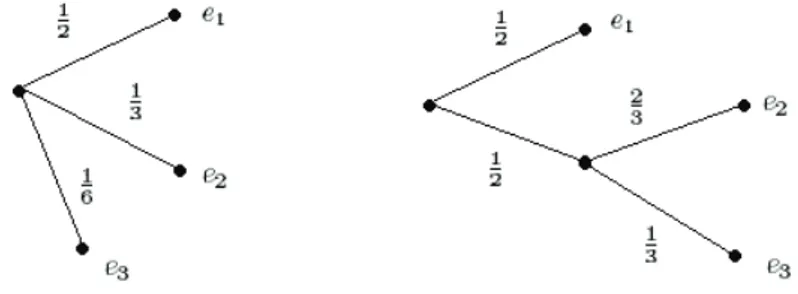
successive events, the original H should be the weighted sum of the individual values of H. A clarifying example of this property is shown in the figure 4.1.
Figure 4.1: Grouping property of the entropy. We can think of P = (1
2, 1 3,
1
6) as being generated in two successive
choices p′ = (1 2, 1 2) and p ′′ = (2 3, 1
3). Thus, the entropy of P must be
equal to entropy of the first step in the decomposition process, plus the weighted sum of the entropies of the second step:
H(1 2, 1 3, 1 6) = H( 1 2, 1 2) + 1 2H( 2 3, 1 3) (4.1) The coefficient 12 in the entropy of the second step means that the second choice only occurs half the time.
The only H satisfying the four above assumptions is of the form
H = −K
N
X
i=1
CHAPTER 4. INFORMATION THEORETIC METHOD 36
Figure 4.2: Entropy of a binary source.
where K is a positive constant. We interpret 0 log 0 as equal to 0, which follows logically from limx→0x log x = 0. When K = 1 and the logarithm is
log2, information is measured in bits. If the probability distribution has only
two entries with probability p and 1 − p respectively, entropy will be equal to
Hbin = −p log p − (1 − p) log (1 − p) (4.3)
The graph of the function Hbin is shown in Figure 4.2. It is a concave function
with null values for p = 0 and p = 1; this occurs when the variable is not random and there is not uncertainty. Similarly, with the value p = 12 uncertainty is maximum.
Some other relevant properties of the entropy are:
• H is symmetrical with respect to the probability vector P from which it depends, in the sense that if it is performed a permutation of the elements on the vector P , entropy does not change.
• H(P ) = 0 if and only if all the probabilities except one are zero. • H(P ) = log n when all the probabilities are equal. This is the case in
which the informative content is maximum.
It is worth mentioning that, in Information Theory, the concept of entropy is closely linked to that of compression. If the content of a message (for
CHAPTER 4. INFORMATION THEORETIC METHOD 37 example a simple string) is uncorrelated with each other, there is no way to compress the message without losing information and this is the case where entropy is maximum. Conversely, if some parts of a message are logically related to other, the resulting entropy will be smaller and consequently the message can be compressed without loss of information. The entropy of a set of data is hence directly related to the amount of information that it contains and provides a theoretical bound on the amount of compression that can be achieved [43].
4.2
Kolmogorov complexity
One of the most difficult and representative problem in Computer Science is represented by the problem of Complexity, i.e., the measure of the computa-tional resources required to perform a computation. There are two different categories of complexity:
• Static complexity, related with the structure of the program and its size.
• Dynamic or computational complexity, typically divided in time com-plexity and space comcom-plexity.
In the context of static complexity, the Kolmogorov complexity, indepen-dently introduced by R.J. Solomonoff in 1964 [44], by A.N. Kolmogorov in 1965 [45] and by G.J. Chaitin in 1966 [46] is very relevant to the development of an Information Theory based on the length of the codes.
Kolmogorov complexity (or algorithmic entropy) of a string x, defined as K(x), is the length l(p) of the shortest program p that runs on a universal computing device (a Universal Turing Machine ϕ) and produces the string x as output. Intuitively, it represents the minimum amount of information required to generate the string x from some effective process. For example, the string consisting of n equals symbols is extremely simple, since the short-est program that generates it has only to print n times the same symbol.
CHAPTER 4. INFORMATION THEORETIC METHOD 38 Mathematically, the Kolmogorov Complexity is defined as follows [47]:
K(x) = min
{p|ϕ(p)=x}l(p) (4.4)
Intuitively, the above equation describes a competitive selection of the short-est program, denoted p∗, from an unbounded set of competing programs
{p0, p1, ...}, each one capable of producing the desired output x. The
un-limited nature of this competition ensures that the winning model can be more efficient to find all the structural regularities in the specific string. Un-fortunately, this also implies the lack of a guarantee that this competition always produces a result. Despite the great interest shown in the scientific community, actual results about the Kolmogorov complexity have not been achieved. The difficulty is related to the impossibility to evaluate the function K for a given string x, because it is not Turing computable. The uncom-putability of Kolmogorov complexity has motivated several authors to seek useful approximations. A very good reference is the classic “Vitany trilogy” [48, 49, 50] in which practical approaches for approximating the Kolmogorov complexity and the related notion of Algorithmic Information Distance using compression algorithms are presented.
4.3
Algorithmic Information Distance
While the Kolmogorov complexity is a measure of the information contained in a individual object, a similar concept for the information distance between two individual objects is required. In this section we consider the problem of the definition of a distance D between two generic string x and y. This distance measure must satisfy the following requirements:
• Positivity: D(x, y) ≥ 0 (D(x, y) = 0 ↔ x = y) • Simmetry: D(x, y) = D(y, x)
CHAPTER 4. INFORMATION THEORETIC METHOD 39 Intuitively, it is possible to calculate the similarity between two strings x and y as the length of the shortest program that computes x from y and viceversa. Bennett et al. [48] defines this measure, denoted E(x, y) as:
E(x, y) = max{K(x|y), K(y|x)} (4.5) where K(x|y) is the conditional Kolmogorov complexity of a string x related to string y defined as the length of the shortest program to compute x if string y is provided to the universal computer as an auxiliary input. Sometimes the distance analysis requires a normalized metric. This requirement can be satisfied by the universal similarity metric defined by Li et al. [50], known as N ID (Normalized Information Distance) and mathematically represented by the following formula:
N ID(x, y) = max{K(x|y), K(y|x)}
max{K(x), K(y)} (4.6) N ID is an universal distance measure for objects of all kinds. It is also based on Kolmogorov complexity and thus uncomputable, but in the Vitany trilogy [48, 49, 50], the authors propose a way to approximate it. Compression algorithms can be used to approximate the Kolmogorov complexity if the objects have a string representation. Let C(x) the size of the compressed version of the string x and C(x, y) the size of the compressed version of the concatenation of x and y. We can rewrite the N ID to obtain the Normalized Compression Distance (NCD) :
N CD(x, y) = C(x, y) − min(C(x), C(y))
max(C(x), C(y)) (4.7) Standard Compression algorithms like zip, gzip, bzip2, are able to recognize the regularities in the data and the N CD measure exploits these abilities. Intuitively, strings with similar schemes take up less space when they are compressed together rather than separately compressed. There are not pa-rameters needed to compute the N CD, except for the choice of the com-pression algorithm and its settings. Research conducted from Vitany et al.