Original Paper
IntervirologyNS3 Variability in Hepatitis C Virus Genotype
1A Isolates from Liver Tissue and Serum Samples
of Treatment-Naïve Patients with Chronic
Hepatitis C
Deborah D’Aliberti
a, bIrene Cacciola
a, bCristina Musolino
a, bGiuseppina Raffa
a, bRoberto Filomia
a, bAngela Alibrandi
cSalvatore Benfatto
dConcetta Beninati
dCarlo Saitta
a, bDomenico Giosa
eOrazio Romeo
e, fGiovanni Raimondo
a, bTeresa Pollicino
b, daDepartment of Clinical and Experimental Medicine, University Hospital of Messina, Messina, Italy; bDivision of
Clinical and Molecular Hepatology, University Hospital of Messina, Messina, Italy; cDepartment of Economics,
University of Messina, Messina, Italy; dDepartment of Human Pathology, University Hospital of Messina, Messina,
Italy; eDepartment of Chemical, Biological, Pharmaceutical and Environmental Sciences (ChiBioFarAm), University of
Messina, Messina, Italy; fIRCCS Centro Neurolesi Bonino-Pulejo, Messina, Italy
Received: August 31, 2017 Accepted: April 16, 2018 Published online: July 18, 2018 DOI: 10.1159/000489307
Keywords
Hepatitis C virus · Chronic hepatitis C · Genotype-1a
Abstract
Background: Hepatitis C virus (HCV) NS3
resistance-associat-ed substitutions (RASs) rresistance-associat-educe HCV susceptibility to protease inhibitors. Little is known about NS3 RASs in viral isolates from the liver of chronic hepatitis C (CHC) patients infected with HCV genotype-1a (G1a). Aim: The objective of this work was to study NS3 variability in isolates from the serum and liver of HCV-G1a-infected patients naïve to direct-acting antivirals (DAAs). Methods: NS3 variability of HCV-G1a isolates from the serum and liver of 11 naïve CHC patients, and from sera of an additional 20 naïve CHC patients, was investigated by next-generation sequencing. Results: At a cutoff of 1%, NS3 RASs were detected in all the samples examined. At a cutoff of 15%, they were found in 54.5% (6/11) and 27.3% (3/11) of the
paired liver and serum samples, respectively, and in 22.5% (7/31) of the overall serum samples examined. Twenty-six out of thirty-one (84%) patients showed NS3 variants with multi-ple RASs. Phylogenetic analysis showed that NS3 sequences clustered within 2 clades, with 10/31 (32.2%) patients infect-ed by clade I, 15/31 (48.8%) by clade II, and 6/31 (19.3%) by both clades. Conclusions: Though the number of patients ex-amined was limited, NS3 variants with RASs appear to be ma-jor components of both intrahepatic and circulating viral qua-sispecies populations in DAA-naïve patients.
© 2018 S. Karger AG, Basel
Introduction
Hepatitis C virus (HCV) infection is a serious health problem worldwide. Currently, approximately 71 million people, representing 1% of the world’s population, are
chronically infected with HCV, and more than 399,000 people die from HCV-related liver diseases each year [1]. Recently, several highly potent direct-acting antivirals (DAAs) have been developed for the treatment of chron-ic hepatitis C (CHC), and 4 classes of DAAs targeting spe-cific key components of viral replication, such as HCV NS3/4A, HCV NS5A, and HCV NS5B proteins, have so far been licensed for CHC treatment [2, 3]. However, treatment of HCV infection with DAA is associated with very high rates of sustained virologic response, and viral variants with resistance-associated substitutions (RASs) conferring reduced susceptibility to DAAs may emerge during antiviral therapy, this event being one of the main factors responsible for the few but existing cases of viro-logic treatment failure [4–6]. These naturally occurring resistant variants can emerge and become the dominant viral infecting population under the selective pressure of an antiviral drug and when complete suppression of viral replication is not achieved [7]. Thus, investigation of HCV variability in the genomic regions targeted by DAAs is of key importance if the goal of extensive treatment is to reach 100% of therapeutic success with the possible elimination of the virus at least from some geographic areas. HCV genomic heterogeneity has been evaluated in numerous studies and some important information is available [4–6]. In fact, emergence and takeover of vari-ants carrying NS3 polymorphisms associated with prote-ase inhibitors (PIs) resistance appears to be a quite fre-quent occurrence, particularly in patients infected with HCV genotype 1, subtype a (G1a), thus partially limiting the use of some PIs (i.e., simeprevir) in these cases [4–6].
The frequency of naturally occurring G1 NS3-resistant variants has been reported to range between 0.1 and 3.1%, with the exception of the Q80K variant that has a good replicative fitness and is present from 19 to 48% of isolates belonging to clade I of HCV G1a, which is reported to be typically diffused in North America [5, 6, 8–10].
NS3 polymorphisms of HCV G1a potentially confer-ring resistance to PIs have been investigated in HCV iso-lates from the serum of patients, whereas – apart from anecdotic cases [11–13] – no extensive evaluation of iso-lates from the liver that is the site of virus replication and where HCV quasispecies diversity reaches the highest level of complexity [11, 12, 14–16] has been performed so far. In addition, almost all the studies have evaluated the presence of RASs by performing population sequencing, which is known to have a quite low sensitivity (15–20% frequency within the HCV quasispecies) to detect viral variants [4, 17]. In this study, we used next-generation sequencing (NGS) to investigate the prevalence of HCV NS3 amino acid (aa) substitutions in viral isolates from serum and liver samples of patients from Southern Italy infected with HCV G1a and naïve to any DAA treatment.
Patients and Methods
Patients
Serum samples from 31 naïve patients (21 males and 10 females with a median age of 54 years, range 43–60 years; Table 1) with HCV-G1a chronic infection consecutively attending the Liver Unit of the Messina University Hospital were collected from
Janu-ary 2010 to December 2015 and stored at −80 ° C. Tissue samples
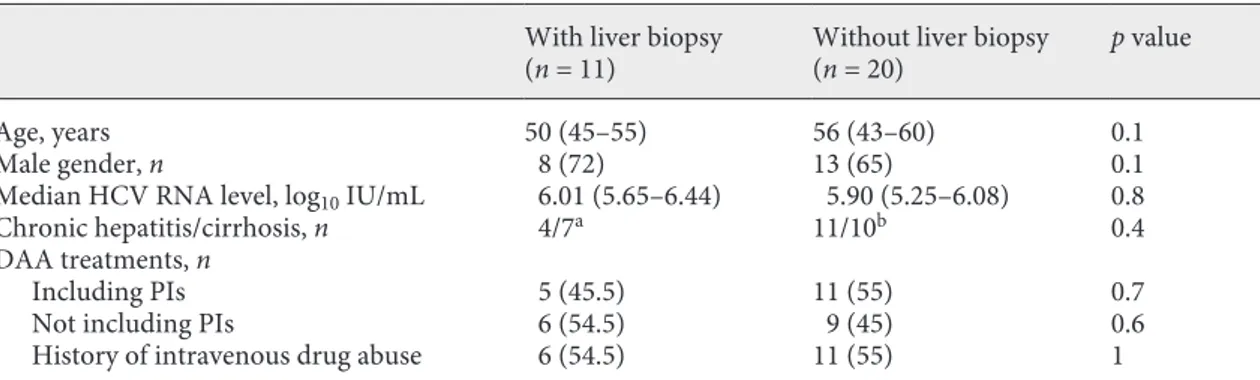
Table 1. Demographic and clinical characteristics of the studied patients
With liver biopsy
(n = 11) Without liver biopsy(n = 20) p value
Age, years 50 (45–55) 56 (43–60) 0.1
Male gender, n 8 (72) 13 (65) 0.1
Median HCV RNA level, log10 IU/mL 6.01 (5.65–6.44) 5.90 (5.25–6.08) 0.8
Chronic hepatitis/cirrhosis, n 4/7a 11/10b 0.4
DAA treatments, n
Including PIs 5 (45.5) 11 (55) 0.7
Not including PIs 6 (54.5) 9 (45) 0.6
History of intravenous drug abuse 6 (54.5) 11 (55) 1
Values in parentheses are either the IQR or %. HCV, hepatitis C virus; DAA, direct antiviral agents; PIs, protease inhibitors.
a Diagnosis histologically confirmed.
obtained by percutaneous needle biopsy at the time of blood
sam-pling, immediately frozen in liquid nitrogen and stored at –80 ° C,
were also available from 11 of the 31 patients included in the study. Written informed consent was obtained from each patient. The study protocol conformed to the principles of the Declaration of Helsinki and was reviewed and approved by the local Ethics Com-mittee.
Serum HCV RNA levels were quantified in each sample using the commercial assays COBAS Ampliprep/COBAS TaqMan HCV Quantitative Test v2.0 (Roche Diagnostics, Mannheim, Germany) with a lower limit of detection of 15 IU/mL. HCV genotype/sub-types were determined at screening by Versant LIPA v2 assay (Sie-mens Healthcare Diagnostics, Milan, Italy) and also confirmed by sequencing analysis of the NS5A, NS5B, and NS3/4A viral regions followed by alignment search tool (Geno2pheno) analysis [18].
NS3 Amplification, Library Preparation, and NGS
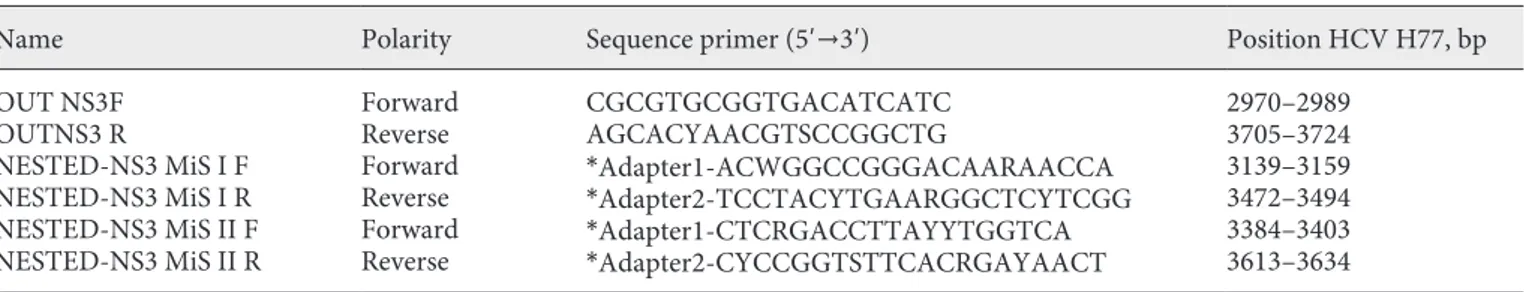
HCV RNA was extracted from serum and liver tissue samples using the PureLink Viral RNA/DNA Mini Kit (Invitrogen-Life Technologies, Paisley, UK) and RNeasy Micro Kit (Qiagen, Hilden, Germany), respectively. Complementary DNA was synthesized from RNA extracts using the Transcriptor First Strand cDNA Syn-thesis Kit (Roche Diagnostics) and random hexamers, according to the manufacturer’s instructions. The entire NS3-coding region was amplified by nested polymerase chain reaction (PCR) using the Expand High Fidelity PCR System (Roche Diagnostics) and HCV gene-specific primers. Primers used in the second round of nested PCR contained a barcode sequence unique to each sample and the Illumina MiSeq flow cell adaptors. The primers used for amplification and sequencing are reported in Table 2. PCR exper-iments were performed using a 50-µL reaction volume containing
5 μL of 10X Taq Buffer, 4 μL of 25 mM Mg2+, 300 nM of each
prim-er, 200 μM of each of the 4 dNTPs, and 2.6 units of the Expand High
Fidelity DNA Polymerase. The conditions for the first round of
nested PCR included: an initial denaturing step at 94 ° C for 4 min,
followed by 35 cycles of a denaturing step at 94 ° C for 30 s, an
an-nealing step at 60 ° C for 50 s, an extension step at 72 ° C for 1 min,
then followed by a final extension at 72 ° C for 10 min. Products of
the first round PCR then underwent a second round of processing consisting of the steps of first PCR but with an annealing
tempera-ture decrease to 56 ° C. The final PCR product was detected by
aga-rose gel (1.5%) electrophoresis. PCR products were purified using the QIAquick PCR Purification Kit (Qiagen), and then quantified
using the Quant-It dsDNA High Sensitivity Kit and the Qubit 2.0 fluorometer (Life Technologies, Paisley, UK). The purified PCR products were converted to Illumina sequencing libraries using the Nextera XT Sample Preparation KIT (Illumina, Litte Chesterford, UK) and the Nextera XT Index Kit (Illumina). Libraries were pooled and spiked with 5% Phix Control Kit v3 (Illumina), accord-ing to the manufacturer’s instructions. Sequencaccord-ing was performed on the Illumina MiSeq using 2 × 250 cycles v2 chemistry (Illumina Inc., San Diego, CA, USA). Illumina sequencing raw reads (4,903,637 in total) were processed using Trimmomatic (v 0.36) [19] to remove adapters and sequences with low Phred-scores
(cutoff ≥30, minimum read length 35 bp). After quality filtering
and trimming, approximately 4% of the total reads were removed, leaving a large data set (4,714,691 in total) of high-quality reads for subsequent genotyping analysis. For consensus sequence recon-struction, reads from each patient were aligned against a large da-taset of reference clade I/clade II sequences (online suppl. Table 1; see www.karger.com/doi/10.1159/000489307 for all online suppl. material) using BWA (with the option -x intractg) [20] and further analyzed by the BLAST+ program [21].
A threshold value ≥70% (percentage of the total reads allocated to a single reference sequence) was used to delineate a distinct con-sensus sequence belonging exclusively to the clade I or clade II genotype (online suppl. Table 1). Samples with mapping values below this threshold (3B, 3S, 7B, 9B, 12S, 27S and 31S) were con-sidered as mixed samples and 2 different consensus sequences were retrieved (clade I and clade II). Consensus sequences were called by combining SUPER-CAP [22] and SAMtools programs [23], and used in MEGA 7 software [24] to create a maximum like-lihood phylogenetic tree (Fig. 1) based on the general time revers-ible substitution model (GTR+G+I option) which was selected by best model search using the “Find best DNA Model” function im-plemented in MEGA7 [24]. RASs were analyzed using 1, 5, 10, 15, and 20% cutoffs.
Statistics
Continuous numerical variables are expressed as the median and interquartile range and categorical variables as the number and percentage. For each RAS, absolute frequencies and percent-ages were calculated for both serum and tissue samples.
Examined continuous variables did not present a normal distri-bution as verified by the Kolmogorov-Smirnov test and the non-parametric approach was consequently used. To evaluate the
asso-Table 2. HCV-specific oligonucleotide sequences used for amplification and sequencing of NS3 protease
Name Polarity Sequence primer (5′→3′) Position HCV H77, bp
OUT NS3F
OUTNS3 R ForwardReverse CGCGTGCGGTGACATCATCAGCACYAACGTSCCGGCTG 2970–29893705–3724
NESTED-NS3 MiS I F NESTED-NS3 MiS I R NESTED-NS3 MiS II F NESTED-NS3 MiS II R Forward Reverse Forward Reverse *Adapter1-ACWGGCCGGGACAARAACCA *Adapter2-TCCTACYTGAARGGCTCYTCGG *Adapter1-CTCRGACCTTAYYTGGTCA *Adapter2-CYCCGGTSTTCACRGAYAACT 3139–3159 3472–3494 3384–3403 3613–3634
Y = C or T, S = G or C, W = A or T, R = A or G according to IUPAC nucleotide code. bp, base pair. * Adapter (1 or 2) primer se-quences not shown (Illumina technology).
ciation between mutations, we applied contingency tables (χ2 test or
Fisher exact test if frequencies less than 5 were expected). The Mann-Whitney U test was used to compare HCV-RNA values in HCV-positive patients with or without liver biopsy. The Student t test was used to compare normally distributed continuous variables.
Statistical analysis was performed using SPSS 17.0 for Windows (SPSS Inc., Chicago, IL, USA). p values were calculated with
2-tailed statistical analysis and p values <0.05 were considered to
be statistically significant.
Results
Demographic and clinical characteristics were compa-rable between the 11 patients from whom both serum and liver samples were available and the 20 patients from whom only serum samples were available (Table 1). All the 31 studied patients were subsequently treated with interferon-free DAA-based regimens (13 including and
Color version available online
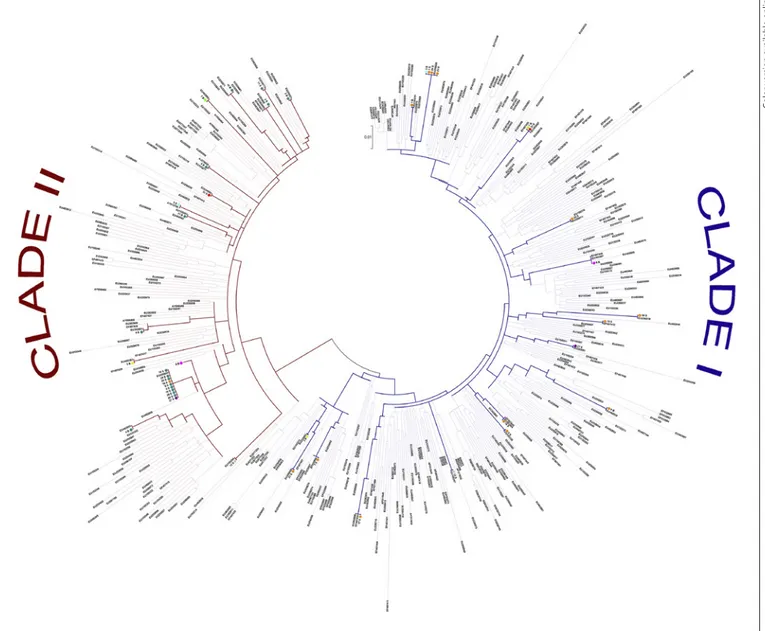
Fig. 1. Phylogenetic tree showing evolutionary relationships
be-tween our HCV subtype 1a sequences and reference isolates in-cluded in this study. The evolutionary history was inferred using the maximum likelihood method based on the GTR+G+I as the best-fit model of evolution. Our viral isolates are highlighted with colored circles: red (31S); yellow (3B); pink (9B); blue (12S); light
blue (3S); green (7B); violet (27S); teal (2B, 2S, 4B, 4S, 5B, 5S, 8B, 8S, 9S, 10B, 10S, 11B, 11S, 14S, 15S, 16S, 19S, 20S, 25S, 26S, 28S, and 29S); orange (1B, 1S, 6B, 6S, 7S, 13S, 17S, 18S, 21S, 22S, 23S, 24S, and 30S). GenBank accession numbers for reference clade I and clade II isolates are also shown.
Table 3.
Number, type, and frequency of RASs detected in serum and liver tissue samples from the studied patients
Viral isolates (No. of RASs)
V36A/M, % F43L, % T54A/S, % V55A, % Y56H, % Q80K/R, % S122R, % R155K/T, % A156T/V, % D168A/V, % serum liver serum liver serum liver serum liver serum liver serum liver serum liver serum liver serum liver serum liver serum liver 13S (5) na 4 – 4 – – 1 6 96 – – 6S(4) 6B (5) – – – – – – – – 50 98 98 98 1 3 – 4 – – 4 6 12S (4) na 10 – – – – 1 9 – – 1 14S (4) na 1 – – – – 2 6 – – 1 30S (4) na 1 2 – – – – 1 – – 14 18S (4) na 1 – – – – 1 20 – – 4 16S (3) na 3 – – – – – 5 – – 10 17S (3) na 1 – – – – – 8 – 1 – 19S (3) na 1 – – – – – 7 3 – – 22S (3) na 1 – – – – – 14 – – 1 23S (3) na 99 – – – – – 14 – – 2 24S (3) na 1 – – – – – 6 – 2 – 25S (3) na 2 – – – – – 3 – – 14 26S (3) na 1 – – – – – 13 – – 2 27S (3) na 1 – – – – – 6 – – 1 29S (3) na 1 – – – 60 – – – – 1 31S (3) na 1 – – – – – 1 – – 2 28S (2) na 1 – – – – – – – – 5 4S (2) 4B (3) – – – – – – – – – – – 2 5 6 – – – – 1 1 5S (2) 5B (3) – 4 – – – – – – – – 1 2 3 10 – – – – – – 10S (2) 10B (3) – – – – – – – – – – – 1 15 25 – – 10 50 11S (2) 11B (4) – – – – – – – – – – – 1 7 7 – 3 – – 4 4 7S (2) 7B (4) 1 – – – – – – – – 1 15S (2) na – – – – – – 6 – – 1 20S (2) na – – – – – – 6 – – 3 21S (2) na 20 – – – – – 11 – – – 1S (1) 1B (4) – 1 – – – 2 – – – – – – – 3 – – – – 1 2 2S (1) 2B (2) – – – – – – – – – – – – – 18 – – – – 1 5 3S (1) 3B (3) – – – – – – – – – – – – – 3 – – – 13 3 4 8S (1) 8B (4) – – – – – – – – – – 1 2 – 10 – 25 – – – 2 9S (1) 9B (5) – – – – – – – – – – – 5 1 3 – 3 – 5 – 8
No. of RASs, number of resistant-associated-substitutions detected in viral isolates from each patient; na, not available; “–”,
18 not including PIs) and all of them showed a sustained virologic response.
NS3 deep sequencing was successful for all the liver specimens and serum samples examined. The analysis of polymorphisms at residues associated with resistance to PIs (including substitutions at position V36, F43, T54, V55, Y56, Q80, S122, R155, A156, and D168 of the NS3 protease gene) [4–6] in the study population revealed that 4/31 in-dividuals (13%) had dominant resistance variants (at a fre-quency of 60–99%), conferring resistance to PIs (Table 3). At the clinically relevant cutoff of 15% [4], the percent-age of patients with baseline NS3 RASs was 54.5% (6/11 patients) and 27.3% (3/11 patients; p = 0.2) when the paired liver tissue and serum samples, respectively, were evalu-ated, and 22.5% (7/31) when the sera from all the studied patients were analyzed. However, at a 1% cutoff, all the pa-tients showed baseline NS3 RASs both in liver tissues and serum samples. In addition, at 1%, cutoff, the most fre-quent RASs present in liver tissue specimens and paired serum samples from the 11 patients were S122R>D168A/ V>Q80K/R>R155K/T>V36A>A156T>Y56H = T54A and D168A/V>S122R>Q80K/R>Y56H = V36A, respectively; at 15% cutoff they were S122R>V36A = Y56H = Q80K = R155K = D168V and Y56H = Q80K = S122R, respectively. When serum samples from all the 31 patients were evalu-ated, the RASs most frequently found at 1% cutoff were S122R>D168A/V>V36A>Q80K/R>Y56H = R155K/T = A156V>F43L = T54A, and at 15% cutoff were V36A = Y56H = S122R>Q80K = R155K.
At 1% cutoff, S122R and D168V/A were the most fre-quently detected polymorphisms both in the paired liver tissues (found in 11/11 patients, 100%, and 10/11, 90.9%, respectively) and serum samples (found in 6/11 patients, 54.5%, and 8/11, 72.7%, respectively), as well as in serum samples from all the 31 studied patients (found in 24/31 patients, 77.4%, and 23/31, 74.2%, respectively). Q80K/R was the third most frequent polymorphism found using the 1% cutoff (8/11, 72.7%, and 3/11, 27.3%, of the cases when the paired liver and serum samples were analyzed, respectively, p = 0.03). Overall, this polymorphism was detected in 7 of the 31 serum samples examined (22.6%). In all but 1 case, the Q80K/R substitution was detected in combination with other RASs. In particular, when a cutoff of 1% was used it was significantly associated with the R155K/T substitution (p = 0.01), whereas at a cutoff of 15% it was significantly associated with the Y56H substi-tution (p = 0.01). R155K/T was found in 36.4 and 6.4% of the cases when liver tissue specimens and serum samples were analyzed, respectively. The R155K/T substitution in combination with Q80K/R could be detected at a
frequen-cy ranging from 3 to 96% in the intrapatient HCV popula-tions. Y56H was found in 9.1 and 6.5% of the cases when liver specimens and serum samples were analyzed, respec-tively. The Y56H substitution in combination with Q80K/R could be detected at a frequency ranging from 50 to 98%. Of note, the Q80K substitution was detected at a very high frequency (98%) both in the liver and in the se-rum from only 1 patient. It is noteworthy that this patient showed a combination of different RASs. Indeed, besides the Q80K substitution, the Y56H (present at a frequency of 98% in the liver and 50% in the serum), the S122R (pres-ent at a frequency of 3% in the liver and 1% in the serum), and the D168V (present at a frequency of 6% in the liver and 4% in the serum) substitutions could also be detected. Importantly, the A156T substitution, known to confer high levels of resistance [4], was detected in the liver tis-sue specimens from 2 cases. In 1 case, the A156T RAS (present at a frequency of 13%) was detected in combina-tion with the S122R (present at a frequency of 3%) and the D168A (present at a frequency of 4%) RASs; in the other case, A156T (present at a frequency of 5%) was de-tected in combination with Q80K (present at a frequency of 5%), S122R (present at a frequency of 3%), R155T (present at a frequency of 3%), and D168V (present at a frequency of 8%).
Overall, resistant variants with multiple RASs were de-tected at significantly higher frequencies in the liver than in serum, both when the analysis was limited to the 11 paired liver/serum samples and when the data from the 11 liver specimens were compared to all 31 serum sam-ples investigated (p < 0.01 and p = 0.01, respectively). Among serum samples from the 31 patients, 1 showed resistant variants with 5 different RASs, 5 resistant vari-ants with 4 different RASs, 11 resistant varivari-ants with 3 RASs, 9 resistant variants with 2 different RASs, and 5 resistant variants with 1 RAS (Table 3). Among the 11 liver tissue specimens analyzed, 2 showed resistant vari-ants with 5 different RASs, 4 resistant varivari-ants with 4 RASs, 4 resistant variants with 3 RASs, and 1 resistant variant with 2 RASs (Table 3). Overall, the detection of resistant variants with a single RAS was higher in serum samples than in liver tissues (0 vs. 16%, p = 0.1).
Phylogenetic analysis of NS3 sequences confirmed that all the isolates belonged to G1a, and showed that se-quences clustered within 2 distinct clades, clade I and clade II [9]. In particular, 10/31 (32.2%) patients were in-fected by clade I, 15/31 (48.4%) patients were inin-fected by clade II, and 6/31 (19.3%) patients showed a mixed infec-tion with both clade I and clade II NS3 sequences (Fig. 1). Of note, 4/6 individuals with mixed infections had a
his-tory of intravenous drug abuse. As expected, the Q80K substitution was exclusively associated with clade I.
Discussion
In this study, we investigated the prevalence of baseline NS3 RASs by NGS in liver tissues and serum samples from a small number of DAAs-naïve patients from Southern It-aly infected with HCV G1a. When a cutoff of 1% was ap-plied, 100% of the analyzed patients showed at least one aa substitution related to PI resistance both in liver tissue and in serum samples. The percentage of patients with baseline NS3 RASs remained high, also when the 15% clinically rel-evant cutoff [4] was used, with 54.5 and 22.5% of patients harboring NS3 RASs in liver tissue specimens and serum samples, respectively. This prevalence appears to be sig-nificantly higher than that observed in previous studies [25–28]. This discrepancy might be due to differences in the assays (based on population or deep sequencing) uti-lized in the different studies, as well as to the choice to in-vestigate only specific RASs while excluding others, and the increasing number of RASs over time recognized to be involved in resistance to PIs [4]. Furthermore, it has to be taken into account that the present study included the analysis of viral isolates from the liver that is the site where virus replication takes place and HCV quasispecies show the highest complexity at both nucleotide and aa levels [11, 12, 14–16]. It is known that the composition of viral popu-lation in the serum does not necessarily reflect those of the viral population in the liver. The reasons for this difference remain undefined. It has been hypothesized that the high-est complexity in the liver quasispecies may be due to the presence of viruses with different degrees of fitness that are not immediately incorporated into mature virions re-leased into the circulation. Alternatively, differences in the clearance rates or steady-state levels of some variants might be responsible for the observed discrepancy.
It is interesting to note that in the studied patients, S122R, D168V/A, and Q80K/R – all known to be involved in decreasing susceptibility also to second-generation PIs [29] – were the RASs at higher prevalence both in liver tissues and in serum samples. Though not surprising for Q80K [5, 8, 30], this high prevalence was unexpected for S122R and D168V/A. Indeed, the natural occurrence of single RASs in HCV-G1-infected patients has been re-ported to be lower than 3% for the majority of resistant variants to PIs [5]. This low occurrence had been linked to the impaired fitness of PI-resistant variants, as the NS3 RASs involve aa residues that are crucial for NS3
func-tionality. An exception to this is the Q80K variant, which shows no loss of replicative fitness and has been reported as the most frequently detected NS3 substitution, albeit with important geographical differences. Indeed, Q80K is present in about half of HCV-G1a-infected patients in North America, whereas its prevalence is around 19 and 9% in Europe and South America, respectively [5, 8, 30]. In our study population, Q80K/R was detected in 73 and 23% of cases when liver tissues and serum samples were analyzed, respectively, and it was the third most frequent substitution, even if at low frequency (<5%) in most cases. Indeed, a single patient showed NS3 sequences harboring Q80K at a frequency higher than 15%, and all NS3 se-quences from this patient belonged to clade I. Interest-ingly, the 2 patients showing the Q80K RAS at a frequen-cy higher than 5% had a mixed infection with both clade I and clade II sequences. In this context, our results from phylogenetic analysis demonstrates that both clade I and II cocirculate with an approximately similar prevalence in our geographic area – in accordance with data from oth-er Italian and European regions [31, 32] – and that a mixed infection with both clades is quite a frequent event.
Notably, we also found that Q80K significantly associ-ates with R155K, and that this substitution in combination with Q80K could be detected at a very high frequency (up to 96%) in the intrapatient HCV population, suggesting that NS3 variants showing both these RASs have good rep-lication fitness. This is in contrast with previous data in-dicating that R155K in the presence of Q80K substitution negatively affects viral fitness [27]. Although in this study we did not perform quasispecies reconstruction and the different observed RASs might not be included in the same viral genome, the detection of at least one addition-al RAS in addition-all the patients showing the Q80K/R155K com-bination tempts us to speculate that the possible addition-al RASs could act as compensatory substitutions rescuing viral fitness. It is noteworthy that in 2 patients we found the A156T substitution that, to our knowledge, has so far never been detected at baseline and is known to impor-tantly affect viral fitness, and to confer resistance to newer PIs [4]. Also in these 2 patients, the poorly fitting A156T substitution was detected in possible combination with multiple additional RASs. The hypothesis of the potential compensatory effect of some substitutions might also the-oretically explain the high prevalence of many of the RASs we found, although it should be underlined that in our study the combination of investigation of intrahepatic vi-ral populations with a very sensitive NGS approach may have significantly increased the sensitivity of RAS detec-tion compared to previous studies. Indeed, there is a
fair-ly general agreement in considering onfair-ly RASs represent-ing more than 15% of the circulatrepresent-ing viral populations as clinically relevant [4]. However, the arbitrary identifica-tion of this cutoff is quesidentifica-tionable, and the hypothesis can-not be ruled out that it is the extremely high efficacy of combined DAA treatments directed against different viral targets that determines the low or null clinical impact of the many variants that, as we have shown here, are present as minor populations in HCV G1a-infected patients.
Acknowledgments
This study was supported in part by a grant from Janssen-Cilag and a grant from Gilead Sciences
Disclosure Statement
The authors of this study declare no conflicts of interest.
References
1 World Health Organization: Global hepatitis report, 2017. Geneva, WHO, 2017.
2 Liang TJ, Ghany MG: Current and future therapies for hepatitis C virus infection. N Engl J Med 2013;368:1907–1917.
3 Pawlotsky JM: Hepatitis C treatment: the data flood goes on-an update from the liver meet-ing 2014. Gastroenterology 2015;148:468– 479.
4 Pawlotsky JM: Hepatitis C virus resistance to direct-acting antiviral drugs in interferon-free regimens. Gastroenterology 2016;151: 70–86.
5 Sarrazin C: The importance of resistance to direct antiviral drugs in HCV infection in clinical practice. J Hepatol 2016;64:486–504. 6 Lontok E, Harrington P, Howe A, Kieffer T,
Lennerstrand J, et al: Hepatitis C virus drug resistance-associated substitutions: state of the art summary. Hepatology 2015;62:1623– 1632.
7 Halfon P, Locarnini S: Hepatitis C virus resis-tance to protease inhibitors. J Hepatol 2011; 55:192–206.
8 Sarrazin C, Lathouwers E, Peeters M, Daems B, Buelens A, et al: Prevalence of the hepatitis C virus NS3 polymorphism Q80K in geno-type 1 patients in the European region. Anti-viral Res 2015;116:10–16.
9 Pickett BE, Striker R, Lefkowitz EJ: Evidence for separation of HCV subtype 1a into two distinct clades. J Viral Hepat 2011;18:608– 618.
10 Welzel TM, Bhardwaj N, Hedskog C, Choda-varapu K, Camus G, et al: Global epidemiol-ogy of HCV subtypes and resistance-associat-ed substitutions evaluatresistance-associat-ed by sequencing-based subtype analyses. J Hepatol 2017;67: 224–236.
11 Bartolini B, Selleri M, Garbuglia AR, Giom-bini E, Taibi C, et al: HCV NS3 quasispecies in liver and plasma and dynamics of telapre-vir-resistant variants in breakthrough pa-tients assessed by UDPS: a case study. J Clin Virol 2015;72:60–65.
12 Morsica G, Andolina A, Merli M, Messina E, Hasson H, et al: NS3 protease resistance-asso-ciated substitutions in liver tissue and plasma samples from patients infected by hepatitis C virus genotype 1A or 1B. Arch Virol 2017;162: 2271–2277.
13 Cubero M, Esteban JI, Otero T, Sauleda S, Bes M, Esteban R, Guardia J, Quer J: Naturally oc-curring NS3-protease-inhibitor resistant mu-tant A156T in the liver of an untreated chron-ic hepatitis C patient. Virology 2008;370:237– 245.
14 Cabot B, Martell M, Esteban JI, Sauleda S, Otero T, Esteban R, Guardia J, Gomez J: Nu-cleotide and amino acid complexity of hepa-titis C vitus quasispecies in serum and liver. J Virol 2000;74:805–811.
15 Maimone S, Musolino C, Squadrito G, Raffa G, Pollicino T, et al: NS3 genetic variability in HCV genotype-1b isolates from liver speci-mens and blood samples of treatment-naive patients with chronic hepatitis C. Antivir Ther 2013;18:131–134.
16 Maimone S, Tripodi G, Musolino C, Cacciola I, Pollicino T, et al: Lack of the NS5B S282T mutation in HCV isolates from liver tissue of treatment-naive patients with HCV geno-type-1b infection. Antivir Ther 2015;20:245– 247.
17 Fourati S, Pawlotsky JM: Virologic tools for HCV drug resistance testing. Viruses 2015;7: 6346–6359.
18 Kalaghatgi P, Sikorski AM, Knops E, Rupp D, Sierra S, et al: Geno2pheno[HCV] – a web-based interpretation system to support hepa-titis C treatment decisions in the era of direct-acting antiviral agents. PLoS One 2016; 11:e0155869.
19 Bolger AM, Lohse M, Usadel B: Trimmomat-ic: a flexible trimmer for Illumina sequence data. Bioinformatics 2014;30:2114–2120. 20 Li H, Durbin R: Fast and accurate short read
alignment with Burrows-Wheeler transform. Bioinformatics 2009;25:1754–1760. 21 Camacho C, Coulouris G, Avagyan V, Ma N,
Papadopoulos J, et al: BLAST+: architecture and applications. BMC Bioinformatics 2009; 10:421.
22 Ruggieri V, Anzar I, Paytuvi A, Calafiore R, Cigliano RA, et al: Exploiting the great poten-tial of sequence capture data by a new tool, SUPER-CAP. DNA Res 2017;24:81–91. 23 Li H, Handsaker B, Wysoker A, Fennell T,
Ruan J, et al: The Sequence Alignment/Map format and SAMtools. Bioinformatics 2009; 25:2078–2079.
24 Kumar S, Stecher G, Tamura K: MEGA7: Mo-lecular Evolutionary Genetics Analysis ver-sion 7.0 for bigger datasets. Mol Biol Evol 2016;33:1870–1874.
25 Kuntzen T, Timm J, Berical A, Lennon N, Berlin AM, et al: Naturally occurring domi-nant resistance mutations to hepatitis C virus protease and polymerase inhibitors in treat-ment-naive patients. Hepatology 2008;48: 1769–1778.
26 Sarrazin C, Dvory-Sobol H, Svarovskaia ES, Doehle BP, Pang PS, et al: Prevalence of resis-tance-associated substitutions in HCV NS5A, NS5B, or NS3 and outcomes of treatment with ledipasvir and sofosbuvir. Gastroenter-ology 2016;151:501–512 e501.
27 Lenz O, Verbinnen T, Fevery B, Tambuyzer L, Vijgen L, et al: Virology analyses of HCV iso-lates from genotype 1-infected patients treat-ed with simeprevir plus peginterferon/ribavi-rin in phase IIb/III studies. J Hepatol 2015;62: 1008–1014.
28 Larrat S, Vallet S, David-Tchouda S, Caporos-si A, Margier J, et al: Naturally occurring re-sistance-associated variants of hepatitis C vi-rus protease inhibitors in poor responders to pegylated interferon-ribavirin. J Clin Micro-biol 2015;53:2195–2202.
29 Zeuzem S, Ghalib R, Reddy KR, Pockros PJ, Ben Ari Z, et al: Grazoprevir-elbasvir combi-nation therapy for treatment-naive cirrhotic and noncirrhotic patients with chronic hepa-titis C virus genotype 1, 4, or 6 infection: a randomized trial. Ann Intern Med 2015;163: 1–13.
30 McCloskey RM, Liang RH, Joy JB, Krajden M, Montaner JS, et al: Global origin and trans-mission of hepatitis C virus nonstructural protein 3 Q80K polymorphism. J Infect Dis 2015;211:1288–1295.
31 De Luca A, Di Giambenedetto S, Lo Presti A, Sierra S, Prosperi M, et al: Two distinct hepa-titis C virus genotype 1a clades have different geographical distribution and association with natural resistance to NS3 protease inhib-itors. Open Forum Infect Dis 2015;2:ofv043. 32 Santos AF, Bello G, Vidal LL, Souza SL, Mir
D, et al: In-depth phylogenetic analysis of hepatitis C virus subtype 1a and occurrence of 80K and associated polymorphisms in the NS3 protease. Sci Rep 2016;6:31780.