Department of Agriculture, Forests, Nature and Energy
Tesi di Dottorato di ricerca in cotutela in Biotecnologie Vegetali XIV Ciclo
Assessment of the allergenic potential of genetically modified
wheats by comparison with their wild type genotypes and
commonly grown cultivars through allergenomic and
immunochemical approaches.
AGR07
PhD Student: Dott.ssa Roberta Lupi
Jury of PhD
President of Jury: Prof. Christine Herrenknecht , Universitè de Nantes Reviewer:
DR. Corrado Rizzi, Università degli Studi di Verona
DR. Michel Zivy, Chargé de recherche, INRA/Univ Paris-Sud/CNRS/AgroParisTech Examiner:
Prof.ssa Benedetta Mattei, Università La Sapienza di Roma
Dott. Norberto Pogna, Dirigente Unità di Ricerca per gli Alimenti e la Nutrizione - Roma
PhD Director 1: Prof.ssa Stefania Masci, Università degli Studi della Tuscia
PhD Director 2: DR Sandra Denery-Papini, Chargé de recherche HDR, INRA Nantes PhD Co-director: DR Colette Larré, Ingénieur de recherche, INRA Nantes
Résumé:
Le blé est l’une des céréales les plus cultivées dans le monde mais aussi la plus largement consommée. Les deux génotypes majoritairement cultivés sont le blé tendre (génome AABBDD) et le blé dur (génome AABB). Le blé tendre est couramment utilisé sous forme de farine en panification, en biscuiterie, tandis que le blé dur est surtout utilisé pour la préparation des pâtes. Cependant, le blé fait partie des six principaux aliments connus pour être allergène pour les sujets susceptibles. Selon les génotypes, les protéines du grain représentent entre 10 et 15 % de sa matière sèche. Elles sont classiquement séparées en fonction de leurs propriétés de solubilité en albumines (hydrosolubles), globulines (solubles en solution saline) et prolamines insolubles (glutenines et gliadines, constituant le gluten). Les fractions solubles dans l’eau et les sels (Albumines/Globulines, A/G) sont principalement constituées de protéines présentant des fonctions métaboliques ou structurales, alors que les protéines du gluten sont des protéines de réserve directement impliquées dans la qualité du blé. Ces deux fractions sont à l’origine d’allergies alimentaires et respiratoires alors que la fraction A/G est plutôt impliquée dans l’allergie respiratoire, l’asthme du boulanger, qui est l’une des allergies professionnelles les plus fréquentes en France. Ces allergies sont liées à une réponse immunitaire dirigée contre un allergène (une protéine) et impliquant les anticorps de type IgE. Les allergies sont en augmentation et sont désormais considérées comme un problème important de santé publique.
Les plantes génétiquement modifiées (GM) sont de plus en plus étudiées et certaines d’entre elles sont largement cultivées par exemple en Amérique du Nord et Sud mais pas en Europe. Elles entrent dès lors dans l’alimentation et peuvent représenter un risque pour la santé. En effet ces plantes génétiquement modifiées ne sont pas naturelles puisqu’on y a introduit un gène absent à l’état sauvage ou modifié l’expression d’un gène. Même si les cibles visées sont un gène unique, de nombreux travaux ont mis en évidence un impact plus ou moins important de ces transformations sur l’expression des autres gènes. Cet aspect retient beaucoup l’attention, aussi bien de la communauté scientifique que celle des consommateurs, et participe à leurs inquiétudes et leurs réticences vis à vis des plantes GM, essentiellement pour l’augmentation potentielle de la toxicité et/ou de l’allergénicité.
Pour les pays où la commercialisation de produits dérivés de plantes GM est acceptée, le principe qui s’applique est le principe d’équivalence substantielle.
Classiquement l'évaluation de la sécurité des plantes GM inclut une comparaison directe avec le génotype non-transformé correspondant la variabilité naturelle existante doit être également prise en compte.
Ce projet de doctorat s’insère dans ce contexte, avec comme 'objectif principal d'établir si la transformation du blé augmente le risque d'allergie, étant donné que le blé est déjà un aliment allergénique. L’approche utilisée dans cette étude permettra d’augmenter les connaissances sur les protéines impliquées dans les allergies au blé, particulièrement celles présentes dans la fraction soluble, qui ont été moins étudiées que les protéines insolubles du gluten.
Dans une première partie de la thèse, l'allergénicité des lignées de blé GM a été évaluée par une approche d'allergénomique et comparée à celle des génotypes parentaux. Dans une deuxième partie de la thèse, une étude plus large a été conduite pour comparer des lignées GM et leurs parents avec un groupe de variétés commerciales cultivées. Il s’agit d’observer si les variations d’allergénicité entre les blés GM et leurs parents sont du même ordre que celles existant entre des variétés obtenues par des méthodes de sélection conventionnelle.
Deux lignées de blé transgéniques (une lignée de blé dur cv Svevo, et une de blé tendre cv Bobwhite) ont été comparées aux génotypes correspondant non transformées, d'abord par ELISA (Enzyme Linked Immunoabsorbent Assay) avec vingt-un sérums de patients souffrant d’allergie alimentaire au blé ou d'asthme du boulanger, puis par une approche d'allergénomique.
Nous avons étudié une lignée de blé tendre sur-exprimant une sous-unité de gluténines de faible poids moléculaire (LMW-GS) et une lignée de blé dur sur-exprimant le gène Wx-B1 impliqué dans la synthèse de l’amylose. La comparaison de la teneur et de la composition en allergènes s’est focalisée sur les fractions albumines/globulines (A/G), car les transformations génétiques ont nettement modifié leurs quantités dans les blés GM : ont été changées suite aux transformations génétiques. En particulier, la fraction A/G de la lignée de blé tendre GM a diminué alors que celle de la lignée de blé dur transgénique montre une augmentation.
Les résultats obtenus par ELISA ne montrent que peu de différences significatives entre les lignées GM et leurs parents respectifs; en effet, nous avons mesuré des concentrations en IgE spécifiques des A/G qui diffèrent entre les blés GM et leurs parents seulement pour deux patients souffrant d’asthme du boulanger et pour six patients souffrant d’allergie alimentaire parmi les 21 sérums testés. Malgré ces différences, les concentrations d’IgE spécifiques des A/G mesurées pour la lignée de blé tendre GM et son génotype cultivé sont comparables pour 84% des sérums, et pour 70% des sérums en ce qui concerne la ligné de blé dur GM et la variété cultivée correspondante.
Des immunoblots bidimensionnels sur les fractions A/G des deux lignées GM et de leurs génotypes cultivés ont été réalisés avec trois sérums de patients allergiques alimentaires et un sérum d'un patient atteint d'asthme du boulanger. De nombreux polypeptides réagissant avec les IgE ont été détectés pour chaque génotype. Seulement quelques changements dans les profils de ces polypeptides réactifs ont été repérés entre les lignées transgéniques et leurs génotypes non transgéniques. Cent neuf spots ont été identifiés par spectrométrie de masse, la plupart d'entre eux ont été déjà décrits dans la littérature comme des allergènes ou allergènes potentiels, et peu d'entre eux sont spécifiques du génotype transgénique.
Pour la seconde partie de la thèse, nous avons réuni une collection de lignées de blé GM (2 génotypes de blé tendre et trois de blé dur) et les variétés commerciales et null- ségrégant correspondantes disponibles, ainsi que des blés tendres et des blés durs obtenus par des méthodes de sélection conventionnelle. Pour chaque blé, nous avons préparé différents extraits solubles : fractions A/G, Métaboliques et CM-like. Les concentrations en IgE spécifiques de chaque extrait ont été mesurées par ELISA dans les sérums de 24 patients allergiques alimentaires ou respiratoires au blé.
De plus, les fractions A/G, Métaboliques et CM-like ont été comparés par immunoblots monodimensionnels en utilisant des sérums de patients allergiques au blé et des anticorps spécifiques anti-LTP. Les polypeptides reconnus par les IgE ont été identifiés par spectrométrie de masse.
Les tests ELISA ont montré une large variation dans le groupe correspondant aux variétés commerciales cultivées, et les différences détectées entre les blés GM et leurs génotypes non-transformé sont inclues dans cette gamme de variation. De plus, les
valeurs les plus hautes de concentrations en IgE spécifiques ont été observées parmi les variétés commerciales cultivées.
Ces résultats ont montré que, au moins pour les génotypes transgéniques analysés ici, les concentrations en IgE spécifiques mesurées s’inscrivent dans la variation naturelle mesurée au sein des 20 variétés cultivées. Nous avons montré que l'allergénicité peut être soit augmentée soit diminuée selon la transformation, ce qui reflète un effet aléatoire de la transformation sur l’expression de gènes non ciblés.
Même si l’étude est concentrée quelques lignées de blé transgéniques et ne permet donc pas de tirer une conclusion générale sur l'équivalence substantielle de blés transgéniques, elle montre clairement la nécessité d'effectuer des évaluations de risque au cas par cas.
Il est important de réaliser toutes les évaluations nécessaires avant la commercialisation de lignées GM, pour contribuer à l'acceptabilité publique. Bien sûr ceci devrait être fait par des institutions de recherche publiques, indépendantes et non pas par des sociétés de biotechnologie, afin d’éviter les conflits d'intérêts.
Riassunto
Il problema delle allergie ha suscitato una crescente attenzione soprattutto riguardo al tema della Sostanziale Equivalenza delle piante GM. È in questo contesto che si è inserito il presente lavoro di dottorato, il quale si è prefissato due obiettivi:verificare eventuali cambiamenti nella risposta allergica di linee di frumento GM rispetto ai corrispondenti genotipi wt e verificare come tali cambiamenti rientrano nelle differenze di reattività osservate tra differenti cv di frumenti. Per questa prima parte del lavoro è stato condotto uno screening tramite ELISA utilizzando dei sieri di pazienti allergici. Parallelamente a questo si è voluto verificare se la trasformazione genetica possa aver avuto delle influenze sul potenziale allergico e/o la comparsa di nuovi polipeptidi riconosciuti come allergeni. Per questa parte del progetto si è scelto di utilizzare un approccio proteomico su 2 linee di frumento trasgeniche, e i corrispondenti genotipi wt. I risultati relativi alla prima parte del lavoro hanno dimostrato che le differenze osservate in termini di concentrazioni di IgE specifiche tra le linee di frumento trasgeniche e i corrispondenti genotipi wt sono inseribili nella variabilità di risposte osservate all’interno di una collezzione di frumenti coltivati. Anche per la seconda parte del lavoro non sono state osservate differenze significative tra le linee di frumento GM e le corrispondenti linee wt.
ABSTRACT
Wheat is one of the world’s most popular and cultivated crops and is also one of the six majour foods allergens. The kernel proteins are typically classified according to their solubility properties into albumins (water soluble), globulins (salt soluble) and insoluble prolamins (gluten proteins). The salt-soluble fraction includes proteins with metabolic activity or structural functions, while gluten proteins are directly involved in wheat quality, and both fractions cause food allergy and Baker’s asthma. These proteins accounting for about 10-15% of the grain dry weight. Since allergies are a major health concern and seem increasing, much attention is now being focused on foods from genetically modified (GM) plants because of the postulated health risk. This concern includes the perception that the insertion of transgenes into host plant genomes may result in unpredicted effects on the expression of other genes and effects on plant phenotype (e.g. increases in toxicity and allergy). If this is the case, transgenic crops could not be considered “substantially equivalent” to non-GM crops.
The classical safety assessment of GM plants includes a direct comparison with the corresponding untrasformed genotype. Thus, the first approach carried out in this work was a comparison by pairs of GM wheat lines and their untransformed (wild type, wt) genotypes, followed by a with a larger group of cultivars.
Two GM wheat lines (a durum and bread wheat) were compared to untransformed counterparts, first by Enzyme-Linked Immunoabsorbent Assay (ELISA) with twenty-one sera from patients suffering from food allergy to wheat and Baker’s asthma, and second by allergenomic approach. In particular we investigated a bread wheat line overexpressing a LMW-GS and a durum wheat line overexpressing the Wx-B1 gene. The comparison was focused on the albumins/globulins (A/G) fractions, because their amounts were changed as a result of the two transformation events. The results obtained by ELISA revealed significant differences for only two patients suffering from Baker’s asthma and for six patients affected from food allergy among the 21 tested. Thus, the concentrations of A/G specific IgE measured for GM bread wheat and its wt genotype and GM durum line and its wt genotype were comparable for 84% and 70% of sera. Two dimensional immunoblots were performed by using three sera from patients affected from food allergy and one serum from a patient with Baker’s asthma on A/G fractions of the two GM lines and their wt genotypes. Numerous IgE-binding
polypeptides were detected for each genotype and the profiles of these reactive polypeptides between GM wheat and its untransformed genotypes were similar. Only few changes in allergenic profiles between the transgenic lines and their wt genotype were detected. Hundred nine spots were identified by mass spectrometry as IgE binding proteins; most of them have been already described as allergens or potential allergens, and few of them are peculiar either of the GM or the wt genotype.
A comparison based on ELISA between the different water-salt soluble extracts obtained from a collection of GM wheat lines and commercial varieties of wheat obtained by conventional breeding methods was performed. Moreover, the different water-salt soluble extracts were compared by one dimensional immunoblots performed by using sera from patients allergic to wheat and specific anti-LTP antibodies. The IgE-binding polypeptides from different extracts were compared by mass spectrometry.
The ELISA test showed a wide variation in the group corresponding to the commercial cultivars, and the differences detected between GM wheats and their wt genotypes were included in this range of variation. Moreover, the highest values were observed in commercial cultivars compared to the GM lines.
These results showed that, at least for the GM genotypes here analysed, the differences in specific IgE concentrations can be considered within natural variation.
Context of the work
Wheat is indisputably an important part of the daily diet of millions of people, and also one of the major crops cultivated in the world, with a total production of about 600 million tons each year globally, 75% of which is destined to food use. Moreover, it has always been a target of choice for classical breeding and biotechnological programs. Unfortunately, this popular and cultivated crop is also one of the six major foods involved in food allergy. Allergic reactions to wheat are of two types; they may arise after ingestion of food containing flour, but also from flour and dust inhalation during grain processing, as in baker’s asthma. This latter is one of the most common occupational disease in Europe.
The kernel proteins are typically classified according to their solubility properties into albumins (water soluble), globulins (salt soluble), gliadins (soluble in concentrate alcohol), glutenins (soluble in diluted acid or alkaline solutions). Gliadins and glutenins together make up the gluten.
The water/salt-soluble fraction includes proteins with metabolic activity or structural functions, while gluten proteins are directly involved in wheat quality, and both fractions cause food allergy and Baker’s asthma. These proteins account for about 10-15% of the grain dry weight.
Because food allergies seem increasing this aspect is considered now as a significant public health concern, in particular in regard to GM foods. In fact, one of the major issues about plant genetic modifications is the possibility of unpredicted effects caused by the insertion of transgenes into the host plant genome that might cause changes of gene expression, included those coding for allergenic or toxic compounds. At this regard, a comparative assessment between GM plants and their traditional parental controls is requested to evaluate applicability ofthe “substantial equivalence” principle.
Aim of the work
The main aim of this work was to establish if genetic transformation of wheat increases the allergy risk, since wheat is per se one of the most allergenic foods. Moreover, the approaches used allowed to increase the knowledge on proteins involved in wheat allergies, especially those present in the water/salt-soluble fraction, that have been less intensively studied with respect to the insoluble gluten proteins. This because these latter are directly involved in quality of wheat end-use products, and thus have been characterized in more detail.
For assessment of allergenicity of GM wheat lines compared to their parental genotypes, an allergenomic approach was first used. In a second step, a wider study was undertaken in order to compare the GM lines and their parents with a large of group of commercial cultivars, in order to establish if variations in allergenicity could be of the same order as that present in varieties obtained by conventional breeding methods.
Articles and Poster published during this PhD
Larré C., Lupi R., Gombaud G., Brossard C., Moneret-Vautrin D.A., Rogniaux H., Denery-Papini S., (2011) “Assessment of allergenicity of diploid and hexaploid wheat genotypes: Identification of allergens in the albumin/globulin fraction”, Journal of Proteomics 74(8): 1279-1289 (In annex II).
Lupi R., Denery-Papini S.,Rogniaux H., Lafiandra D., Rizzi C., M. De Carli M., Moneret-Vautrin D. A., Masci S.*, Larré C.* “An allergenomic approach to evaluate the impact of genetic transformation in bread and durum wheat”. Submitted
Lupi R., Masci S., Lafiandra D., Rogniaux H., Tranquet O., Moneret-Vautrin, Rizzi C., De Carli M., Denery S., Larré C. “Immunochemical analyses for the assessment of the variation in the amount of allergenic polypeptides of GM genotypes in comparison to commercial durum and bread wheat”. Will be submitted.
Short Paper:
Lupi R., Pineau F., Deshayes G., Moneret-Vautrin D.A., Denery S., Popineau Y., D’Ovidio R., Lafiandra D., Anderson O.D., Masci S., Larré C. (2009) “Characterization of allergens present in the seed soluble protein fraction of transgenic and untransformed wheat lines”, Proceedings of Xth International Gluten Workshop, Clermont-Ferrand.
Poster and oral communication
Lupi R., Denery S., Lafiandra D., Larrè C., Masci S.”How much does the transgenesis affect the allergenicity?” Joint Meeting AGI-SIBV-SIGA, Assisi, September 2011 ISBN 978-88-904570-2-9 (oral presentation).
Lupi R., Gombaud G., Moneret-Vautrin D.A., Rogniaux H., Denery-Papini S., Larré C. “Identification of allergens in the albumin/globulin fraction of two wheat genotypes (T.monococcum and T. aestivum)” FINAL COST MEETING, Dijon May 2011(poster).
Larré C., Lupi R., Moneret-Vautrin D.A., Rogniaux H, Denery-Papini S. “ Évaluation de l'allergénicité de génotypes de blé diploïde et hexaploïde : identification des allergènes dans la fraction albumines/globuline“. 6em Congres Francophone
Lupi R., Denery S., Masci S., Larré C. “Allergens of the salt-soluble fraction of the grain are not modified in a GM line over-expressing a glutenin low molecular weight subunit”. SIGA, 54°Annual Congress, Matera, September 2010 (poster).
Janni M., Bozzini T., Lupi R., Di Giovanni M., Masci S., D’Ovidio R. “Functional characterization of TAPGIP genes in wheat”. SIBV Annual National Conference, Rome, July 2010 (poster).
Lupi R., Denery S., Masci S., Larré C. “Allergens of the salt-soluble fraction of the grain are not modified in a GM line over-expressing a glutenin low molecular weight subunit”. 5th ItPA Annual National Conference, Florence, June 2010 (poster).
Lupi R., Pineau F., Deshayes G., Moneret-Vautrin D.A, Denery S., Popineau Y., D’Ovidio R., Lafiandra D., Anderson O.D., Masci S., Larré C. “Characterization of allergens present in the seed soluble protein fraction of transgenic and untransformed wheat lines”. Proceedings of Xth International Gluten Workshop, Clermont-Ferrand,
September 2009 (oral presentation).
Lupi R., Pineau F., Deshayes G., Moneret-Vautrin D.A., Denery S., Popineau Y., D’Ovidio R., Lafiandra D., Anderson O.D, Masci S., Larré C. “Characterization of allergens present in the seed soluble protein fraction of transgenic and untransformed wheat lines”. 8th European Young Cereal Scientists and Technologists Workshop Viterbe, Aout 2009 (oral presentation).
Lupi R., Janni M., Bozzini T., D’Ovidio R., Masci S. “A procedure to extract apoplastic proteins from wheat leaves for proteomic analyses of wheat transformed with defence-related genes” COST FA0603 WG1 MEETING Viterbo, May 2009 (poster).
Ringraziamenti/Remerciements
Il presente lavoro di Dottorato in cotutela è stato in parte realizzato grazie al contributo di sostegno per le tesi in cotutela messo a disposizione dall’Università Italo-Francese (Vinci 2010-CAP II).
Il conseguimento del Dottorato è un per me un sogno che si realizza. Non avrei mai potuto raggiungere questo traguardo senza la Professoressa Stefania Masci. Stefania, non è facile trovare parole scontate per dirti quanto ti sono grata, per avermi sostenuta, per aver creduto in me, sempre. Sapere di avere la tua stima per me è veramente importante. Grazie di cuore.
Un sentito ringraziamento va anche al Professore Domenico Lafiandra. Professore, lei si è sempre dimostrato disponibile a farmi crescere professionalmente, e per questo la ringrazio di cuore.
Grazie a tutti i ragazzi del lab, Francesco, Linda, Lina, Samuela, ed Eleonora.
Grazie a tutti gli amici, Marianna, Sara, Valentina, Alessia, Serena, Kajal, Francesco, Fabio, Marco, Federico, Paolo Manolo e Fabio. Ragazzi so che posso contare su di voi in ogni momento, siete stati al mio fianco in questo percorso e per questo vi ringrazio. Un grazie speciale va Danielà o come la chiamo sempre io Panicì. Dany anche se adesso non ci vediamo più tutti i giorni tu mi sei sempre stata vicina, e per questo ti ringrazio tanto tanto.
Un grazie speciale è per Federica, sei stata un’ancora. Abbiamo condiviso momenti difficili ma anche tanti momenti belli di cui continueremo a ridere anche quando non lavoreremo più insieme. Grazie, sei un’amica.
Un grazie enorme va al mio compagno, collega, amico, isomma a Gaetan. Abbiamo vissuto quest’avventura insieme, fianco a fianco. Grazie per la tua pazienza, per il tuo sostegno e per il tuo amore.
Grazie Mamma, Babbo, Maurizio. Siete la mia famiglia, la cosa più importante.
Je remercie de tout mon cœur Colette Larré et Sandra Denery. Vous avez toujours cru en moi, à chaque moment vous m’avez fait sentir votre estime. Merci pour m’avoir encouragée et pour m’avoir fait croitre professionnellement. Travailler avec vous est un plaisir. Je n’ai pas de paroles pour vous dire combien je vous suis reconnaissante pour tout ce que vous avez fait pour moi. Vous avez, toutes les deux, une place spéciale dans
mon cœur. Merci pour l’affection que vous m’avez montré aussi dans les moments les plus difficiles.
Un merci spécial à Florence. Cela a été vraiment beau de travailler avec toi. Tu m’as toujours aidée et choyée. Merci.
Merci à toute l’équipe de spectrométrie de masse. Merci à Gilbert, pour son aide dans les expériences et parce qu’il n'a jamais rien dit, même si j'ai plusieurs fois envahi son bureau, laissant mes affaires partout.
Merci à Olivier, ta gaieté est contagieuse. Tu m’as toujours fait sentir ton respect et ton amitié, même dans les moments les plus tristes. Merci tu es adorable.
Un merci tout spécial à Manon et Julie, mes deux amies. Je vous ai beaucoup négligé, mais je sais que quand je reviendrai à Nantes vous serez là.
Index
Index ... 1
Abbreviations ... 5
Amino Acids List ... 8
List of Figures ... 9
List of Tables ... 13
Introduction ... 15
1 Wheat ... 17
1.1 Origin of the wheat genomes ... 18
1.2 Wheat caryopsis: anatomy and composition ... 20
1.3 Wheat bran ... 22
1.4 The embryo ... 22
1.5 Endosperm development ... 23
1.6 Main components of wheat endosperm ... 26
1.6.1 Starch ... 26
1.6.1.1 Starch structure ... 26
1.6.1.2 Amylose and Amylopectin ... 26
1.6.1.3 Starch biosynthesis ... 27
1.6.2 Proteins ... 30
1.6.2.1 Seed storage proteins ... 30
1.6.2.1.1 Prolamin storage proteins ... 30
1.6.2.1.1.1 The gliadins ... 33
1.6.2.1.1.2 The glutenins ... 37
1.6.2.1.1.2.1 High Molecular Weight Glutenin Subunits (HMW-GS) .... 37
1.6.2.1.1.2.2 Low Molecular Weight – Glutenin Subunits (LMW-GS) .. 40
1.6.2.2 Sequences and structures homologies of wheat proteins ... 42
1.6.2.3 Albumins and Globulins ... 43
2 Bread and pasta making ... 45
3 Genetic engineering compared to classical breeding ... 46
3.1.1 Wheat transformation ... 47
3.1.2 Some examples of wheat transformation ... 48
4 Allergy: symptoms and diagnostics ... 51
4.2 Clinical manifestations ... 55
4.2.1 Gastrointestinal symptoms ... 55
4.2.2 Skin disorders ... 55
4.2.3 Oral allergy syndrome (OAS) ... 56
4.2.4 Respiratory disorders ... 56
4.2.5 Anaphylaxis ... 57
4.3 In vivo tests in the diagnosis of food allergy ... 58
4.3.1 Skin prick test (SPT) ... 58
4.3.2 Atopy patch test (APT) ... 59
4.3.3 Food challenges ... 59
4.3.4 In vitro quantification of specific IgE ... 60
4.4 Cross-reactivity: Cross-allergy ... 61
5 Wheat allergy ... 63
5.1 Hypersensitive reactions to wheat ... 63
5.1.1 Baker’s asthma ... 63
5.1.2 Food allergy to wheat ... 64
5.1.3 Coeliac disease ... 65
5.2 Wheat allergens ... 66
5.2.1 Storage proteins ... 67
5.2.1.1 Salt Soluble proteins ... 68
5.3 Examples of wheat allergens of the salt soluble proteins ... 69
5.3.1 LTP- lipid transfer protein ... 69
5.4 α-amylase /trypsin inhibitors ... 72
5.5 β-amylase ... 74
5.6 Serine protease inhibitors ... 75
5.7 Effects of processing on allergenicity ... 76
6 “Allergenomics” ... 77
7 Substantial equivalence of Genetically Modified Plants and Natural Variation ... 79
8 Hypoallergenic crops obteined by genetic transformation ... 84
References ... 85
Chapter I ... 121
References-Chapter I ... 167
Chapter II ... 200
References-Chaper II ... 221
Annexe-Chapter II ... 225
Annex II ... 236
Abbreviations
1D electrophoresis: One dimensional electrophoresis 2D electrophoresis: Two dimensional electrophoresis A/G: Albumins/Globulins
AD: Atopic Dermatitis
ADP: Adenosine Di-Phosphate
AEDS: Atopic eczema dermatitis syndrome AM: AMylose
ANOVA: ANalyis Of VAriance AP: AmyloPectin
A-PAGE: Acid-PolyAcrylamide Gel Eletrophoresis APC: Antigen Presenting Cell
APT: Atopy Patch Test AS: Anaphylactic shock AT: Asthma
ATP: Adenosine Tri-Phosphate BA: Baker’s Asthma
CD: Coeliac Disease
CD4: Cluster of Differentiation 4 CHU: Centre Hospitalier Universitaire
CM-like proteins: Chloroform-Methanol like proteins CV: cultivated variety
DBPCFC: Double-Blind Placebo-Controlled Food Challenge DNA: DeoxyriboNucleic Acid
Dpa: Days post anthesis DTT: DiThioThreitol
EDTA: EthyleneDiamineTetraacetic Acid EFSA: European Food Safety Authority
ELISA: Enzyme Linked ImmunoSorbent Assay EU: European Union
FA: Food Allergy
FAO: Food and Agriculture Organization
GBSS: Granule-Bound Starch Synthase GI: Gastro-intestinal symptoms
GM: Genetically Modified
HLA: human histocompatibility leucocyte antigen HMW-GS: High Molecular Weight Glutenin Subunit HWP: Hydrolyzed Wheat Proteins
IEF: IsoElectric Focusing Ig : Immunoglobuline IgE: Immunoglobulin E IgG: Immunoglobulin G
ISAC: Immuno-Sorbent Allergen Chip
ISAC: International Society for Advancement of Cytometry IUIS: International Union of Immunological Societies KDa: Kilo Dalton
LC-MS/MS: Liquid Chromatography Mass Spectrometry/Mass Spectrometry LMW-GS: Low Molecular Weight Glutenin Subunit
M: Molar
MHC: Major histocompatibility complex MS: Mass Spectrometry
MW: Molecular weight
NIAID: National Institute of Allergy and Infectious Diseases NMR: Nuclear Magnetic Resonance
nsLTP : non-specific Lipid Transfer Protein OAS: Oral allergy syndrome
OECD: Organisation for Economic Co-operation and Development PAGE : Poly Acrylamide Gel Eletrophoresis
PBS: Phosphate Buffer Salin
PBST: Phosphate Buffered Saline Tween PGIP: PolyGalacturonase Inhibitor Protein pI: Isoelectric point
PVDF: PolyVinylidene DiFluoride PVP: PolyVinylPyrrolidone R: Rhinitis
Rev.: Reviewed
RNAi: RiboNucleic Acid interference
RP-HPLC: Reversed Phase High Performance Liquid Chromatography SBE: Starch Branching Enzymes
SDS-PAGE: Sodium Dodecyl Sulfate PolyAcrylamide Gel Electrophoresis Serpin: serine protease inhibitor
SIC: Specific Inhalation Challenge SIT: Allergen-Specific ImmunoTherapy SPT: Skin Prick Test
SS: Starch Synthases
T lymphocytes: Thymus Lymphocytes T-DNA: Transferred DNA
TG2: enzyme tissue transglutaminase Th: T helper
Ti: Tumor inducing plasmid TLP: Thaumatin-Like Protein UK: United Kingdom
Urt: Urticaria
WDEIA: wheat-dependent exercise-induced anaphylaxis WHO: World Health Organization
Amino Acids List
Glycine: Gli, G Alanine: Ala, A Serine: Ser, S Threonine: Thr, T Cysteine: Cys, C Valine: Val, V Leucine: Leu, L Isoleucine: Ile, I Methionine: Met, M Proline: Pro, P Phenylalanine: Phe, F Tyrosine: Tyr, Y Tryptophan: Trp, W Aspartic Acid: Asp, D Glutamic Acid: Glu, E Asparagine: Asn, N Glutamine: Gln, Q Histidine: His, H Lysine: Lys, K Arginine: Arg, RList of Figures
Introduction:
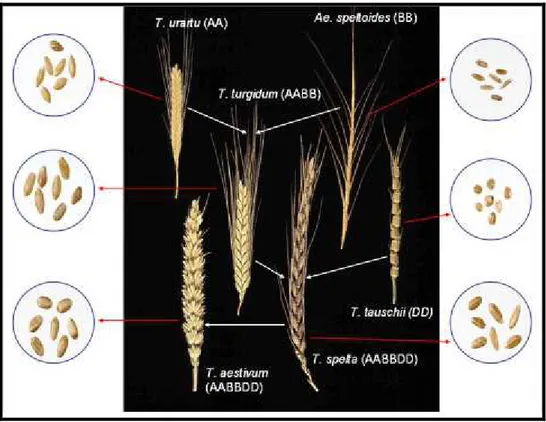
Fig. 1: The evolutionary and genome relationships between cultivated bread and durum wheats and
related wild diploid grasses, showing examples of spikes and grain. Taken from Shewry, 2009.
Fig. 2: Critical reproductive and genetic events in the allopolyploid speciation of T. aestivum: T. turgidum–Ae. tauschii natural hybridization (yellow); normal growth of fertile triploid F1 hybrids (green);
and genetic and epigenetic changes in the allohexaploid genomes of F2 and later generations (red).Taken from Matsuoka 2011.
Fig. 3: The wheat kernel.
Fig. 4: Schematic representation of Feekes' and Zadoks scales.
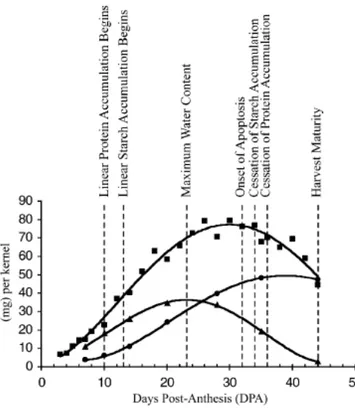
Fig. 5: Temporal patterns in the accumulation of starch and protein on the basis of water content (►),
fresh weight (■) and dry weight (●) during the grain development. Proteins were measured by a nitrogen combustion analysis, starch was measured by a specific assay kit, and the onset of apoptosis was estimated by the analysis of fragmented genomic DNA. Plants grown under a 24°C/17°C day/night regimen. Taken from Dupont and Altenbach (2003).
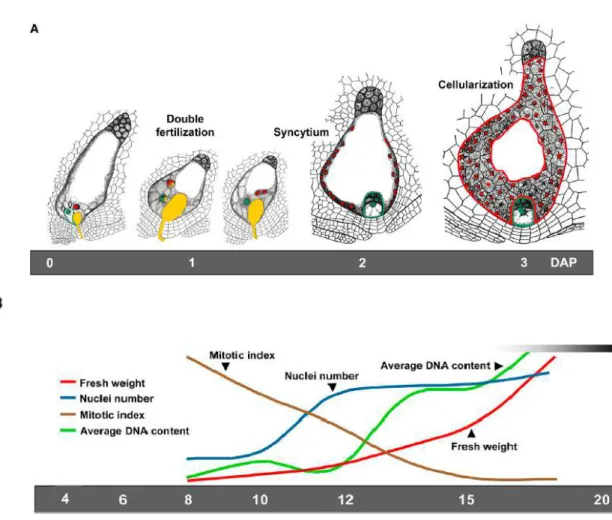
Fig. 6: Phases in endosperm development. Although this figure refers to maize, it is a good example of
endosperm development in other grasses as well. A, Double fertilization, syncytium formation, and cellularization of the endosperm occur within 3 to 4 DAP. The pollen tube and sperm nuclei are shown in yellow, polar nuclei in the central cell of the female gametophyte and endosperm nuclei are shown in red, and the egg cell nucleus and embryo nuclei are shown in green. Outlines of the multicellular endosperm and embryo are drawn in red and green, respectively. B, The dynamics of key parameters during mid endosperm development, such as fresh weight (red line), nuclei number (blue line), mitotic index (brown line), and average DNA content (C value; green line), are shown at bottom. Taken from Sabelli and Larkins 2009.
Fig.7: 1D SDS-PAGE of waxy proteins in bread wheat (a) and durum wheat (b).
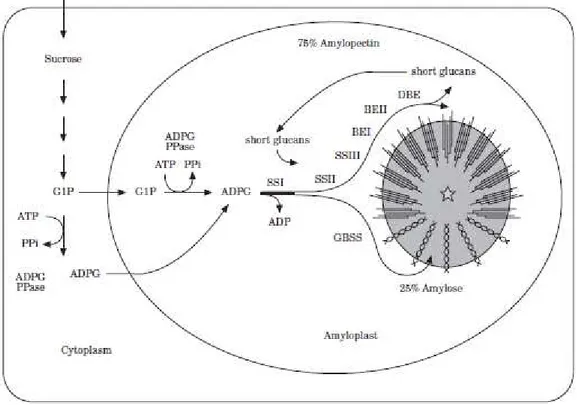
Fig. 8: General scheme for starch biosynthesis in cereals. Sucrose is transformed to glucose-1-phosphate
through the action of invertase, sucrose synthase, UDP-glucose pyrophosphorylase, hexokinases, and phosphoglucomutase (not shown). Taken from Rahman et al., 2000.
Fig. 9: Scanning electron micrographs of isolated starch granules from durum wheat cv Svevo. Taken
from Sestili et al., 2010.
Fig. 10: After kneading, dough can be washed to recover the gluten network as a cohesive mass which is
stretched in the photograph to demonstrate its viscoelastic properties. Taken from Shewry 2009.
Fig. 11: Typical acid-PAGE separation of gliadins of hexaploid wheats. Arrow indicates direction of
acid-PAGE run. Gliadins are divided on basis of electrophoretic mobilities into ω-,γ-, β- and α-gliadins. Taken from Gianibelli et al., 2001.
Fig. 12: Two-dimensional electrophoresis of glutenin subunits of the bread wheat (cv Chinese Spring).
The HMW-GS and the B-, C-, and D-type groups of LMW-GS are indicated. Taken from D’Ovidio and Masci 2004.
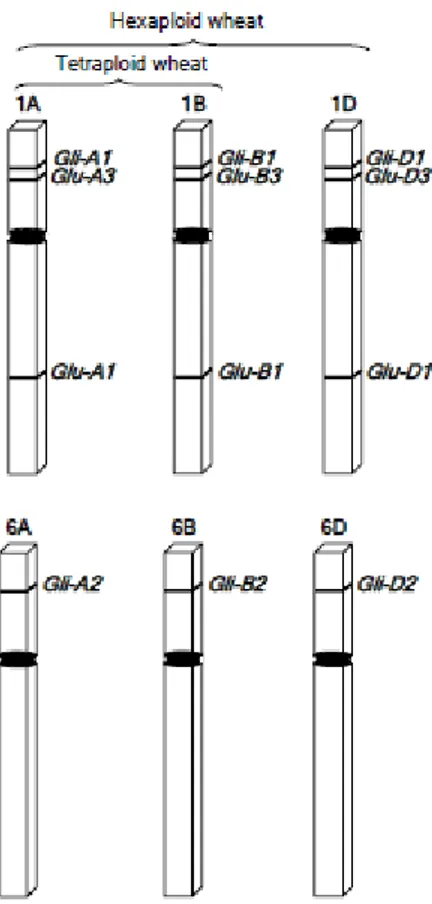
Fig. 13: Schematic representation of the chromosomal locations for the genes encoding the gluten
Fig. 14: Schematic illustration of α/β-, γ-, and ω-gliadins. Black bars with letter s indicate the
approximate position of cysteine residues that are all involved in intramolecular disulphide bonds.
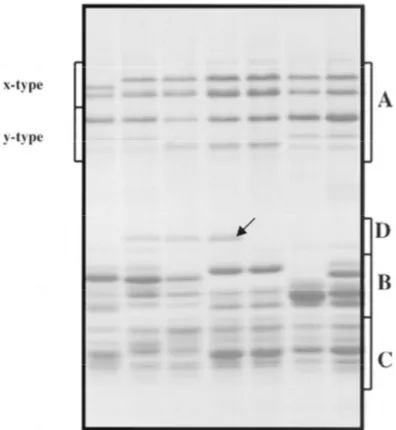
Fig. 15: SDS-PAGE of polymeric protein (after reduction to subunits), Group A: HMW glutenin subunits
showing x- and y-type glutenin subunits. Groups B-, C-, D-: LMW glutenin subunits. Arrow indicates subunit D. Taken from Gianibelli 2001.
Fig. 16: Structure of the x- and y-type HMW-GS. Black bars with letter s represent cysteine residues
which may be involved in either an inter- or intramolecular disulphide bond. (s) indicates the cysteine residues not found in some x and y-type HMW-GS.
Fig. 17: Schematic illustration of a B-type LMW-GS. Black bars with letter s represent cysteine residues
available for intermolecular or intramolecular disulphide bonds. s* indicates the first cysteine residue alternatively located in the N-terminal region or at the start of repetitive domain.
Fig. 18: Timing of biochemical processes of wheat endosperm during grain development. Profiles based
on protein number. Taken from Vensel et al 2005.
Fig. 19: Classification and terminology for food allergy most frequently used in Europe. Taken from
Asero et al., 2007.
Fig. 20 : General mechanism of allergic reaction: During the sensitization phase, an allergen molecule
crosses the epithelial barrier and is captured by an antigen presenting cell (APC). The allergen is presented to a naive T cell that differentiates into Th2 lymphocytes and secretes IL-4. The production of allergen-specific IgE by B cells is activated. These IgE antibodies then bind to mast cells. During the effector phase of allergy, a new contact with the allergen binding to IgE on the surface of mast cells induces their degranulation, releasing many inflammatory mediators such as histamine.
Fig. 21: SPT test with fresh food carried out by the prick–prick technique.
Fig. 22: Atopy patch test with allergens extracts applied on skin and reaction observed 48 h later. Fig. 23 : Classification of the different groups of allergenic proteins identified in wheat flour.
Fig 24: Structure of the wheat nsLTP1 showing the helix bundle (a) and disulphide bonds (b). Taken from
Douliez et al., 2000.
Fig. 25: Molecular model of LTP1 internal cavity.
Fig. 26: Sequences alignment of cereal LTP1 proteins. Taken from Douliez et al., 2000.
Fig. 27: Wheat α-amylase inhibitor (1HSS). Blue, a-helices; red, b-strands; yellow, disulfide bonds. Taken from Breiteneder and Radauer (2004).
Fig 28: Schematic representation of “allergenomics” approach, which combines the protein separation by
2D electrophoresis with IgE immunorecognition by immunoblotting. Allergens are immunolabelled with serum of allergic patients. In this strategy, MS, supported by bioinformatic and database analyses, has the pivotal task for protein identification. Taken from Larré et al., 2011.
Fig. 29: Safety assessment strategies for genetically modified (GM)-crop-derived foods. Taken from Kok
and Kuiper 2003.
Fig. 30: Analysis performed in Shewry’s study in order to define substantial equivalence of GM wheats.
Chapter I:
Fig.1: Percentage of major protein fractions after sequential extraction for Bobwhite-GM line and the
wild type genotype (left), and Svevo-GM line and the wild type genotype (right).
Fig. 2: 1D Immunoblotting. Reactivity of IgE towards gliadin and glutenin fractions of Bobwhite-GM
line (1) and Bobwhite wt (2). Sera from patients affected from food allergy to wheat.
Fig. 3: Concentrations (ng/mL) in IgE specific for A/G fraction extracted from the four wheat genotypes.
Sera obtained from patients suffering from Baker’s asthma. Asterisks indicate patients’ sera showing significative differences between the GM line and its untransformed counterpart.
Fig. 4: Concentration (ng/mL) of IgE specific for A/G fraction (ng/mL) extracted from the four wheat
genotypes. Sera obtained from patients suffering from food allergy. Asterisks indicate patients’ sera showing significative differences between the GM line and its untransformed counterpart.
Fig. 5: 2D-Immunoblotting of A/G fraction from Svevo wt with sera from patient allergic to wheat. S:
2D-SDS-PAGE of Svevo wt’s A/G fraction .Immunoblotting with serum 68 (a); serum 781(b); serum 458
(c).
Fig. 6: 2D-Immunoblotting of A/G fraction from Svevo-GM line with sera from patient allergic to wheat. SG: 2D-SDS-PAGE of Svevo-GM line’s A/G fraction. Immunoblotting with serum 68 (d); serum 781(e);
serum 458 (f).
Fig. 7: Specific IgE-binding polypeptide (S24) for the serum 68 detected in Svevo wt and absent from the
equivalent blot of Svevo-GM line.
Fig. 8: 2D-Immunoblotting of A/G from Bobwhite wt with sera from patient allergic to wheat.
B:2D-SDS-PAGE of Bobwhite wt’s A/G fraction. Immunoblotting with serum 68 (g); serum 38(h); serum 458
(i).
Fig. 9: 2D-Immunoblotting of A/G from Bobwhite-GM line with sera from patient allergic to
wheat.BG:2D-SDS-PAGE of Bobwhite-GM line’s A/G fraction. Immunoblotting with serum 68 (l); serum 38(m); serum 458 (n).
Supplementary data-Chapter I
Fig S1: 2D-Immunoblotting performed on A/G fraction of Bobwhite-GM line with anti-peptide
antibodies specific for N-terminal sequences of LMW-GS (a), γ-gliadins (b) and α/β-gliadins (c). Fig. S2a: ELISA performed with anti-peptide antibodies specific for the different gliadin classes: α/β-, γ-, ω-2-, ω-5-gliadins.
Fig. S2b: ELISA performed with anti-peptide antibodies specific for the different glutenin classes:
LMW-GS and HMW-GS
Chapter II:
Fig 1: SDS-PAGE gradient gels (10-15% acrylamide) performed on metabolic fraction (A) and CM-like
fraction (B) of 2 bread GM lines (lines 3 and 4), null-segregant line (line 2), its corresponding wt genotype (line 1), 3 durum GM lines ( lines 6, 7, 9), and its control genotypes (lines 5 and 8).
Fig 3: SDS-PAGE gradient gels (10-15% acrylamide) performed on metabolic fraction (E) and CM-like
fraction (F) of ten cv of bread wheat.
Fig. 4: SDS-PAGE (left) and Western Blotting obtained after incubation of the membrane with anti-LTP
antibodies (right) of different soluble proteins extraction of bread wheat cv Bobwhite. Line 1: CM-like fraction; line 2: Metabolic fraction; line 3: A/G fraction.
Fig. 5: Immunoblotting obtained after incubation of the sheets with human sera from allergic patient to
wheat (sera 458 and 858 from patients affected by backer’s asthma and serum 68 from patient suffering of food allergy). Line 1: CM-like proteinic extract; line 2: Metabolic proteinic extract; line 3: A/G extract (Lines 1, 2, 3: soluble proteins extract from Bobwhite).
Fig. 6: Concentration of specific IgE for twenty-four sera from patients affected by food and respiratory
allergy to wheat. The pink rectangle contains bread GM lines (3, 4), nulle-segregant line (2) and its corresponding genotype (1).The clear green rectangle contains durum GM lines (6, 7, 9) and its corresponding genotypes (5, 8). The green rectangle contains ten cv of durum wheat (10-19) while the red rectangle contains ten cv of bread wheat (20-29).
Fig. 7: Concentration of specific IgE for twenty-four sera from patients affected by food and respiratory
allergy to wheat. The pink circle contains bread GM lines (3, 4), nulle-segregant line (2) and its corresponding genotype (1). The clear green circle contains durum GM lines (6, 7, 9) and its corresponding genotypes (5, 8).
The green circle contains ten cv of durum wheat (10-19) while the red circle contains ten cv of bread wheat (20-29) used for the study.
List of Tables
Introduction:
Tab. 1: Wheat production and area harvest in the world and in different continents (FAOSTAT data,
2010).
Tab. 2: Other examples of genes transferred into wheat by biolistic method. Taken from Sahrawat et al.,
2003, modified.
Tab. 3: Chemical composition of wheat grain and its different parts (converted to percentage on a dry
matter basis). Taken from Belderok, 2000.
Tab. 4: Comparison of prolamins repetitive sequences.
Tab. 5: Clusters of cross-immunity/cross-allergy. Taken from Ebo and Stevens 2001.
Table 6: List of recognized wheat allergens by the IUIS Allergen Nomenclature Sub-Committee
Chapter I:
Table 1A: Clinical profiles of the patients with Baker’s asthma and their concentrations (ng/ml) in IgE
specific for A/G, gliadins and LMW-GS of the bread wheat cv Récital as tested by ELISA. R=Rhinitis, AT= Asthma, +: = response at the lower limit of quantification, neg: negative. **= sera used in 2D immunoblotting.
Table 1B: Clinical profiles of the patients with food allergy to wheat and their concentrations (ng/ml) in
IgE specific for A/G, gliadins, and LMW-GS of the bread wheat cv Récital as tested by ELISA. AEDS=Atopic eczema dermatitis syndrome, Urt=Urticaria, GI=Gastro-intestinal symptoms, AS=Anaphylactic shock, nd: not done, +: = response at the lower limit of quantification, neg=negative. **= sera used in 2D immunoblotting.
Table 2: Sera from patients suffering from food allergy (FA) and Baker’s asthma (BA) used for 2D
immunoblotting on A/G fraction of Svevo wt, Svevo-GM line, Bobwhite wt, and Bobwhite-GM line.
Table 3:Numbers of IgE-binding polypeptides, S: serum. Table 4: Numbers of IgE-binding polypeptides, S: serum.
Table 5: List of identified common proteins from 2D gels between Svevo wt (Fig. 5) and Svevo-GM line
(Fig. 6). Spot Number: assigned protein spot number corresponding to those indicated in Figs. 5 and 6, Sub-group: Sub-group to which the protein belongs. All the proteins in a sub-group are identi ed with the same valid peptides, Prot Id: the protein identity as referred to in Uniprot or Wheat TIGR databank, Uniprot best homologue protein name: its corresponding protein or the Uniprot best homologue protein name, log (E-value): Protein E-value expressed in log, %Cov: the per cent of protein coverage, MW: Molecular weight of the protein expressed in KDa,Total Unique peptides: number of unique peptides for the protein, Serum: serum for which the IgE-binding spot was detected .
Table 6: List of identified specific proteins from 2D gel of Svevo-GM line (Fig. 6). Spot Number:
assigned protein spot number corresponding to those indicated in Fig. 6, Sub-group: Sub-group to which the protein belongs. All the proteins in a sub-group are identi ed with the same valid peptides, Prot Id: the protein identity as referred to in Uniprot or Wheat TIGR databank, Uniprot best homologue protein name: its corresponding protein or the Uniprot best homologue protein name, log (E-value): Protein E-value expressed in log, %Cov: the per cent of protein coverage, MW: Molecular weight of the protein expressed in KDa,Total Unique peptides: number of unique peptides for the protein, Serum: serum for which the IgE-binding spot was detected .
Table 7: List of identified specific proteins from 2D gel of Svevo wt (Fig. 5). Spot Number: assigned
protein spot number corresponding to those indicated in Fig. 5, Sub-group: Sub-group to which the protein belongs. All the proteins in a sub-group are identi ed with the same valid peptides, Prot Id: the protein identity as referred to in Uniprot or Wheat TIGR databank, Uniprot best homologue protein name: its corresponding protein or the Uniprot best homologue protein name, log (E-value): Protein E-value expressed in log, %Cov: the per cent of protein coverage, MW: Molecular weight of the protein expressed in KDa,Total Unique peptides: number of unique peptides for the protein, Serum: serum for which the IgE-binding spot was detected .
Table 8: List of identified common proteins from 2D gels between Bobwhite wt (Fig. 8) and
Bobwhite-GM line (Fig. 9). Spot Number: assigned protein spot number corresponding to those indicated in Figs. 5 and 6, Sub-group: Sub-group to which the protein belongs. All the proteins in a sub-group are identi ed with the same valid peptides, Prot Id: the protein identity as referred to in Uniprot or Wheat TIGR databank, Uniprot best homologue protein name: its corresponding protein or the Uniprot best homologue protein name, log (E-value): Protein E-value expressed in log, %Cov: the per cent of protein coverage, MW: Molecular weight of the protein expressed in KDa,Total Unique peptides: number of unique peptides for the protein, Serum: serum for which the IgE-binding spot was detected .
Table 9: List of identified specific proteins from 2D gel of Bobwhite-GM line (Fig. 9). Spot Number:
assigned protein spot number corresponding to those indicated in Figs. 5 and 6, Sub-group: Sub-group to which the protein belongs. All the proteins in a sub-group are identi ed with the same valid peptides, Prot Id: the protein identity as referred to in Uniprot or Wheat TIGR databank, Uniprot best homologue protein name: its corresponding protein or the Uniprot best homologue protein name, log (E-value): Protein E-value expressed in log, %Cov: the per cent of protein coverage, MW: Molecular weight of the protein expressed in KDa,Total Unique peptides: number of unique peptides for the protein, Serum: serum for which the IgE-binding spot was detected .
Table 10: List of identified specific proteins from 2D gel of Bobwhite wt (Fig. 8). Spot Number: assigned
protein spot number corresponding to those indicated in Figs. 5 and 6, Sub-group: Sub-group to which the protein belongs. All the proteins in a sub-group are identi ed with the same valid peptides, Prot Id: the protein identity as referred to in Uniprot or Wheat TIGR databank, Uniprot best homologue protein name: its corresponding protein or the Uniprot best homologue protein name, log (E-value): Protein E-value expressed in log, %Cov: the per cent of protein coverage, MW: Molecular weight of the protein expressed in KDa,Total Unique peptides: number of unique peptides for the protein, Serum: serum for which the IgE-binding spot was detected .
Chapter II:
Table 1: Wheat genotypes included in this study
Table 2: Clinical characteristics of patients and their IgE reactivity against A/G in ELISA or
immunoblotting. AEDS: atopic eczema dermatitis syndrome, GI=Gastro-intestinal symptoms AS: anaphylactic shock, R=Rhinitis, AT= Asthma and nd: not done, +: = response at the lower limit of quantification, neg: not reactivity.
Annex-Chapter II
Table 3: List of identified proteins from 1D gel of Bobwhite wt (Fig. 1). The columns correspond to:
Band:assigned protein number corresponding to those indicated in Fig.1, Prot Id: the protein identity as referred to in Uniprot or Wheat TIGR databank, Uniprot best homologue protein name: its corresponding protein or the Uniprot best homologue protein name, log (E-value): Protein E-value expressed in log, %Cov: the per cent of protein coverage, MW: Molecular weight of the protein expressed in KDa,Total Unique peptides: number of unique peptides for the protein.
1
Wheat
The cereals are a major source of dietary calories, among which wheat provides about one-fifth of the calories consumed by humans. The world cereal production was 2432 million tons in 2010, 650 million tons of which corresponded to wheat. FAO’s data for Italian and French wheat production in 2010 was 6.9 and 38.207 million tonnes respectively with an area harvested corresponding to 1,865,000 hectares in Italy and 5,426,000 hectares in France (http://faostat.fao.org/site/567/default.aspx#ancor).
Tab. 1: Wheat production and area harvest in the world and in different continents (FAOSTAT data,
2010).
2010 Wheat production (tonnes)
2010 Wheat area harvest (hectares) World 2432236739 216974683 Africa 22016718 9501565 North America 83269400 27546900 South America 25731739 8150346 Asia 292441446 101657580 Europe 201149388 55870270 Oceania 22582901 13561772
1.1
Origin of the wheat genomes
Cultivated wheats and their close wild relatives belong to the genus Triticum L. of the family Gramineae and are a member of the tribe Triticeae, which contains ∼300 species, forming a polyploid series, with a basic chromosome number (x) equal to 7, comprising diploid (2n=2x=14), tetraploid (2n=4x=28) and hexaploid (2n=6x=42) wheats. The wheat genus Triticum has a relatively small number of species (six species) with wild taxa occurring in the Middle East and Transcaucasus region. The genus Triticum consists of six species: Triticum monococcum L. (AA genome); Triticum urartu Tumanian ex Gandilyan (AA genome); Triticum turgidum L. (AABB genome);
Triticum timopheevii (Zhuk.) Zhuk (AAGG genome); Triticum aestivum L. (AABBDD
genome); and Triticum zhukovskyi Menabde & Ericz. (AAAAGG genome) (Matsuoka, 2011).
Nowadays, the commercial wheat, tetraploid and hexaploid wheats, contain two and three homeologous genomes, respectively. These genomes are named A, B, D and G, according to the donor species, each of which consists of seven pairs of chromosomes numbered 1 to 7. In the hybridisation process, spontaneous crosses between wild species with different chromosomes have been followed by spontaneous doubling of chromosomes to originate a fertile allopolyploid.
Over the last 10,000 years, crop domestication has been the single most important human cultural development. Despite the independent domestication of the four major cereal complexes (maize in America; wheat, barley, oats and rye in the Near East; rice in Asia; sorghum and millet in Africa), the same sets of traits were searched. In the case of wheat domestication, the desired traits were non-brittle rachis, naked grain often associated to shorter dormancy, flowering time and grain size (Buckler et al., 2001; Charmet, 2011).
The first cultivation of wheat occurred about 10,000 years ago, as part of the ‘Neolithic Revolution’, which saw a transition from hunting and gathering of food to settled agriculture (Shewry, 2009). Tetraploid forms of current domesticated wheats are derived from a wild tetraploid progenitor, identified as the wild emmer Triticum
turgidum ssp. dicoccoides. This species has an allotetraploid genome (AABB) resulting
from spontaneous amphiploidization between the diploid wild wheat Triticum urartu (AA genome) and an unidentified diploid Aegilops species (BB genome) (Haudry et al., 2007) (Fig. 1). Today, the cultivated form of the durum wheat ( T. durum) is widely
grown in regions with relatively dry conditions as Mediterranean area, and consumed as pasta and semolina products (Matsuoka, 2011).
The hexaploid wheats originated some 6,000-7,000 years ago by natural hybridisation of tetraploid wheat, (AABB genome) with the diploid wild grass Aegilops squarrosa (DD) (T. tauschii) (Miller, 1987) (Fig. 2). The resulting hexaploid species T. aestivum (AABBDD), the common “bread wheat”, is the dominant species in world agriculture. The hexaploid wheat species T. zhukovskyi, whose genomic composition is AAAAGG, could have been originated recently by interspecific hybridization of cultivated tetraploid T. timopheevvii (AAGG) with the cultivated diploid T. monococcum (AA). Today, about 95% of the wheat crop is hexaploid (T. aestivum), whereas the remaining 5% is durum wheat. Compared with tetraploid wheat, T. aestivum has broader adaptability to different photoperiod and vernalization requirements; improved tolerance to salt, low pH, aluminum, and frost; better resistance to several pests and diseases; and extended potential to make different food products, as bread, cookies and pastries (Dubcovsky and Dvorak 2007).
Fig. 1: The evolutionary and genome relationships between cultivated bread and durum wheats and
Fig. 2: Critical reproductive and genetic events in the allopolyploid speciation of T. aestivum: T. turgidum–Ae. tauschii natural hybridization (yellow); normal growth of fertile triploid F1 hybrids (green);
and genetic and epigenetic changes in the allohexaploid genomes of F2 and later generations (red).Taken from Matsuoka, 2011 .
1.2
Wheat caryopsis: anatomy and composition
The wheat grain is botanically a single-seeded fruit, called “caryopsis” or “kernel”. It is a composite of different tissues, each with a unique temporal pattern of gene expression during grain fill. Technically, the mature grain is a caryopsis, with an outer testa closely appended to the seed. It develops within floral envelopes (the “lemma” and “palea”), which are actually modified leaves. At maturity, the wheat kernel averages ∼2.5-3.0 mm thick (or higher as it stands on its base), ∼3.0-3.5 mm wide, ∼6.0-7.0 mm in length, with an average weight of ∼30-40 mg. The seed is constituted by three distinct parts: the bran, the starchy endosperm and the embryo or germ (Fig 3). They account for 13-17%, 80-85% and 2-3% of the dry weight of the seed respectively. The embryo, aleurone, and pericarp plus testa are removed during milling, leaving the starchy endosperm as the principal contributor to white flour (Dupont and Altenbach 2003; Belderok, 2000). This mealy endosperm is composed of 82% carbohydrates (mainly starch), 13% proteins and 1.5% fats but a low content in minerals and dietary fibers.
The contents of minerals (ash) and of dietary fibres are low, 0.5% and 1.5%, respectively. More than half of the bran consists of fiber components (53%) and interestingly its mineral content is rather high (7.2%). The rather high level of proteins and carbohydrates in the bran is coming from the aleurone layer, the cells of which are filled with living protoplasts. Finally, the germ exhibits the more equilibrated composition with proteins, fats, carbohydrates and dietary fibres (Belderok, 2000).
Tab. 3: Chemical composition of wheat grain and its different parts (converted to percentage on a dry
matter basis). Taken from Belderok, 2000.
1.3
Wheat bran
The bran of the wheat grain is composed by a series of different cell layers. The “pericarp” (fruit coat) surrounds the entire seed and consists of two portions, the outer pericarp and the inner pericarp. The outer pericarp is composed by the epidermis (epicarp), the hypodermis, and by the innermost layer, called the remnants of thin-walled cells. The inner pericarp, adjacent to the remnants, is composed of intermediate cells (cross cells and tube cells). A further inner layer of cells is the seedcoat (also called “testa”) where the pigments confer the grain colors. Bran is particularly rich in dietary fiber and contains significant quantities of starch, protein, vitamins, and dietary minerals.
1.4
The embryo
The wheat germ makes up 2-3% of the kernel. It consists of two major parts, the embryonic axis and the scutellum, which functions as a storage organ. The germ is relativity high in protein (25%) carbohydrates (40%), oil and ash. It contains a rather high amount in B and E vitamins and contains many enzymes. No starch was found in this organ, the sugars are mainly sucrose and raffinose.
1.5
Endosperm development
The development of cereal endosperms has been largely investigated. The best known and most widely used scale for the recording of growth stages of cereals is probably the scale designed by Feekes (Large, 1954). The Feekes' scale is well suited to the small grain cereals in North West Europe, especially wheat, but it can also be applied to wheat, barley, rye, oats, and to in other parts of the world. But also the decimal code developed by Zadoks et al. (1974), Chang and Konzak has been widely recognized as the best scale available (Chang et al., 1974).
This subjective scale divide grain development into early, medium and late milk stages, and early, soft and hard dough stages (Fig. 4). The temporal pattern of grain development also can be described in terms of transition points in the accumulation of total dry matter, starch, protein, and water, in order to pinpoint times in grain development when changes in gene expression and protein accumulation are likely to occur (Fig. 5) (Dupont and Altenbach 2003).
Fig. 5: Temporal patterns in the accumulation of starch and protein on the basis of water content (►),
fresh weight (■) and dry weight (●) during the grain development. Proteins were measured by a nitrogen combustion analysis, starch was measured by a specific assay kit, and the onset of apoptosis was estimated by the analysis of fragmented genomic DNA. Plants grown under a 24°C/17°C day/night regimen. Taken from Dupont and Altenbach (2003).
The endosperm is the result of the fertilization of two polar nuclei in the central cell of the embryo sac by one sperm cell nucleus, which generates a triploid (3n, 3C) nucleus, whereas the diploid (2n, 2C) embryo originates from fertilization of the egg cell by the second sperm cell nucleus (Sabelli and Larkins 2009).
In the caseof endosperm, cell wall formation starts from the periphery on day 4 after pollination, via the formation of open-ended alveoli that grow towards the centre of the endosperm, and is completed by day 7. Cell divisions continue until 12–14 d post-anthesis (dpa). This so-called nuclear type of endosperm development, which is characterized by a limited or permanent phase of free-nuclear division, is found in cereals, as well in other plants (Wegel et al., 2005).
Following is a period of cell expansion in which water content increases and starch and protein reserves accumulate. The maximum amounts of starch and protein that accumulate in each grain depend on the number of endosperm cells, determined early in grain fill, and the final size of the cells, which is influenced by water uptake, cell-wall extensibility and rate and duration of grain fill (Dupont and Altenbach 2003).
The inner daughter cells of the formative division represent starchy endosperm cell initials. In wheat, the outermost endosperm cell layer differentiates as aleurone and the cells on the inside develop as starch- and protein-storing cells. The endosperm cell layers located adjacent to the nucellar projection are morphologically distinct, while the adjacent nucellar cells form a symplastic transport system and facilitate the transport of sucrose from the vascular system to the endosperm, where it is converted into starch. The starchy endosperm cells of maturing grains die, as a result of programmed cell death (Fábián et al., 2011).Finally, kernels desiccate rapidly, losing all but 10–15% of their water content, at which time they are ready for harvest.
Fig. 6: Phases in endosperm development. Although this figure refers to maize, it is a good example of
endosperm development in other grasses as well. A, Double fertilization, syncytium formation, and cellularization of the endosperm occur within 3 to 4 DAP. The pollen tube and sperm nuclei are shown in yellow, polar nuclei in the central cell of the female gametophyte and endosperm nuclei are shown in red, and the egg cell nucleus and embryo nuclei are shown in green. Outlines of the multicellular endosperm and embryo are drawn in red and green, respectively. B, The dynamics of key parameters during mid endosperm development, such as fresh weight (red line), nuclei number (blue line), mitotic index (brown line), and average DNA content (C value; green line), are shown at bottom. Taken from Sabelli and Larkins 2009.
1.6
Main components of wheat endosperm
1.6.1 Starch
Starch is a major storage product (Denyer et al., 2001). In addition to its use in a non-processed form, starch is non-processed in many different ways. Processed starch is subsequently used in multiple forms, for example in high-fructose syrup, as stabilizers and fat-replacements in the food industry It is also used for various technical processes based on the fact that, as a soluble macromolecule, it exhibits high viscosity and adhesive properties for example in glues, paper, textiles, pharmaceutical and biodegradable plastics.
1.6.1.1 Starch structure
Wheat starch is composed only of glucose units; the glucose units are linked α-1,4 to form linear chains and branches are formed through the connection of α-1,4 linked chains via α-1,6 linkages. Starch is generally described as containing two broad classes of molecules, amylose (AM) and amylopectin (AP), that differ in degree of polymerisation and branch frequency (Rahman et al., 2000).
In most common types of cereal endosperm starches, the relative weight percentages of amylose and amylopectin range between 72 and 82% amylopectin, and 18 and 33% amylose (Buléon et al., 1998).
1.6.1.2 Amylose and Amylopectin
Amylose is essentially a linear molecule, in which glucosyl monomers are joined via α-1,4 linkages and contributes about 30% of storage starches. Amylopectin, the more abundant polymer in starch (70% of storage starches), contains linear chains of various lengths (Smith et al., 1997). Approximately 5% of the glucosyl units in amylopectin are joined via α-1,6 linkages, which introduce chain branches. Amylopectin has a high degree of structural organization, as exemplified by the non-random distribution of linear chains and the clustered positioning of branch linkages. Regions of high-branch frequency alternate with regions that are devoid of branches, enabling intervening linear
chains to align in parallel arrays of double helices. This conserved architecture is responsible for the semi-crystalline nature of starch granules, which allows the dense packaging of glucose units. A higher-order organization in amylopectin gives rise to two types of crystalline structure, A-type and B-type, which differ with respect to the symmetry and packing of short amylopectin chains (James et al., 2003). Large type A granule, of 10-30 pm in diameter which are lenticular in shape, are initiated about 4-7 DPA, and smaller type B granules generally spherical (10 pm) appear around 10-12 DPA. Many of the physical and chemical properties of starch are determined by the relative amounts, size, chain length and branch frequency of these two types of polymer (Burton et al., 1995; Morell et al., 1995).
1.6.1.3 Starch biosynthesis
In plants, four enzymes control starch biosynthesis. Within the amyloplast, ADP-glucose pyrophosphorylase converts ADP-glucose-phosphate to ADP-ADP-glucose in the presence of ATP. ADP-glucose then is polymerized into α-1,4 linked chains by multiple isoforms of starch synthase. The first group of starch synthase contains granule-bound starch synthase (GBSS), and includes GBSSI and GBSSII. GBSSI is encoded by the Waxy locus in cereals, located on each of the wheat genomes, and functioning specifically to elongate amylose. It is found essentially within the granule matrix (one of the so-called granule-associated proteins). In Triticum aestivum these isoforms are encoded on chromosome 7 of genome A (Wx-Al), chromosome 4 of genome A (Wx-Bl), and chromosome 7 of genome D (Wx-Dl) (Graybosch, 1998). In durum wheat only Wx-Al and Wx-Bl are present. By cross-breeding of mutant lines that show one or more functional Wx genes, wheat genotypes with varying numbers of functional GBSSI isoforms can be obtained (in Lafiandra et al., 2010). Wheat genotypes can be classified as: wild-type (all three isoforms are present), one gene null (any one isoform lacking), two gene null (any two isoforms lacking), or three gene null (all three isoforms lacking). A drastic decrease of amylose content is observed in the complete three waxy-null line (Lafiandra et al., 2010).