Department of Business and Management Chair of International Finance
How Solvency II supports infrastructure investments:
A tighter connection between insurance companies and the real economy.
SUPERVISOR
Prof. Federico Merola
CANDIDATE
Mario Graziano
ID 673481
CO-SUPERVISOR
Prof. Alfio Torrisi
The significant problems we face cannot be solved at the same
level of thinking we were at when we created them
The herein dissertation deals with the regulatory, institutional and market-based initiatives taken at European level with the view of enhancing the access of insurance companies to infrastructure investments and of limiting the impact of the factors that are likely to prevent the demand and the supply for infrastructure assets to meet, with a specific referral to the European economy. Two sets of regulatory barriers are pointed out, namely technical and regulatory limits to long-term investments. For each of these, the main solutions proposed by the European Institutions, represented by the European Investment Bank and the European Commission, are scrutinized. The Juncker Plan, born with the objective of raising €315 billion of additional long-term investments in all European Member States, and the recent amendments to the insurance companies’ Solvency II prudential regulation to include the category of qualifying infrastructure debt and equity investments in the market risk module of the standard formula, are discussed in their essence of important and significantly effective steps that the European Union has taken toward the objective of closing its infrastructure gap. In addition, other smaller scale public and private initiatives are scrutinized, including the European Investment Bank’s Infrastructure Aggregation Platform (not yet launched), the International Finance Corporation’s Managed Co-Landing Portfolio Platform and the UBS Archmore Infrastructure Debt Platform. These initiatives share the goal of enabling small and medium-sized insurance companies to better and easier access high-quality low-risk infrastructure debt investments.
1
Table of Contents
Introduction ... 4
1.Infrastructure assets and socio-economic development ... 9
1.1 Definition of infrastructure... 10
1.1.1 Infrastructure megaprojects ... 12
1.1.2 Infrastructure in the World ... 14
1.1.3 Sustainable infrastructure and the UN 2030 Sustainable Development Goals ... 16
1.2 Infrastructure industrial sectors ... 19
1.2.1 Economic infrastructure and utilities ... 19
1.2.1.1 Transport infrastructure ... 20
1.2.1.2 Energy infrastructure ... 21
1.2.1.3 Water infrastructure ... 24
1.2.1.4 Waste management infrastructure ... 25
1.2.1.5 Telecommunications infrastructure ... 27
1.2.2 Social infrastructure ... 28
1.3 Competition regulation in infrastructure-based network industries ... 29
1.4 The infrastructure gap: where we are and where we need to go ... 33
1.5 The infrastructure gap in Europe... 36
1.5.1 Infrastructure can raise back the European economy ... 38
ANNEX A: The infrastructure gap: the case of United States ... 41
ANNEX B: Infrastructures and the WEF Global Competitiveness Index ... 42
2.Characteristics of infrastructure assets, vehicles and investors ... 45
2.1 Infrastructure as an asset class ... 46
2.2. Public and private investors in infrastructure assets ... 49
2.2.1 Private investors in infrastructure: a focus on institutional investors ... 52
2.3 Financing infrastructure ... 54
2.3.1 Infrastructure project finance ... 58
2.3.2 Infrastructure corporate finance ... 61
2.3.3 Market vehicles for infrastructure financing ... 62
2.4 Determinants of infrastructure assets risk-return profile ... 64
2.4.1 Sub-sector ... 65
2.4.2 Stage of development ... 68
2.4.2.1 Main risks borne by infrastructure investors ... 70
2.4.2.2 Pre-completion risks ... 70
2.4.2.3 Post-completion risks ... 71
2.4.2.4 Risks borne all along a project ... 73
2
2.4.4 Financial structure ... 84
2.4.5 Contractual arrangement ... 84
2.5 Benefits of investing in infrastructure assets ... 89
2.5.1 Provision of essential services ... 91
2.5.2 Market power and protection from competition... 92
2.5.3 Protection from inflation ... 92
2.5.4 Diversification benefits ... 95
2.5.4.1 How infrastructure investments behave when included in traditional portfolios ... 97
2.5.5 Attractive risk-adjusted returns... 99
2.5.5.1 The Dow Jones Brookfield Global Infrastructure Index ... 101
2.5.5.2 Performance of infrastructure debt ... 104
ANNEX C: Infrastructure and the ARCADIS’ Global Infrastructure Investment Index 2016 ... 106
3.Insurance companies’ infrastructure investments in the European environment ... 107
3.1 Insurance investors as an important source of infrastructure financing in Europe ... 108
3.2 Investment barriers ... 112
3.3 European initiatives for the support of private long-term investments ... 115
3.4 Types of regulatory limits to institutional investments... 120
3.4.1 Quantitative provisions ... 120
3.4.2 Qualitative provisions ... 122
3.4.3 Risk-based regulatory regimes ... 124
3.5 Solvency II ... 125
3.5.1 Pillar 1 – Quantitative requirements ... 131
3.5.1.1 The Solvency II standard formula ... 134
3.6 The treatment of infrastructure investments under Solvency II ... 137
3.6.1 The market risk module and the treatment of infrastructure investments ... 140
3.6.1.1 Interest rate risk and spread risk sub-modules ... 141
3.6.1.2 Equity risk submodule ... 148
3.6.1.3 Other risk sub-modules ... 150
3.7 Qualifying infrastructure investments under the Solvency II framework ... 151
3.8 Additional requirements for accessing the qualifying infrastructure status ... 158
3.8.1 Disclosure for qualifying infrastructure investments – The look-through approach ... 159
3.9 Institutional solutions for Solvency II compliance ... 161
3.9.1 EIB’s Infrastructure Aggregation Platform ... 161
3.9.2 IFC’s Managed Co-Lending Portfolio Program Infra ... 164
3.10 The UBS Archmore Infrastructure Debt Platform ... 166
3.10.1 Application of the Solvency II eligibility checklist to a parking facility ... 171
ANNEX D: Data about the utilization of EFSI funds from different European countries ... 174
3 Conclusions ... 176 Bibliography ... 183 Table of figures ... 187
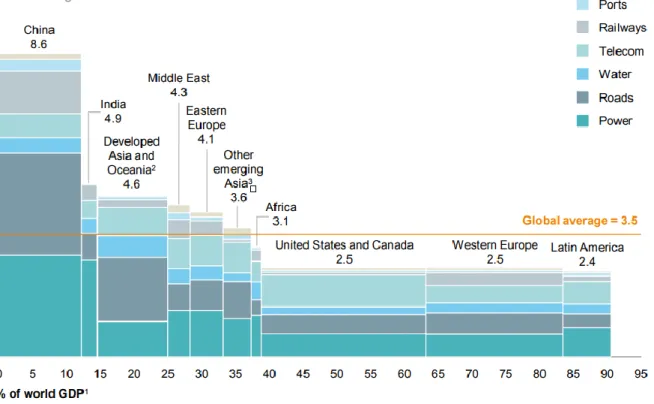
The World needs more of infrastructure. Most underdeveloped countries lack the facilities for the accommodation of basic human needs like the access to potable water, electricity, education and healthcare. On the other side, in most cases, advanced countries have accumulated significant backlogs in the maintenance and modernization of their old and obsolete infrastructure systems. Infrastructure works include roads, railway systems, waterways, gas pipelines, telephone lines, electricity transmission and distribution systems, hospitals, schools, prisons, public parks and other administrative buildings. In general, infrastructure is whatever long-lived capital-intensive asset enabling the provision of essential services to people and their communities. Infrastructure plays a crucial role in supporting the socio-economic growth in all of the World’s countries, as it enables the connections among people and cities, multiplying the occasions for socio-economic exchanges, improves input factors’ productivity, enhances the quality of people life and their life expectancy, creates employment. Demand for infrastructure investments to face the great challenges that the XXI century is bringing about, including the call for sustainable development, will be as sizeable as never in the history of humanity. The issue is constantly included in the agendas of global and European policymakers. According to the influential estimations of the McKinsey Global Institute, the World demand for the construction of new infrastructure facilities and for the upgrading of the existing works amounts to $3.300 billion a year until 2030, only to accommodate the projected growth of the global GDP. This translates in a global infrastructure investment gap of $1000 billion a year, of which the European economy faces roughly one third.
Traditionally, governments have represented the main source of infrastructure financing, given the important positive socio-economic effects and externalities that infrastructure works are likely to bring about. Nonetheless, developed countries’ governments have progressively withdrawn from the field, inaugurating a shift toward a financing model heavily relying on investments of private market players. This has depended on many factors, including the spreading belief that private investors would have been able to perform investments more efficiently and to better manage infrastructure facilities. More recently, concerns have also arisen about the sustainability of the extremely high levels of public indebtedness and high government deficits that have been characterizing several developed countries, especially European ones. The 2007-2008 financial crisis and the 2011 sovereign debt crisis have complicated things even more. Reduced tax revenues, recessions and the constraints imposed on European governments by the austerity policies have obliged governments to postpone important expenses until national balance sheets had appeared better.
Relevant changes have been occurring also within the private sector. In particular, during the last decade, also the flow of bank capital, which has traditionally represented the primary source of infrastructure debt financing, has been dwindling in consequence of the financial crises. The deleveraging process banks are going through and the contraction of the lending flow to the real economy, especially on a long-term basis, can be going to assume a structural nature, as a consequence of the entrance into validity of the new prudential framework Basel III.
As a partial solution to these issues, an important historical discontinuity is arising for what concerns the role and the investment function of institutional investors. Institutional investors are large players pooling money from several sources and directing it toward financial and real investments. Among them, a particular importance has to be given to life insurers and pension funds. These investors look for conservative income-generating long-term assets to match their long-term liabilities. In this moment, they are also struggling to find investments that can allow them higher yields with respect to traditional sovereign and investment-grade corporate bonds, in order to survive in the extremely low interest rate current environment. Hence, they have turned their attention toward alternative real assets, including infrastructure and SMEs investments.
Investment decisions are taken on the basis of three elements: expected return, risk appetite, desired cash profile. Given this premise, high-quality low-risk infrastructure asset may represent valuable investment opportunities for institutional investors. The assets in question are categorized as core infrastructure assets and consist of conservatively structured long-term income-generating assets, exhibiting no construction risks, limited post-completion risks (low market risk, low technological risk) and attractive risk-adjusted returns, if compared with traditional fixed-income instruments. Low-risk high-quality infrastructure assets are likely to provide investors with stable and predictable streams of inflation-linked cash flows, in the context of a regulated contractual framework. In addition, they have proven to be very resilient to the upturns and downturns of the economic cycle and to be weakly correlated with other asset classes, hence they are ideal in the pursuance of a desirable level of portfolio diversification.
The society as a whole, the underlying economic system and institutional investors can all take huge advantages if quantitatively and qualitatively adequate infrastructure investments are carried out. Provided that there is excess demand for infrastructure assets and significant unexpressed supply, it is important to identify the factors that prevent them to meet, and to design adequate solutions to limit their negative impact. In particular, it is essential to design an economic environment that does not prevent institutional investors from exploiting their long-term investment potential.
There is so much at a stake, here. Institutional investors globally manage thousands of billions of capital and even a minimum shift of their asset allocation strategy toward infrastructure investments is likely to translate in injections of several millions of new infrastructure financing. In Europe, insurance companies represent the main category of institutional investors. By 2015, the European insurance industry had almost €10.000 billion under management, of which only the 0,3% was invested in infrastructure assets.
The objective of this dissertation is hence to analyze the institutional, regulatory and market-based challenges and incentives that insurance companies find in the European environment when committing themselves to infrastructure investments. In the pursuance of this goal, particular importance will be attributed to the treatment of insurers’ infrastructure investments under the European prudential regulation Solvency II, determining risk-based capital and qualitative requirements for insurers on the basis of the investments they perform and of the way these investments interact with the structure of their balance sheets. In addition, the description of some institutional and market-based initiative, aimed at removing infrastructure investments obstacles for insurance companies and other institutional investors, will deserve an important focus along this treatise.
In the context of Chapter 1, infrastructure works are introduced, defined and described. Paragraph 1.1 draws a complete picture about what infrastructure is, what its characteristics are and to what extent it can contribute to the socio-economic development of countries. There, the status of infrastructure endowments in the World countries is represented and the double-way relationship between infrastructure and sustainable development is analyzed. Paragraph 1.2 lists and scrutinizes the network infrastructure-based industries, making a subdivision between economic and social infrastructure sectors. In the context of Paragraph 1.3, the competition regulation applying to network industries (and hence interesting infrastructure assets’ operators) is described. The global imbalance between demand and supply of infrastructure investments, representing a crucial element of this dissertation, is discussed and quantified in Paragraph 1.4, whereas the infrastructure gap in Europe is discussed in the subsequent Paragraph 1.5.
Chapter 2 provides a description of the asset class of infrastructure, including the determinants of infrastructure assets’ risk-return and cash profiles and the elements of interest for institutional investors. Paragraph 2.1 lays down the asset class’ basic characteristics, in absolute and as an asset class in the category of alternative asset classes. It describes its expected benefits and elements of concern, while stressing the heterogeneity of the assets therein encompassed. Paragraph 2.2 introduces the market participants that are likely to target infrastructure investments, making a distinction between public and private investors, as well as between institutional and strategic
investors, with a stronger focus on the formers. Paragraph 2.3 lists and scrutinizes the different types of financing instruments for infrastructure assets, namely project finance, corporate finance and market-based instruments. Paragraph 2.4 discusses the elements that contribute to the determination of infrastructure assets’ risk-return profile, including their industrial sector, geographical location, life stage, financial structure and contractual arrangement. Paragraph 2.5, instead, analyzes the expected benefits from investing in infrastructure, including low demand risk, protection of cash flows from inflation, low correlation with the economic cycle and with other asset classes, attractive risk-adjusted returns. Along the Paragraph in question, it is specified that the bulk of these positive features are a prerogative of core infrastructure assets, as opposed to opportunistic or value-added infrastructure investments. The expected return from these is considerably higher, and so is the risk taken, as most of the elements of stability characterizing core exposures are missing.
Chapter 3 hosts a treatise about the impact of the European environment on the investment choices of insurance companies, with referral to infrastructure investments. Paragraph 3.1 describes the European insurance sector as a potentially huge source of infrastructure financing and long-term investments in general. Paragraph 3.2 subdivides long-term investment barriers preventing insurance companies to fully exploit their investment potential in technical and regulatory constraints and offers a description of both. In response, Paragraph 3.3 describes some of the measures that have been taken by the main European Union institutions in an attempt to overcome long-term investment barriers, with a particular focus on the Juncker Plan and its results. In Paragraph 3.4, different types of regulatory provisions are listed and described to understand their possible impact of investors’ behaviors. Laid down the opportune premises, in Paragraph 3.5, the Solvency II prudential regulation is introduced and its main characteristics are analyzed. Along the Paragraph, the focus is progressively narrowed from the general features of the framework to its first Pillar (quantitative requirements) and the standard formula for the computation of the Solvency Capital Requirement, therein included. A description of the treatment of infrastructure investments according to Solvency II can be found in Paragraph 3.6, where each risk module of the standard formula is analyzed, together with its implications for the specific treatment of infrastructure investments. In Paragraph 3.7, the provisions included in Articles 164a and 164b of the EU Delegated Regulation 2015/35, as amended by the EU Delegated Regulations 2016/467 and 2017/1542, are thoroughly analyzed to understand what are the criteria imposed by the European regulator to make a distinction between “standard” infrastructure investments and infrastructure exposures that are eligible for a preferred treatment dedicated to qualifying equity and debt investments in infrastructure. Once qualifying infrastructure investments have been identified, Paragraph 3.8 describes the additional requirements that the European regulation imposes on insurance companies in order for them to actually access the favorable
treatment set up for qualifying infrastructure investments. In particular, the Solvency II look-through approach is introduced, namely the provision according to which insurance companies keep responsible for the compliance of each of their exposures independently from whether they are gained directly or indirectly. According to the approach in question, insurance companies have the encumbrance to gather enough data to demonstrate to their national supervisors the eligibility of their infrastructure investments for the facilitated treatment. Paragraphs 3.9 and 3.10, therefore, reports three examples of institutional or private initiatives taken in order to facilitate insurance companies in their effort to invest in Solvency II compliant infrastructure assets and getting the information required by the look-through approach.
Chapter 1
1.1 Definition of infrastructure 1.1.1 Infrastructure megaprojects 1.1.2 Infrastructure in the World 1.1.3 Sustainable infrastructure and the UN 2030 Sustainable Development Goals
1.2 Infrastructure industrial sectors 1.2.1 Economic infrastructure and utilities 1.2.1.1 Transport infrastructure 1.2.1.2 Energy infrastructure 1.2.1.3 Water infrastructure 1.2.1.4 Waste management infrastructure 1.2.1.5 Telecommunication infrastructure 1.2.2 Social infrastructure
1.3 Competition regulation in infrastructure-based network industries 1.4 The infrastructure gap: where we are and where we need to go
"You built a factory out there? Good for you. But I want to be clear: you moved your goods to market on the roads the rest of us paid for; you hired workers the rest of us paid to educate; you were safe in your factory because of police forces and fire forces that the rest of us paid for. You didn't have to worry that marauding bands would come and seize everything at your factory, and hire someone to protect against this, because of the work the rest of us did."—
Elizabeth Warren, 2011
1.1 Definition of infrastructure
Infrastructure is whatever facility, structure, network, system, plant, property, equipment, or physical assets emerging as vitally important, if not absolutely essential, to people having the capabilities to thrive as individuals and participate, among others, in social, economic, political, communal, familial roles – as a citizen, worker, friend, neighbor, family or household member, or customer or consumer – in ways critical to their own well-being and that of their society, and the material and other conditions which enable them to exercise those capabilities to the fullest.
It represents a critical enabler for people in the World to travel and move objects from a geographical place to another, communicate and share information from the distance and participate to all economic, social, communal, religious, household activities ennobling them as individuals and as active members of their communities. They make business creation, management and expansion possible and offer valuable contributions in terms of cost reduction and efficiency enhancing, with positive consequences on economic systems as a whole. Importantly, infrastructures are the means for people to ready access sufficient potable water and healthful food; a safe, comfortable, functional shelter; health-preserving and welfare improving medical systems. Last, infrastructure works and facilities are the essential structures providing citizens with protection from harm and other either humanly-induced or natural sources of danger; granting them the possibility to improve their knowledge, skills, capacities, expertise and experience; ensuring that they have access to enough sources of energy to engage in listed activities and enjoy related benefits. 1
The term “infrastructure” was first used during the XX century in the military, where it came to represent the buildings and permanent installations supporting the operations of military forces, but the underlying concept was already well known to civil engineers living many centuries before. Ancient Egyptians used to build systems of transportation and irrigation of canals and dams. Their pyramids, as well as Greeks’ and Romans’ roads and aqueducts, have survived until today to witness the greatness of those early civilities, whose development and hence glory, were indeed brought about by their acquired capability of providing themselves with state-of-the-art infrastructures.
Modern infrastructures include roads, tunnels and bridges; railway systems; ports, waterways and canals; airports, including air traffic towers; telephone lines and cellphone towers; dams and reservoirs; hurricane barriers, levees and pumping stations; electric power lines and connections; fire stations and related equipment; hospitals, clinics, emergency response systems; schools, libraries, universities and other educational and cultural buildings; law enforcement and prisons; sanitization and waste removal facilities; post offices and mail delivery systems; public parks and other administrative buildings. 2
Economic systems, today as in the past, make extensive use of infrastructure, especially when it comes to expand trade, attract foreign investments and implement global value chains spanning multiple countries. Once infrastructures have been identified as a mean to offer essential services enabling social development and spurring population well-being, it comes along that one of most important measure of state leaders’ achievements can be represented by the level and type of infrastructural development they engage in compared to the agitation of the people and the available resources.34
A qualitatively and quantitatively adequate stock of infrastructures represents a real necessity for growth. Infrastructure reduces costs, supports economic activity, increases factor productivity, strengthens capital durability and connects cities to national and international markets, hence widening the scope of consumption and production possibilities of economies. In addition, it boosts employment, both directly (for building and maintenance) and indirectly (thanks to the vitality it impresses to economic systems). Infrastructure is also an important mean for social development and other important achievements, as it increases intra- and inter-regional trade, reduces poverty, increases both demand and supply for healthcare and education, improves human relationships.56 On
the other side, inadequate infrastructure slows and even reverses economic growth, driving unemployment, crime, and urban decay. It can fuel urban tensions by widening divisions among ethnic or income groups or between long-time residents and recent immigrants. Infrastructure gaps can foster a general malaise that drains a city’s vitality and spirit. 7
2 ThoughtCo – Craven, Jackie – “The importance of infrastructure” – March 2017 3 Global TrendLab 2015 – “Overcoming the infrastructure gap” - 2015
4 Oyedele, Olufemi Adedamola – “The challenge of infrastructure development in democratic governance” – May 2012 5 The World Bank – Woetzel, Jonhatan; Pohl, Herbert – “Infrastructure – Doing More With Less” – May 2014
6 Fay, Marianne; Toman, Michael – “Infrastructure and sustainable development” – June 2010
7 KPMG International – Chism, Nick - “Bridging the Global Infrastructure Gap: Views from the Executive Suite” – January
1.1.1 Infrastructure megaprojects
Major infrastructure works whose initial value supersedes one billion dollars are called “megaprojects”. Megaprojects are crucial for the future of cities, states and individual livelihoods and have the power to be economically transformative and strategically essential. Having them built is all but an easy matter and often projects run out of time and/or budget. Nonetheless, their potential benefits often make it worth the effort. 8 Analyzing the economics of megaprojects is out from the scope of this
dissertation, but some examples can be used to describe certain of their characteristics that can be generalized to all infrastructure works.
The Chinese Great Wall is one of the Seven World Wonders and represents, without any doubt, the infrastructure megaproject for excellence. It is the longest wall around the World with its more than 21.000 kilometers of length and was built 2300 years ago to protect China from
Mongolians’ assaults and to preserve the Silk Road trade. Indeed, in the past, the use of infrastructure works to define and strengthen national boundaries and identity was not rare. Actually, rather than a simple wall, it consists of an integrated defensive system with watchtowers, fortresses and beacon towers. It embodies most of typical characteristics of megaprojects: long physical life, high capital intensity, massive deployment of raw materials and labor. Today more than 30% of the original structure has disappeared due to natural and human damages but it is still one of the most important human works, attracting 70.000 visitors per day.9
8 McKinsey&Co – Garemo, Nicklas; Matzinger, Stefan; Palter, Robert – “Megaprojects: the good, the bad and the better” –
July 2015
The Panama Canal is one of the most renowned megaprojects of the modernity. It is an 81 kilometers long artificial canal connecting the Atlantic to the Pacific through the Panama Isthmus and allowing ships to go from one side to another of the American continent in four-to-five hours, instead of circumnavigating Southern America.10 It accounts for a significant share of the
country’s GDP and has recently undergone a seven-years expansion process concluded in June 2016. The expansion project has involved 20.000 people and huge quantities of steel and concrete. While the value of goods in transit through the channel was of around $270 billion per annum until 2016, that value may be growing threefold in upcoming years, in force of the recent intervention. This is likely to bring $5 billion of revenues each year for the Autoridad del Canal de Panama (ACP), the public operator of the canal. Besides positively affecting the Panama economy and stimulate huge increases in trade flows, the new Canal is also likely to foster international and national investment in port facilities, ships and waterways.
The California high-speed rail is an 837 km long railway meant to enable high-speed bullet trains to travel from Los Angeles’ Union Station to San Francisco’s Transbay Terminal (along a route providing up to 24 stops) in less than three hours, giving to travelers a concrete alternative to their own cars and short-distance flights. It has taken around twenty years to design it and get necessary approvals
and it is expected to be ready by 2029, after around 14 years of works. Its $64 billion value makes it one of most expensive United States’ megaprojects ever and problems arising in the construction phase are not few, including political challenges from the Trump administration. 11
10 Nautica Report – “Il canale di Panama” – January 2017
Infrastructure reveal indispensable when it comes to minimize negative effects associated to natural disasters, as they enable fast delivery of emergency supplies and medical care. On the other hand, poorly maintained infrastructure can lead to devastating losses of life and property. 2 The Italian Vajont
dam sadly represents an example of the devastating effects that may derive from bad infrastructure planning. It took three years to build, from 1957 to 1960: three years to rise up the a “portentous example of the Italian engineering”. At the time, it was the highest double-bow dam in the World, with its 260 meters of height. The dam was expected to bring eulogy and prosperity. Hundreds of local people found a job in the building site. It was actually an engineering masterpiece built in the wrong place, namely beneath an unstable mountain (the Toc mountain). Indeed, on October 9th 1963, it was hit by a terrible landslide, five times bigger that what
the dam could have withstand. The huge volume of rocks and debris that fell in the water caused a series on abnormal waves which flooded the surrounding area, killing almost 2000 people and causing damages for the equivalent of billions of euros.12
1.1.2 Infrastructure in the World
Modern economies cannot properly work and develop if they are not supported by an adequate endowment of infrastructure. Differences of World countries under this aspect are remarkable and appear consistent with their stage of economic development and social welfare. Causality runs both ways between income and infrastructure. Indeed, most infrastructure services are
both consumption and intermediate goods. For example, demand for electricity, telephones and cars increase in consequence of increases in disposable income.13 If a country succeeds in providing itself
with a critical endowment of infrastructures, it will be likely to have enough raw material, skilled workers and financial resources to build new infrastructure providing further benefits.
12 Corriere delle Alpi – “Vajont 1963-2013”
13 Fay, Marianne; Toman, Michael – “Infrastructure and sustainable development” – June 2010
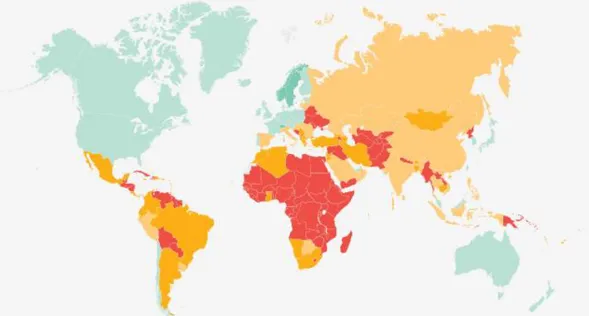
The following chart provides a graphical representation of all countries’ 2011 per capita stock of infrastructure
Figure 1.2 – Map of World countries' per-capita endowment of infrastructure Source: International Monerary Fund
2011 data
From the observation of the above chart, World countries can be divided in:
Best performers (> $ 35.000 per capita): Japan, Saudi Arabia, United Arab Emirates and Norway;
Good performers (> $ 20.000 per capita; <$ 35.000 per capita): Most OECD countries, including USA, Canada, Ireland, continental Europe, together with Iran, Venezuela, Malaysia and few others;
Moderate performers (> $ 9.000 per capita; < $ 20.000 per capita): Russia, Mongolia, China, Australia, Mexico, United Kingdom, Ecuador, Uruguay, Algeria and some others;
Poor performers (< $ 5.000 per capita; < $ 9.000 per capita): Kazakhstan, Ukraine, Brazil, Argentina, South Africa, Zambia and few others;
Very poor performers (< $ 4.000; > $ 2.500): India, Egypt, Morocco, Peru, Bolivia, Paraguay and few others;
Almost completely unequipped countries (< $ 2.500): Pakistan, Turkmenistan, Philippines and most African countries, including Niger, Mali, Chad, Sudan, Rwanda, Ethiopia, Somalia and others.As a complement to the above figure, the following chart represents the recorded relationship between countries GDP per capita and the quality of their infrastructure systems, represented by the value scored for infrastructure quality in the World Economic Forum’s Global Competitiveness Index (See ANNEX B). The consistency of results with respect to the previous chart does not come unexpected, given that part of the quality of an infrastructure endowment is determined by whether it is quantitatively adequate or not, but it confirms the correlation between economic development and infrastructure development. It also reveals that countries showing the same levels of GDP per capita sometimes exhibit different levels of performance for what concerns the quality of their infrastructure system.
Figure 1.3 – How the quality of infrastructure systems relates to the level of countries’ GDP Source: McKinsey Global Institute 2013
To make sure that a country’s infrastructure system concretely supports its economy, its management needs to be oriented toward efficience, bottlenecks to be closed and receptiveness of the economic system to infrastructure-induced positive effects to be improved by creating an active and stable social, politic and economic environment. Differences under these aspects are likely to explain why equally rich countries perform differently in providing themselves with enough valuable infrastructure facilities.
1.1.3 Sustainable infrastructure and the UN 2030 Sustainable Development Goals
Infrastructure and sustainable development share the goal to meet the current needs of the society without hampering future generations’ possibility to satisfy their exigencies. In the modern World, it is hard to imagine how they could exist without each other. Infrastructure works can be said to be both sustainability maker and sustainability taker, meaning that, on one side, they represent a precious instrument to pursue sustainable development objectives, while on the other, they have to withstand
new Environmental, Social and Governance challenges, imposed by markets, governments and the surrounding environment, from which they can derive both precious opportunities and dangerous threats. Sustainable infrastructure works have to be intended as sustainable under the social, economic and environmental points of view. Socially sustainable infrastructures are inclusive and respect human rights. They are expected to meet the need of the poor by increasing access, supporting poverty reduction and reducing vulnerability to climate change. Economically sustainable infrastructure provides job and boosts GDP. It does not burden governments with unpayable debt or users with excessive charges. It also seeks to strengthen capabilities of local suppliers and developers. Environmentally sustainable infrastructure mitigates carbon emissions during construction and operation and contributes to the transfer to a low carbon economy. It is resilient to climate change risks and also addresses local environmental challenges, especially the assurance of water supply and quality of air. Sustainable infrastructure can also employ different ways of meeting infrastructure service needs, such as demand-side managements systems and responsive power grids. 14
United Nations 2030 Sustainable Development Goals represent an excellent benchmark to assess the potential positive effects of infrastructure works for economies and societies. These are a set of goals adopted by United Nations in September 2015, with the view to end poverty, protect the planet and ensure prosperity for all. Each goal is subdivided in a set of specific targets to be achieved from 2015 to 2030. 15 As critical providers of direct and indirect social, economic and environmental
benefits, infrastructures can contribute to a different extent to the achievement of all these goals, besides being explicitly taken as the object of goal 9 (Industry, Innovation and Infrastructure).
Figure 1.4 – The United Nations 2030 Sustainable Goals
14 McKinsey Global Infrastructure Initiative – Bielenberg, Aaron; Kerlin, Mike; Oppenheim, Jeremy; Roberts, Melissa -
“Voices on Infrastructure – Novel Solutions -> Financing Change: How to mobilize private sector financing for sustainable
infrastructure” – March 2016
First of all, by definition, infrastructure includes both traditional and renewable energy producing facilities (goal 7); hospital, clinics, medical centers (goal 3); tribunals, jails and police stations (goal 16). It is clear how these goals cannot be pursued if not through suitable institutions supported by adequate infrastructure systems.
Infrastructure sustains growth, employment and competitiveness (goal 8), enhancing both the short-term aggregate demand and the long-term productivity, hence resulting in higher income. According to a study of the International Monetary Fund on a sample of developed economies, devoting an additional 1% of GDP to infrastructure investing can make them earn an additional 1.4% of GDP in the same year and an additional 1.5% for each of the four subsequent years. Standard and Poor’s estimates that the infrastructure investment multiplier on GDP is 1.4 for Italy, 2.5 for USA and 1.7 for UK.16 According to McKinsey Global Institute, instead, in the long run, investments in
infrastructures may have a socioeconomic return of 20%, thanks to boosted productivity, while some well-chosen works may show a cost-benefit ratio up to 1:20.17 About employment, infrastructure has
remarkable cross-industry spin-offs and hence creates jobs both directly and indirectly. The International Labor Organization has estimated that each billion dollar spent in developed countries on infrastructure can create up to 28.000 new jobs. According to the US Department of Transportation, for example, one billion dollar invested in federal highway and traffic scheme can create 13.000 jobs for one year, including jobs directly required by the projects and jobs created by increased demand for raw materials.18
Infrastructure favors social progress, education (goal 4), equal opportunities (goals 5 and 10) and welfare, as it grants access to basic social services which improve literacy and provide better life opportunities also for the poorest share of the population. A recent US-based study19 has shown a
negative correlation between investments in infrastructures and income inequality, observing a 0.003 reduction of the Gini coefficient of a country, on average, for each 7% increase on the public expense allocated to infrastructure, ceteris paribus. The study has compared, for each US state, the value of the Gini coefficient in different moments and the flow of investments in mobility and educational infrastructure during the previous ten years, along the 1950-2010 period. Said negative correlation has emerged to be even stronger for the 40% lowest income population. If this is true, an adequate infrastructure stock can even help to reduce social plagues arising from income inequality, like
16 Laboratorio Infrastrutture Bocconi-Autostrade per l’Italia – “Tavola Rotonda: Infrastrutture per la competitività: selezione,
risorse, regole” – January 2015
17 McKinsey Global Institute in collaboration with McKinsey’s Capital Projects and Infrastructure Practice– Woetzel,
Jonathan; Garemo, Nicklas; Mischke, Jan; Hjerpe, Martin; Palter, Robert - “Bridging Global Infrastructure Gap” – June 2016
18 Chatham House Report – Subacchi, Paola; Pickford, Stephen; Tentori, Davide; Huang, Helena – “Building Growth in
Europe: Innovative Financing for Infrastructure” – September 2014
19 Hooper, Emma; Peters, Sanjay; Pintus, Patrick A. – “To what extent can long-term infrastructure reduce inequality?” –
criminality and political apathy. In addition, the desirable effect of infrastructure investments on social inequalities can be expected to be much stronger in underdeveloped countries.
Goal 9 is about clean water and sanitization. Currently, in the World, one person out of nine has no access to safe potable water while 2,5 billion people have no access to proper sanitization. As a result, around 840.000 people die every year for consequences related to drinking dirty water or to unsafe wastewater management, which are in turn the cause of most illnesses in emerging countries. Building wells, pipes, depuration facilities and sewage pipes is the only way (necessary but not sufficient) to prevent water crisis in the World.20
Infrastructure can play a relevant role also in reducing poverty and hanger (goals 1 and 2). As much as 40% of food produced in Africa perishes before achieving markets where it should be sold, with terrible consequences for the already critical level of starvation concerning African countries. 21
Good roads would fix most of the problem, above all if coupled with an adequate and constant water supply.
The so called “green infrastructure” offer direct support to environmental protection (goal 13). It is the case of renewable energy producing plants, including solar power plants and wind farms. Infrastructure also provide indirect support to environmental protection. When plentiful high-quality infrastructures are there, citizens are incentivized to opt for environment friendly solutions, like choosing public means of transport rather than individual means of transport or using trains rather than private cars and airplanes, for middle distances (goal 12). Further, new or updated roads reduce congestion and related toxic emissions.
1.2 Infrastructure industrial sectors
Infrastructures support several business activities that could not be otherwise performed, and are hence essential assets in some network industries. A distinction can be made between economic and social infrastructure, according to the type of service they assist in supplying. The two categories tend to behave differently under several points of view, including the degree of public involvement and the risk borne by the infrastructure operator.
1.2.1 Economic infrastructure and utilities
Generally speaking, economic infrastructure and utilities are potentially self-sustaining businesses, under the financial point of view. In recent decades, they have seen an increasing commitment of the private sector for what concerns ownership, funding and operations. Utilities supply public essential
20 Weber, Barbara; Staub-Bisang, Miriam; Alfen, Hans Wilhelm – “Infrastructure as an Asset Class - Investment Strategy,
Sustainability, Project Finance and PPP” – II edition – Wiley - 2016
services including the provision of electricity, water and natural gas. The essentiality of supplied services induces strong dependence from both household and industrial consumers, so utilities tend to be price-regulated (see Paragraph 1.3). On the other side, they are often granted several forms of governmental support, including long-term concessions and inflation indexing of charged rates. Economic infrastructure works provide crucial services as well, but related sectors tend to work on competitive dynamics, so that the related demand is more sensitive to the short-term economic fluctuations. Economic infrastructures are mainly employed in the telecommunication and transport sectors. 2223
Figure 1.5 – Overview of economic infrastructure industries
Source: Weber, Barbara; Staub-Bisang, Miriam; Alfen, Hans Wilhelm – “Infrastructure as an Asset Class - Investment Strategy, Sustainability, Project Finance and PPP” – II edition – Wiley – 2016
1.2.1.1 Transport infrastructure
Transport and traffic infrastructure works include all the interdependent networks and facilities enabling people and goods to move from a place to another, within or outside from the starting region, country or continent. Transport can be performed by land, water, air or a combination of these (multimodal), and main transport infrastructure works include railways, road systems, highways, underground stations, canals, ports, airports, tunnels. In a not so far future, we will probably be able to include outer space transport infrastructures in the list.
Demand for transport services is high and growing and a critical level of transport infrastructure is one of the most noticeable achievements determining the development of a country. Interventions on transport infrastructure works are usually determined by political resolutions through long-term
22 Morgan Stanley Investment Management – Bigman, Ted; King, Matt – “Teorema di un’asset class strategica: I titoli
infrastrutturali quotati nei listini globali” – January 2016
23 Weber, Barbara; Staub-Bisang, Miriam; Alfen, Hans Wilhelm – “Infrastructure as an Asset Class - Investment Strategy,
master plans regarding the whole sector. Usually a transport ministry exists at central government level, who may be supported by additional governmental, semi-governmental or private agencies. The operators of transport infrastructures usually perform the underlying service on the basis of a long-term concession awarded by the government and enjoy related cash flows until its expiration. Cash flows arise mainly from patronage fees but some forms of governmental support can still be present somewhere. Indeed, while land and air transport are generally self-sustaining, transportation through railway is often a loss-making activity and needs to be subsidized. Customers pay for transport services either directly or indirectly. Direct contributions occur when consumers pay for a specific transport service (e.g. highway tolls, trains’ and airplanes’ tickets), while indirect contributions take the form of payments issued for ancillary goods or services (e.g. fuel, airport services).
The transport industry tends to be relatively pro-cyclical, with respect to other network industries, as it is continuously exposed to exchange and commerce and gets life from them. The degree of competition in related markets is potentially high, despite some sub-sectors behave like natural monopolies. When possible, the regulator has imposed unbundling to foster competition. 24
Transport systems are responsible for much of the pollution and consumption of dwindling natural resources, hence it is interested by a significant set of environmental rules.
There is a strong link between the transport industry and other important infrastructure-based industries, as the former is a massive user of energy and relies on communication technologies for the provision of transportation services. 222325
1.2.1.2 Energy infrastructure
Today energy is indispensable to almost all human activities, including business operations. Main sources of energy include gas, oil, coal, nuclear and various forms of renewables. Fossil fuels are still responsible for the production of 87% of World’s energy and nuclear plants cover another 7%. In the category of energy infrastructure, besides nuclear plants themselves, there are either long or short-distance pipelines and grids; petrol, gas and gas derivatives collection plants; storage systems, extraction systems and many others. Several energy infrastructures, including extraction wells and long-distance transmission facilities, are particularly capital intensive and carry remarkable sunk costs. Energy is demanded by both households and firms. Industries cover half of the World’s demand while the other half is subdivided among households, transport systems and commercial entities, as shown in the following graph, reporting data from 2011. Remarkably, demand for energy has increased by 60% from 1988 to 2014, showing an annual compounded growth rate of 2,5% over a 25-year period.
24 Unbundling occurs when the owner of an infrastructure is forced by the regulator to allow its competitors to use it in
exchange for the payment of a usage fee.
Providing citizens with a wide range of energy-related goods or services coming from several sources is one of main objectives of governments.
As several sources of energy exist, the energy industry is composed by diverse sub-industries, each one characterized by a proper set of standards, technologies, inputs and outputs, regulation and infrastructure systems. Generally, each sector tends to rely on long-term contracts and to be regulated, while the exposure to raw materials’ prices oscillations varies from sub-sector to sub-sub-sector.
Electricity and gas are the main products of the energy industry. Electricity represents around 15% of global energy consumption and its usage is expected to experience a 75% increase from 2011 to 2030. The increase in demand is coming mainly from developing countries, above all China, while OECD countries are showing a stagnating demand over the same period.
Electricity is produced through other forms of energy, like heat or kinetic energy and its sources are used according to a least-costly-first criterion. Fossil fuels are responsible for 68% of the global production of electricity, hydropower for 16%, nuclear for 11%. Renewable sources, including hydropower, wind, photovoltaic, concentrated solar power, geothermal and ocean, still account for only 21% of total production (2013) but their weight over the energy sources’ mix is expected to soar until covering half of the added capacity until 2050. Once electricity is produced from a primary source of energy, it is sold to energy distributors and conveyed towards its markets by Transmission System Operators through high-voltage grids that may cover interregional or international routes. After transmission, electricity is delivered to end users via both medium-voltage and low-voltage last-mile grids, according to retail contracts between end users themselves and retail distributors competing among each other. The supply-chain is still based on centralized power plants, unilateral transmission and distribution networks and reduced energy storability. Nonetheless, major changes occurring today may induce a progressive shift through an alternative model. In the future, each household or driver may be producing and selling electricity on an active market where prices fluctuate according to the interaction of demand and supply.
Figure 1.6 – Composition of the World demand for electricity Source: Weber, Barbara; Staub-Bisang, Miriam; Alfen, Hans Wilhelm – “Infrastructure as an Asset Class - Investment Strategy,
Sustainability, Project Finance and PPP” – II edition – Wiley – 2016 2011 data
The electricity industry is characterized by strong natural monopoly elements, including a very inelastic demand, finite capacity and high entry barriers, hence national regulators have intervened to open the market and impose unbundling to network owners. The business is also characterized by a foreseeable cyclicality. Peak and off-peak moments alternate in the course of the days and of the year.
Gas represents both a final product of the energy industry and a source of other forms of energy. It is a highly substitutable commodity-like good whose demand is cyclical, showing peaks during cold periods of the year (final users mostly use gas for heating) and with high temperatures (peaks of gas consumption are associated to peaks of electricity consumption). The gas supply chain is supported by several infrastructure facilities including wells, storage facilities, pipelines, distribution mains. In 2014, natural gas covered 21% of global energy demand and was the third global source of energy, after coal and oil. In particular, demand for gas equals each year around 70% of demand for oil and arises mainly from USA, Europe and Russia. Gas consumption is expected to grow by a 2,8% compounded annual rate until 2030 because of increased power generation requirements but the European demand is experiencing no more than a slight increase.
Gas is extracted from natural wells or oil reservoirs and is usually processed in the proximity of the well to fulfil purity standards. Then, as it occurs for electricity, it is transmitted through high-pressure pipelines to retail sellers and distributed to end-users via low-high-pressure pipes. Given that transmission is generally performed through pipelines (68%), it can also be substituted by sea shipment of liquefied gas, although this is not a cost-effective choice. Storage is an important stage of the gas supply chain and differentiates it from the electricity supply chain, where it is still a marginal activity. Storage is performed underground in caverns, depleted reservoirs and aqueducts and allows to smooth price volatility, buffer supply and demand swings and keep an adequate supply always secure.222325
As partly aforementioned, the most forecastable trend interesting the energy industry is the shift toward a model of production and consumption heavily relying on renewable sources of energy. Indeed, fossil fuels are on the path of depletion, they have volatile prices and are often located in politically troubled countries. In addition, public awareness about environmental consequences of the massive use of polluting sources of energy is increasing and there is agitation for the actual use of alternative sources.26 As a response to this, by 2017, half of all infrastructure deals undertaken globally
have been concerned the sub-sector of renewable energy, similarly to what has occurred in the previous years and consistently with a trend that has led to a 9% increase of the average yearly number of renewable energy infrastructure deals over last ten years.27
26 Quercus–Renewable Energy – “Investimenti infrastrutturali: una asset class attraente per I fondi pensione” 27 Prequin – “2017 Infrastructure Deals“ – January 2018
1.2.1.3 Water infrastructure
Water is essential to human life, economic activities, health protection and wellness. Important infrastructures supporting this sector are wells, treatment plants, pipes, sewage plants, storage facilities, cisterns. Demand for water is expected to be growing by 50% during next ten years. Its 2014 composition is shown in the pie chart below.
The water supply chain takes its steps from the natural cycle of water precipitation and evaporation. Water is collected from lakes, rivers, springs, wells and groundwater sources and is channeled towards treatment plants where it is chemically treated according to its purpose. Than it is conveyed through final markets, where it is sold to customers and distributed through pumps. Once water has been used, it is handed back to the system in the form of wastewater and is brought by separate pipes to sewage plants, where it is physically, biologically and chemically treated before reusing it or discharging it into the sea.
This sector shows all the features that characterize a natural monopoly. Initial sunk costs are extraordinarily high in comparison with other infrastructure-based businesses and the combination between the regional coverage of distribution plants and decreasing marginal costs create high entry barriers. Therefore, the water industry is generally heavily regulated, especially on the basis of its inner essentiality for human life. Regulation aims at imposing universal service obligation, promoting efficiency and innovation and ensuring the stability of the service. Regulation may involve typical micro-economic regulatory tools like price-caps and rate-of-return regulation or self-regulation systems imposed by awarding multiannual concessions through tendering processes. Alternatively, the public sector can ensure consumers’ welfare maximization through full or partial ownership of water utilities. Regulation is defined at national level but governance of water utilities has traditionally occurred at municipal level with some financial assistance from the central government.
Today, in the World many people have no access to clean water or suffer from illness related to scarce sanitization. By 2025, two thirds of the World’s population are expected to be suffering from stress water conditions. This issue concerns especially underdeveloped countries, which are needing stunning investments to meet any standard of sufficiency, as some of them lack most basic infrastructures to ensure water provision. The estimated amount needed to close the “water gap” ranges from $200 billion to $1000 billion a year. This amount should also be deployed to enable countries to renovate old systems which cause every year the loss of astonishing quantities of water that could be otherwise used.
The percentage of leakage ranges from a modest 7% of Germany to an unacceptable 29% in Italy. 2223
25
Figure 1.7 – Composition of the World demand for water Source: Weber, Barbara; Staub-Bisang, Miriam; Alfen, Hans Wilhelm – “Infrastructure as an Asset Class - Investment Strategy, Sustainability, Project Finance and PPP” – II edition – Wiley – 2016
2014 data
1.2.1.4 Waste management infrastructure
Broadly speaking, waste is whatever object, substance, residue or leftover that anyone wants to get rid of. It can be defined as a good that has given away its utility and has been expelled from the process of production or consumption. Solid waste (as opposed to wastewater and industrial liquid collateral products) is produced by industries, mining, construction and municipalities. Municipal waste comes from households, commercials and municipal services. In Europe, production of solid waste has increased from 60 kilograms per person in 1950 to 480 kilograms per person today, meaning an overall yearly quantity of 2,5 billion tons.
Infrastructure works enabling waste management are above all transfer plants, landfills and treatment plants. Their investment cost is relatively low. The waste management supply chain can be divided in two macro-activities: collection and treatment. Collection involves separation, gathering and first transport of waste. The treatment of waste differs according to the nature of waste itself and is performed in specific treatment plants to minimize the environmental impact.
As for electricity, water and communication, the waste sector has traditionally been run by public entities, at municipal or regional level, until 1990s, when several sectors were privatized and liberalized to different extents. The collection phase is often characterized by sizeable economies of density, depending on the number of withdrawal points in any given area. Economies of density significantly lower the marginal cost of gathering waste and progressively rule out the economic feasibility of in-the-market competition. Therefore, while competition may be in place for industrial and commercial users, companies performing waste gathering for households usually face for-the-market competition. This is consistent with low incumbents’ for-the-market power, low sunk costs, an easily assessable quality of the service and low information asymmetries. This is not the case of the disposal and treatment activities, instead, where sizeable sunk costs are faced by incumbents. They often enjoy economies of scope when several categories of waste can be processed in the same plants and may face in-the-market competition although the sub-sector shows higher entry barriers. Revenues enjoyed
by waste management operators arise from both final users and governments’ payments. Price schemes can be either single-tire or multi-tire and vary substantially among countries.
Waste management and disposal is an important service involving several environmental and ethical considerations. Conceptually speaking, the existence of waste itself may be seen as the result of an inefficient process involving a double cost, namely the cost of producing and the cost of disposing. Landfills are often overexploited and sometimes they lack protection systems to avoid that polluting substances achieve groundwater and hence humans and animals. Moreover, the main way to get rid of waste is burning it. This cause polluting and carcinogenic gases like dioxin to spread in the air.
Some specific categories of waste can be used to produce electricity by exploiting the energy resulting from the burning process. This occurs in the context of the so-called thermo-valorization process. Waste that can participate as an input of this process are plastics and other petrol derivatives, purposely chemically and physically treated. Other categories of waste that could contribute to energy generation is organic waste, whose controlled degradation can be used to produce biogas. The diffusion of this kind of practices may help in reducing pollution and provide new more sustainable sources of energy. Hopefully, in the future, the quantity of waste that will be converted into energy and raw materials or reused will represent a big portion of the total waste produced.
Developing countries are pursuing the goal to minimize waste environmental impact by minimizing the quantity of waste that is actually produced. This goal is embodied in a globally agreed on hierarchy of activities, identifying preferred treatments for waste and treatments to be pursued on a residual basis. The hierarchy has the goal to reduce waste, at first, and then reducing the environmental impact of the (hopefully reduced) waste that is still produced. The hierarchy has been adopted in Europe since 1980, together with the precautionary principle, the polluter pays principle and the cooperative principle. The interaction of these principles puts the responsibility for the negative effects that a product may have for the environment during its whole life and its disposal on the producer, who is required to minimize impact in conjunction with all involved subjects, including but not limited to customers, governments, distributors.
Figure 1.8 – Waste management hierarchy
Source: Weber, Barbara; Staub-Bisang, Miriam; Alfen, Hans Wilhelm – “Infrastructure as an Asset Class - Investment Strategy, Sustainability, Project Finance and PPP” – II edition – Wiley – 2016
Also the waste management sector is concerned by a gap between demand and supply. The urban rate of waste collection still ranges from only 10 to 40% in poorest countries and around 85% in developing ones.2328
1.2.1.5 Telecommunications infrastructure
Communication is the transfer of information from a source to a recipient according to an established connection. Telecommunication is communication performed through cables, radio of whatever optic or electromagnetic system. A telecommunication system allows several terminals (phones, mobiles, computers and other devices) to communicate with each other thanks to network systems including intermediating nodes.29 The telecommunication industry offers a wide range of services to businesses
and consumers and is gaining growing importance because of the advent of the so-called digital revolution. People can now have constant access to a virtually unlimited flow of data and information and get in contact with each other at any moment and from any place in the World. A situation like this would have been unthinkable a few decades ago. During last ten years, fixed and mobile networks’ subscriptions have soared in almost all World countries and broadband networks have remarkably spread. Currently, more than five billion people own one or more SIM cards.
The telecommunication sector is supported by capital-intensive essential infrastructures, including wirelines, towers, wireless technologies, broadband networks. Network quality is an important element of discrimination among service providers. The inclusion of the sector within the category of listed infrastructure industries is anyway not unanimously recognized, given that the industry works according to traditional competitive dynamics among (usually few) market players, which put in place strategic behaviors and marketing strategies to create their own identity, retain customers and increase their customer base. Customers’ experience management takes on average 68% of telecom companies executives’ efforts. The sector is completely self-sustained and the public intervention emerges only in its role of regulator. Regulation is aimed at ensuring universal service obligation and unbundling, so that any operator willing to enter the market can rent the use of incumbents’ networks. One of the most important principles imposed to telecommunication operators is net neutrality, providing that information must circulate democratically on the internet without any manipulation or paid premium treatment.
Infrastructure widening and upgrade is an important necessity of telecom companies’ managers. Breakneck changes having interested the industry during last decades, disruptive innovation and changes in consumers’ preferences have imposed to accommodate a much bigger quantity of more complex requests. In developed countries, increased competition has lowered the overall cost of
28 Ecoage.it – “Energia dai rifiuti”
telecommunication services and customers have shifted their demand from calls to data. Data flow has increased by 55% from the end of 2015 to the end of 2016. Most important goals for the future are the empowerment of outer space communication systems and ultra-fast broadband World coverage. 3031
1.2.2 Social infrastructure
Social infrastructure works are considered as a category of infrastructure on its own, allowing for the provision of social services. Social services are an important component of public expenditures in countries’ GDP. They are purchased by governments through public budgets and made available to the whole population. Every taxpayer pays for them and whoever can take advantage of them, possibly subordinately to the fulfilment of certain conditions. Most social infrastructures are still under the government control and ownership, as the management of social infrastructure operations is meant to enhance welfare and pursue social goals, rather than financial ones. This translates in the application of an availability-based payment scheme or mixed schemes including a small contribution from the final users, who are usually required to cover much less than the economic cost of the service supplied. Social infrastructures are mainly present in the following sectors:
Health: hospitals, clinics, surgeries, elderly housing, diagnosis
Education: schools, universities, libraries, theatres, museums, students’ housing, cultural centers
Public administration: buildings and offices, administrative facilities
Security and justice: police stations, firemen stations, tribunals, jails, barracks Social housing
Lately, also social infrastructures are experiencing an increase of the private sector’s commitment, especially in the education sector. Investing in social infrastructures can be assimilated to the investment in government long-term bonds, as they show both the lowest risk and the lowest expected return within the asset class of infrastructure. Social assets are characterized by very low asset specificity. This means that their economic destination can be modified in itinere without great difficulty and low cost. It is the case of an administrative building that is adapted to become a school or a dismissed barrack that starts to be used as a sport center. Low asset specificity screens investors against changes in demand that may arise because of demographic, technological and regulatory changes, hence increasing the predictability of future demand. 23
30 Wired – Parlangeli, Diletta – “7.5 miliardi: nel mondo ci sono più SIM che persone” – March 2017 31 EY – “Global telecommunication study: navigating the road to 2020” - 2015