The genetic architecture of membranous
nephropathy and its potential to improve
non-invasive diagnosis
Jingyuan Xie et al.
#Membranous Nephropathy (MN) is a rare autoimmune cause of kidney failure. Here we report
a genome-wide association study (GWAS) for primary MN in 3,782 cases and 9,038 controls
of East Asian and European ancestries. We discover two previously unreported loci,
NFKB1
(rs230540, OR
= 1.25, P = 3.4 × 10
−12) and
IRF4 (rs9405192, OR = 1.29, P = 1.4 × 10
−14),
fine-map the
PLA2R1 locus (rs17831251, OR = 2.25, P = 4.7 × 10
−103) and report ancestry-speci
fic
effects of three classical HLA alleles:
DRB1*1501 in East Asians (OR = 3.81, P = 2.0 × 10
−49),
DQA1*0501 in Europeans (OR = 2.88, P = 5.7 × 10
−93), and
DRB1*0301 in both ethnicities
(OR
= 3.50, P = 9.2 × 10
−23and OR
= 3.39, P = 5.2 × 10
−82, respectively). GWAS loci explain
32% of disease risk in East Asians and 25% in Europeans, and correctly re-classify 20
–37% of
the cases in validation cohorts that are antibody-negative by the serum anti-PLA2R ELISA
diagnostic test. Our
findings highlight an unusual genetic architecture of MN, with four loci and
their interactions accounting for nearly one-third of the disease risk.
https://doi.org/10.1038/s41467-020-15383-w
OPEN
#A full list of authors and their affiliations appears at the end of the paper.
123456789
M
embranous Nephropathy (MN) is a rare cause of kidney
failure, manifesting as nephrotic syndrome with a peak
incidence between 30 and 50 years of age
1. The
land-mark discoveries of pathogenic antibodies against neutral
endo-peptidase in antenatal MN
2, and anti-phospholipase A2 receptor
(PLA2R) antibodies in adult MN
3have established MN as the
disease of autoantibodies directed against podocyte antigens.
Several studies have confirmed the presence of autoantibodies
against PLA2R in ~60–70% of cases of primary MN
4, with
another 3–5% potentially explained by antibodies against
thrombospondin type 1 domain-containing 7A
5.
Previous genome-wide association study (GWAS) for MN
conducted in 75 French, 146 Dutch and 335 British cases
geno-typed with low resolution arrays identified impressively strong
associations of the HLA region and the PLA2R1 locus encoding
the dominant antigen in MN
6. These
findings suggest that genetic
variation controls the immunogenicity and/or expression level of
the PLA2R auto-antigen, as well as the production of anti-PLA2R
autoantibodies in individuals with a permissive HLA haplotype.
However, specific causal alleles underlying GWAS associations
have not yet been mapped at high resolution. Moreover, prior
GWAS was limited to Europeans, and the reported associations
have not been examined comprehensively across different
eth-nicities. Lastly, because of small sample size, the prior study might
have missed additional disease relevant loci.
Herein, we report a genetic study of primary MN involving
12,820 individuals (3782 biopsy-documented cases and 9038
ancestry-matched controls), across nine cohorts of East Asian and
European ancestries. The composition of our cohorts reflects the
demographics of the centres that have collected DNA samples for
genetic studies of this rare disease over the past 15 years. By using
high resolution arrays with genome-wide imputation and over
7-fold increase in sample size compared to the prior GWAS, we
discover two previously unreported genome-wide significant risk
loci for MN and perform high resolution mapping and
ethnicity-specific analyses of the known loci.
We describe an unusual genetic architecture of MN, with four
loci and their genetic interactions accounting for nearly one-third
of the disease risk. Our study implicates dysregulation of NFKB1
and IRF4 genes in the disease pathogenesis, providing genetic
support for potential targeting of the NF-κB and interferon
sig-nalling pathways in primary MN. We also refine ethnicity-specific
effects at the HLA locus, defining DRB1*1501 as a major risk
allele in East Asians, DQA1*0501 in Europeans, and DRB1*0301
in both ethnicities. We describe a risk haplotype at the PLA2R1
locus that has a regulatory function and exhibits strong genetic
interactions with the HLA-DRB1 risk alleles. Lastly, we calculate a
genetic risk score (GRS) based on these
findings which, when
used in combination with a serum anti-PLA2R ELISA (a serologic
test for MN currently in clinical use), shows superior
perfor-mance in discriminating cases and controls than the ELISA or
GRS alone. We validate the performance of this combined risk
score (CRS) in external validation cohorts. Our results
demon-strate that a combined serum-genetic test can potentially be used
to establish a new diagnosis of primary MN, obviating the need
for a high risk kidney biopsy procedure in the majority of cases.
Results
Study design. Our study involved nine case-control cohorts,
including four East Asian cohorts of 4841 individuals (1632
primary MN cases and 3209 controls) and
five European cohorts
of 7979 individuals (2150 primary MN cases and 5829 controls).
Eight cohorts were genotyped with high density SNP arrays,
imputed using the latest whole genome sequence reference panels,
and meta-analyzed genome-wide, and the top 46 loci selected
based on P < 5 × 10
−5were tested by targeted genotyping in the
ninth cohort (Supplementary Table 1). The summary of study
cohorts, genotyping methods, and ancestry-specific imputation
panels is provided in Table
1
.
All cases used in this study were defined by a kidney biopsy
diagnosis of idiopathic MN and any suspected secondary cases
due to drugs, malignancy, infection, or autoimmune disease were
excluded. With the exception of the German Chronic Kidney
Disease (GCKD) cohort, all controls used for discovery involved
healthy population controls and any individuals with a known
diagnosis of kidney disease were excluded. The GCKD cohort was
drawn entirely from a prospective observational study of patients
with CKD and consisted of biopsy-defined cases and controls for
whom CKD etiology was clearly assigned to a non-MN cause, as
previously described
7.
All genome-wide significant loci (P < 5 × 10
−8) were refined by
cohort-stratified stepwise conditional analyses to define
indepen-dently associated haplotypes. We also analyzed classical HLA
alleles and all common amino acid polymorphisms at class I and
class II genes imputed at high resolution. We performed detailed
genomic annotations and explored epistatic effects for significant
loci. Based on significant GWAS loci, we designed a GRS for MN
Table 1 Baseline characteristics of participants in the discovery and replication cohorts.
Cohort Ancestry No. of cases No. of controls Total Genotyping platform Imputation reference population panel Asian Cohorts
Chinese Discovery East Asian 561 904 1465 Zhonghua-8 chip (Illumina) 1000G Phase 3 East Asians Korean Discovery East Asian 164 708 872 MEGA chip (Illumina) 1000G Phase 3 East Asians Japanese Discovery East Asian 81 358 439 MEGA chip (Illumina) 1000G Phase 3 East Asians Chinese Replication East Asian 826 1239 2065 KASP (targeted) –
All Asian 1632 3209 4841
European Cohorts
European Discovery 1 European 611 1246 1857 MEGA chip (Illumina) 1000G Phase 3 Europeans European Discovery 2 European 1045 1094 2139 MEGA chip (Illumina) 1000G Phase 3 Europeans Turkish Discovery European 254 336 590 MEGA chip (Illumina) 1000G Phase 3 Europeans Sardinian Discovery European 93 1498 1591 OmniExpress (Illumina) 1000G Phase 3 Europeans GCKD Discovery European 147 1655a 1802 Omni2.5Exome (Illumina) HRC 1.1
All European 2150 5829 7979
All Participants 3782 9038 12,820
and performed its validation in external cohorts, including the
three previously published European GWAS cohorts
6and the
Nephrotic Syndrome Study Network (NEPTUNE) study
8.
The descriptions of all cohorts including ancestry analyses and
details of statistical approaches are provided in Methods,
Supplementary Methods, and Supplementary Figs. 1 and 2.
Genome-wide association. The results of combined
genome-wide meta-analyses are summarized in Fig.
1
and Table
2
, with
more information provided in Supplementary Table 1 and
Sup-plementary Figs. 3 and 4. We discovered two novel genome-wide
significant loci: a locus on chromosome 4q24 encoding NFKB1
(rs230540, OR
= 1.25, Meta-analysis P = 3.4 × 10
−12) and a locus
a
Chromosome rs17831251 0.8 0.6 0.4 0.2 r2 r2 r2 r2 r2 r2 160.6 160.9 161.2 MIR4785 RBMS1 ITGB6 PLA2R1 LY75 LY75-CD302 CD302 MARCH7 BAZ2B Chromosome 2 position (Mb) 0.8 0.6 0.4 0.2 rs230540 Chromosome 4 position (Mb) 103.2 103.5 103.8 SLC9B1 CISD2 UBE2D3 MANBA NFKB1 SLC39A8 rs9405192 Chromosome 6 position (Mb) 0.2 0.4 0.6 HUS1B EXOC2 IRF4 DUSP22 0 15 30 45 60 75 90 105 0 15 30 45 60 75 90 105 0 2 4 6 8 10 12 0 2 4 6 8 10 12 0 2 4 6 8 10 12 14 16 0 20 40 60 Recombination Rate (cM/Mb) 0 20 40 60 Recombination Rate (cM/Mb) 0 20 40 60 Recombination Rate (cM/Mb) 0 20 40 60 Recombination Rate (cM/Mb) 0 20 40 60 Recombination Rate (cM/Mb) 0 20 40 60 Recombination Rate (cM/Mb)b
c
d
0.8 0.6 0.4 0.2 0.8 0.6 0.4 0.2 0.8 0.6 0.4 0.2 0 2 4 6 8 10 12 14 16 0.8 0.6 0.4 0.2PLA2R1 locus NFKB1 locus IRF4 locus
1 2 3 4 5 6 7 8 9 10 1 1 12 13 14 15 16 17 18 19 20 21 22 0 5 10 105 160 15 –log 10 (p -value) –log 10 (p -value) –log 10 (p -value) –log 10 (p -value) –log 10 (p -value) –log 10 (p -value) –log 10 (p -value) HLA NFKB1 PLA2R1 IRF4
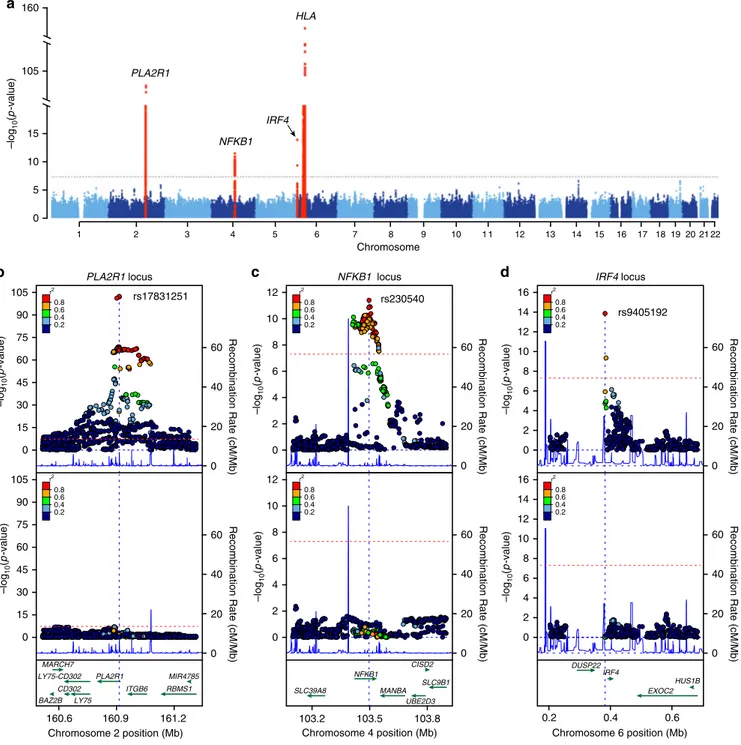
Fig. 1 Manhattan and regional plots for non-HLA loci for the combined meta-analysis of all MN cohorts. a The results of the combined meta-analysis across all cohorts; the dotted horizontal line indicates a genome-wide significance threshold (α = 5 × 10⁻⁸); they-axis is truncated twice to accommodate large peaks overPLA2R1 and HLA loci; genome-wide-significant loci highlighted in red; b Regional plot for the PLA2R1 locus; the upper panel shows unconditioned meta-results, the lower panel depicts meta-results after conditioning for the top SNP (rs17831251).c Regional plot for theNFKB1 locus; the upper panel corresponds to unconditioned results; the lower panel shows meta-results after controlling for rs230540.d Regional plot for theIRF4 locus; the upper panel corresponds to unconditioned results; the lower panel shows meta-results after controlling for rs9405192. Thex-axis denotes genomic location (hg19 coordinates), lefty-axis represents –log P values for association statistics, right y-axis represents average recombination rates based on HapMap-III reference populations combined (blue line). In the conditional analyses, we conditioned on the top SNP in each individual cohort, then meta-analyzed conditioned summary statistics as described in the Methods.
on chromosome 6p25.3 encoding IRF4 (rs9405192, OR
= 1.29,
Meta-analysis P
= 1.4 × 10
−14). We also confirmed strong and
highly significant associations at the previously described loci,
including chromosome 2q24.2 encoding PLA2R1 (rs17831251,
OR
= 2.25, Meta-analysis P = 4.7 × 10
−103) and 6p21.32
encod-ing HLA-DQA1/DRB1 genes (rs9271573, OR
= 2.41,
Meta-analysis P
= 2.7 × 10
−154).
Conditional analyses of the three non-HLA loci revealed that
each signal is explained by a single SNP in each cohort, suggesting
a single shared risk haplotype per locus in East Asian and
European populations (Fig.
1
b–d). To further test if the causal
variants at these loci are likely shared between Europeans and
East Asians, we performed 99% credible set analyses using
summary statistics for each ancestry-defined subgroup and
compared them with credible sets derived from the trans-ethnic
meta-analysis. We confirmed that the predicted causal variants
derived from the trans-ethnic analysis were largely overlapping
with ancestry-specific results (Supplementary Fig. 5). In contrast,
stepwise conditional analyses of SNPs at the HLA region revealed
a complex pattern of association, with at least three
indepen-dently genome-wide significant SNPs explaining the signal across
all cohorts (Supplementary Table 2).
Given the complexity of the association signal at the HLA locus
and known differences in linkage disequilibrium (LD) patterns by
ancestry, we performed additional analyses of this region
separately in East Asians and Europeans. In the conditional
analyses of the East Asian cohorts, only two independently
associated SNPs explained the entire signal at this locus
(rs9269027 and rs1974461). In Europeans, stepwise conditional
analyses revealed three independently associated genome-wide
significant SNPs (rs9271541, rs9265949, and rs2858309),
suggest-ing a more complex pattern of association (Supplementary
Table 2). In both ethnicities, the top signal centred on HLA-DRB1
and DQA1 genes (Fig.
2
a, b).
Classical HLA alleles and amino acid polymorphisms. We next
imputed classical HLA alleles at two- and four-digit resolution
using ethnicity-specific reference panels (see Methods). The first
two digits specify a group of HLA alleles known as super-types as
defined by older typing methodologies. The third through fourth
digits specify nonsynonymous substitutions. Moreover, we
imputed individual amino acid polymorphisms at class I (HLA-A,
-B, and -C) and class II (HLA-DQB1, -DQA1 and -DRB1) genes.
In East Asian cohorts, stepwise conditioning on classical HLA
alleles defined two independent risk alleles, DRB1*1501 (OR =
3.81, Wald test P
= 2.0 × 10
−49) and DRB1*0301 (OR
conditioned=
3.88, Wald test P
= 4.5 × 10
−24, Fig.
2
c, Supplementary Table 3).
In the analysis of polymorphic amino acid sites, genetic variation
at only two codons encoding residues at positions 13 and 71 in
DRβ, explained the entire HLA-DRB1 signal (Fig.
3
a,
Supplemen-tary Table 4). Specifically, DRβ position 13 occupied by Arginine
(OR
= 3.68, 95% CI: 2.74–4.95) or Serine (OR = 2.76, 95% CI:
2.06–3.71), and position 71 occupied by Lysine (OR = 3.10, 95%
CI: 2.49–3.86) or Alanine (OR = 2.96, 95% CI: 2.55–3.45)
conveyed the greatest risk (Supplementary Table 5). Consistent
with a prior study in Chinese patients
9, these amino acids define
the
classical
risk
alleles
DRB1*1501 and DRB1*0301
(Supplementary Table 6), and their side chains map adjacent to
each other within the antigen-binding pocket of the
β-chain of DR
(Fig.
3
c).
The top Asian risk allele DRB1*1501 had no significant risk effect
in Europeans despite its frequency being comparable between
populations (control freq. 10% vs. 8% in Europeans and East
Asians, respectively). The most strongly associated European risk
allele was DQA1*0501 (OR = 2.88, Wald test P = 5.7 × 10
−93,
Fig.
2
d). After conditioning the locus on DQA1*0501, DRB1*0301
remained genome-wide significant (OR
conditioned= 2.00, Wald test
P
= 2.0 × 10
−19, Supplementary Table 7) suggesting that this risk
allele is shared between Asian and European populations. We note
that DQA1*0501 allele is twice as common in Europeans compared
to Asians (control freq. 30% vs. 14%). Moreover, DQA1*0501
and DRB1*0301 are in imperfect LD that is stronger in Europeans
(r
2= 0.40) compared to East Asians (r
2= 0.29). Although a weak
effect of DQA1*0501 was apparent in our Asian cohorts (Fig.
2
c,
Supplementary Table 3), this allele became non-significant after
conditioning on DRB1*0301. In contrast, DQA1*0501 exhibited a
genome-wide significant risk effect after conditioning on
DRB1*0301 in Europeans (OR
conditioned= 2.40, Wald test P =
1.8 × 10
−18).
Given that our HLA imputation reference panels were
considerably smaller for East Asians compared to Europeans,
we sought additional validation of the observed classical HLA
associations that were Asian-specific. We therefore created
another reference panel based on the MHC sequence data from
Zhou et al.
10including 10,689 control individuals of Han Chinese
ancestry. Using SNP2HLA software, we then re-imputed classical
HLA alleles for our East Asian cohorts. We used the same quality
control
filters (MAF > 0.01 and imputation R
2>0.8) and methods
for association testing as described above. We observed no major
differences in the association statistics for the two Asian risk
alleles, DRB1*1501 (OR = 3.49, P = 3.85e−40) and DRB1*0301
(OR
= 4.08, P = 6.3E−24), demonstrating that these effects do
not represent artifacts of smaller imputation panels.
We next performed the analysis of HLA amino acid
substitutions in Europeans. Consistent with the association
analyses of classical alleles,
five bi-allelic sites in DQA1 that
correlate with the DQA1*0501 allele were most strongly
associated with the risk of MN
(75Ser-107Ile-156Leu-161Glu-163Ser, Wald test P
= 5.7 × 10
−93, Fig.
3
b, Supplementary
Tables 8–10). Conditioning on this haplotype in Europeans
uncovered a second independent signal in HLA-DRB1, position
74 (Supplementary Tables 8 and 9), with Arginine representing
the key risk residue (OR 2.86, 95% CI: 2.54–3.23). This residue
defines the European DRB1*0301 risk haplotype (Supplementary
Tables 9 and 10). Notably, positions 74 (Europeans) and 71 (East
Asians) are separated by a single turn along the
α-helix, and their
side chains are spatially close to that of position 13, located on the
beta-sheet
floor with its side chain oriented into the
peptide-binding groove (Fig.
3
c).
To confirm ethnicity-specific HLA effects, we repeated stepwise
conditioning in a joint stratified analysis of all cohorts using
bi-allelic tests of HLA alleles with formal tests of heterogeneity
(Supplementary Table 11, Fig.
4
a). The top classical allele
supported by all cohorts regardless of ethnicity was DRB1*0301
Table 2 Effect estimates for top GWAS SNPs by ethnicity and combined across all cohorts.
Locus SNP Risk allele E. Asian
case freq. E. Asian control freq. E. Asian OR (95% CI) E. Asian P-value European case freq. European control freq. European OR (95% CI) European
P-value Combined OR(95% CI)
Combined P-value PLA2R1 rs17831251 C 0.85 0.70 2.81 (2.48–3.17) 3.5 × 10−61 0.76 0.61 1.98 (1.81–2.17) 4.7 × 10−48 2.25 (2.09–2.42) 4.7 × 10−103 NFKB1 rs230540 C 0.43 0.35 1.24 (1.14–1.36) 1.8 × 10⁻⁶ 0.35 0.32 1.25 (1.14–1.36) 7.8 × 10⁻⁷ 1.25 (1.17–1.33) 3.4 × 10⁻¹² IRF4 rs9405192 G 0.51 0.42 1.40 (1.28–1.53) 8.8 × 10⁻¹⁴ 0.73 0.69 1.18 (1.07–1.29) 6.6 × 10⁻⁴ 1.29 (1.21–1.37) 1.4 × 10⁻¹⁴ HLA rs9271573 A 0.60 0.35 2.97 (2.69–3.28) 3.7 × 10−102 0.62 0.44 2.06 (1.89–2.25) 1.8 × 10−60 2.41 (2.26–2.57) 2.7 × 10−154
(OR
= 3.71, Wald test P = 2.9 × 10
−127). After conditioning for
DRB1*0301, the top classical allele was DQA1*0501 (OR
conditioned=
1.80, Wald test P
= 1.1 × 10
−30), but this association was supported
predominantly
by
Europeans.
After
controlling
for
both
DRB1*0301 and DQA1*0501, the top allele was DRB1*1501
(OR
conditioned= 1.94, Wald test P = 4.7 × 10
−29), but the risk effect
was supported exclusively by East Asians (heterogeneity I
2= 97.5,
Cochrane’s Q-test P < 0.05).
PLA2R1 locus and its genetic interactions. Consistent with prior
GWAS, the most significant non-HLA locus resided on
chro-mosome 2q24.2
6. The top SNP was in the
first intron of PLA2R1,
which encodes the main podocyte autoantigen in primary MN.
This signal was supported by both ethnicities, but the effect
appeared stronger in East Asians (OR
= 2.81, Meta-analysis P =
3.5 × 10
−61) compared to Europeans (OR
= 1.98, Meta-analysis
P
= 4.7 × 10
−48, Table
2
). After conditioning the association on
the top SNP, rs17831251, there was no residual association at this
locus, suggesting a common risk haplotype in both ethnicities
(Fig.
1
b).
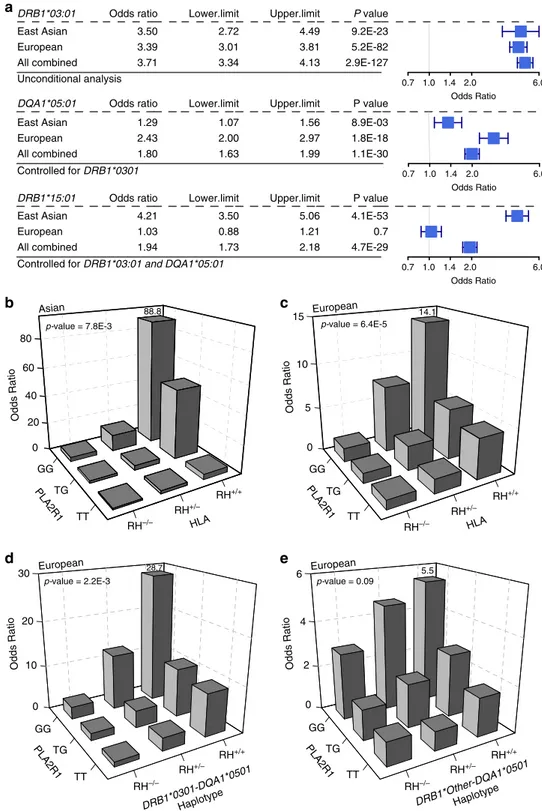
We next refined the previously reported genetic interactions
between the PLA2R1 locus and HLA risk haplotypes. The
PLA2R1 risk genotype exhibited significant multiplicative
interaction with both Asian and European HLA risk haplotypes
(Fig.
4
b, c), with the risk homozygosity at both loci associated
with 89-fold increased odds of disease risk in East Asians [OR
=
88.8 for double risk homozygotes (N cases/controls
= 103/10)
vs. double protective homozygotes (N cases/controls
= 15/152),
95% CI: 38.0–207.3, Interaction test P = 7.8 × 10
−3] and 14-fold
in Europeans [OR
= 14.1 for double risk homozygotes (N cases/
controls
= 291/89) vs. double protective homozygotes (N cases/
controls
= 52/237), 95% CI: 10.0–22.1, Interaction test P =
6.4 × 10
−5]. Because the effect modification was weaker in
Europeans, we next repeated interaction testing separating
individual HLA risk haplotypes (Fig.
4
d, e). Notably, the
interaction in Europeans was driven predominantly by the
DRB1*0301-DQA1*0501 haplotype [OR = 28.7 for double risk
homozygotes (N cases/controls
= 115/13) vs. double protective
homozygotes (N cases/controls
= 75/339), 95% CI: 15.1–54.4,
Interaction test P
= 2.2 × 10
−3]. After removing its effect,
DQA1*0501 had no residual interaction with PLA2R1
29 30 31 32 33 34 Chromosome 6 position (Mb) 0 20 40 60 80 100 30 31 32 33 Chromosome 6 position (Mb) 0 20 40 60 80 100 0 10 20 0 10 20 30 0 10 –log 10 (p -value) –log 10 (p -value) –log 10 (p -value) –log 10 (p -value)
b
a
HLA-DRB1 HLA-DQA1Control for HLA-DRB1
Control for HLA-DQA1
HLA-DRB1
Control for HLA- DQA1 & DRB1
c
d
0.0 0.1 0.2 0.3 *01:01*01:02*01:03*02:01*03:01*04:01*05:01 0.0 0.2 0.4 0.6 Frequency FrequencyClassical HLA-DRB1 allele Classical HLA-DRB1 allele Classical HLA-DQA1 allele
OR = 3.39 P = 5.2E-82 OR = 0.57 P = 2.3E-9 OR = 0.38 P = 6.6E-18 *01:01*03:01*07:01*12:01*13:01*13:02*13:03*15:01 0.0 0.1 0.2 0.3 Control Case OR = 0.63 P = 1.3E-13 OR = 0.50 P = 2.3E-18 OR = 2.88 P = 5.7E-93 *03:01*04:05*07:01*08:03*09:01*12:01*12:02*13:02*15:01*15:02 *01:01*01:02*01:03*02:01*03:01*04:01*05:01*06:01 0.0 0.1 0.2 0.3 0.4 Case Control
Classical HLA-DQA1 allele OR = 3.50 P = 9.2E-23 OR = 0.38 P = 6.6E-18 OR = 3.81 P = 2.0E-49 P = 1.3E-27OR = 0.43 OR = 1.83 P = 6.8E-14 OR = 2.14 P = 1.3E-24 HLA-DQA1 HLA-DRB1
East Asian European
Fig. 2 Ethnicity-specific association analyses point to HLA-DRB1 and HLA-DQA1 as the top associated genes. a Regional plot for East Asian cohorts that includes association statistics for all imputed variants and classical HLA alleles; the strongest association signal was forHLA-DRB1 gene (upper panel); the results forHLA-DQA1 gene are highlighted for reference; after adjusting for all DRB1 classical alleles (red arrow), there were no residual associations across the entire 3-Mb region (lower panel). The dotted horizontal line indicates the genome-wide significance threshold (α = 5 × 10⁻⁸).b In Europeans, the strongest HLA gene association was for theHLA-DQA1 gene (upper panel); after controlling for all classical DQA1 alleles (red arrow), HLA-DRB1 gene remained genome-wide significant (middle panel); after controlling for both DRB1 and DQA1, there were no significant associations in the region (lower panel), suggesting that variation in both genes explains the entire signal.c East Asian frequency distributions of classicalDRB1 and DQA1 alleles (four-digit resolution) for cases (red) and controls (black); unadjusted ORs andP-values provided for genome-wide significant alleles. d The European frequency distributions of classicalDRB1 and DQA1 alleles (four-digit resolution) for cases (red) and controls (black); unadjusted ORs and P-values provided for genome-wide significant alleles.
(Interaction test P
= 0.1). Similarly, there was no significant
interaction between DQA1*0501 allele and PLA2R1 locus in East
Asians. These analyses suggest that the PLA2R1 locus
interac-tions are driven primarily by the DRB1 alleles.
We annotated all SNPs in LD with rs17831251 for potential
impact on the structure and/or transcriptional regulation of
PLA2R1. We found two common missense variants in moderate
LD, rs35771982 (p.H300D, r
2= 0.69) and rs3749117 (p.M292V,
r
2= 0.68), but the effects of these variants were considerably
weaker compared to rs17831251, suggesting that they are unlikely
to represent causal variants (Supplementary Table 12). Our
tissue-specific functional scoring method for non-coding variants
based on the ENCODE and Roadmap Epigenetics data
11prioritized another variant in intron 1, rs17241973 (r
2= 0.93
with rs17831251) that intersects a putative enhancer element
across multiple tissues (Supplementary Fig. 6). Both rs17831251
and rs17241973 exhibit strong cis-eQTL effects on PLA2R1
expression wherein the MN risk alleles associate with lower
mRNA expression of PLA2R1 across multiple tissues in GTEx
12,
but this effect appears reversed for the kidney tissue
(Supple-mentary Fig. 7). To further confirm these kidney-specific effects,
we used gene expression data from manually micro-dissected
human kidney compartments of 166 NEPTUNE participants
13.
We detected suggestive glomerular eQTL effects that were weak,
but direction-consistent with GTEx for rs17831251 (Wald test
P
= 0.055) and rs17241973 (Wald test P = 0.024), wherein MN
risk allele were associated with increased glomerular PLA2R1
mRNA levels (Supplementary Fig. 8).
Because kidney tissue compartments are not well represented
in either ENCODE or Roadmap datasets, we next examined the
genomic location of rs17831251 and rs17241973 in relationship
to the recently published kidney compartment-specific chromatin
landscape
14(Supplementary Fig. 9); rs17241973 lies within intron
1 of PLA2R1 in open chromatin that is active in both glomerular
and tubular compartments and is contiguous with the gene
promoter. In contrast, rs17831251 lies within a broad region of
increased chromatin accessibility in glomeruli, and is only 2.1-kb
away from a glomerulus-specific DHS that contains a
high-confidence NFKB1-binding motif. In glomerulus-specific
chro-matin
conformation
(Hi-C)
data,
both
rs17831251
and
rs17241973 make regional and distal contacts with other
glomerular DHS, emphasizing a composite cis-regulatory module
for PLA2R1 gene expression.
Novel loci encoding
NFKB1 and IRF4. The 4q24 locus contains
the NFKB1 gene, which encodes an active DNA binding subunit
of the NF-κB transcriptional complex. The top SNP, rs230540
(OR
= 1.25, Meta-analysis P = 3.4 × 10
−12), is an intronic variant
predicted to have a functional effect specific to immune cells
(Supplementary Fig. 10). In agreement with our prediction,
rs230540 has been associated with higher mRNA expression of
NFKB1 in whole blood (P
= 2.6 × 10
−11)
15and in CD4
+T cells
(P
= 2.0 × 10
−9)
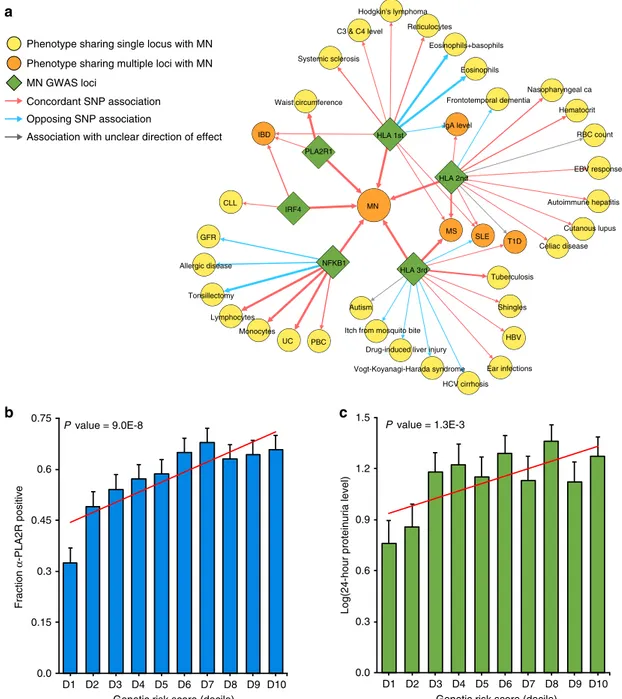
16. Consistent with pro-inflammatory effects of
NF-κB, the MN risk haplotype at this locus determined higher
leukocyte counts
17and increased risk of ulcerative colitis
18,19and
primary biliary cholangitis
20,21(Supplementary Table 13, Fig.
5
a).
NFKB1 is also expressed in human podocytes
22, as well as
pri-mary human glomerular and tubular epithelial cell cultures
14, and
rs230540 intersects an active glomerular DHS with several
107 0 200 DRB1 0 20 40 60 80 DQA1 0 20 40 60 120 100 80
DRB1 DQA1 DRB1 DQA1 DRB1 DQA1 DRB1 DQA1 DRB1 DQA1
0 200 0 200 0 200 0 200 0 200 0 200 0 200 0 200 0 200 0 200 0 200
Amino acid position Amino acid position
–log 10 (p -value) –log 10 (p -value)
a
b
c
d
Control for DRB1 pos.13 13 71 Control for DRB1 pos.13 & pos.7175 163
156 161
Control for DQA1 pos.75
74
Control for DQA1 pos.75 & DRB1 pos.74
Unconditional Conditional 1 Conditional 2 Unconditional Conditional 1 Conditional 2
90° 156 161 163 107 75 DQα DQβ DQα DQβ 156 161 163 107 75 90° 74 71 13 74 71 13 DRα DRβ DRα DRβ HLA-DR HLA-DQ
East Asian European
Fig. 3 Ethnicity-specific association analyses of DRβ1 and DQα1 amino acid sequence. a East Asian analysis of polymorphic amino acid positions within DRβ1 (blue) and DQα1 (green) molecules using conditional haplotype tests; the horizontal dash line marks the genome-wide significance level. The most strongly associated polymorphic site was position 13 inDRB1 (left panel); after controlling for this position, position 71 in DRB1 remained genome-wide significant (middle panel); after adjusting for both positions, there were no residual associations (right panel). b European analysis of polymorphic amino acid positions within DRβ1 (blue) and DQα1 (green); the DQA1 haplotype defined by amino acid positions 75, 107, 156, 161 and 163 (left panel) provided the strongest signal; after conditioning on this haplotype, position 74 inDRB1 remained genome-wide significant (middle panel); no additional independent positions were found upon further conditioning (right panel).c Protein structure of the DR molecule includingα chain (pink ribbon) and β chain (blue ribbon), the side chains of amino acids at DRβ1 positions 13, 71, and 74 are located adjacent to each other in the P4 pocket of the peptide-binding groove. d Protein structure of the DQ molecule includingα chain (yellow ribbon) and β chain (green ribbon); all five bi-allelic amino acid sites in DQα1 are in perfect LD with each other and define the top associated DQA1*0501 allele in Europeans.
TT TG GG TT TG GG PLA2R1 DRB1*0301-DQA1*0501Haplotype PLA2R1 0 10 20 30 0 2 4 6
Odds Ratio Odds Ratio
p-value = 2.2E-3 p-value = 0.09
European European DRB1*Other-DQA1*0501Haplotype HLA RH–/– RH+/– RH+/+ RH–/– RH+/– RH+/+ RH–/– RH+/– RH+/+ HLA RH–/– RH+/– RH+/+ PLA2R1 TT TG GG Odds Ratio 0 20 40 60 80 Odds Ratio Asian European p-value = 7.8E-3 0 5 10 15 TT TG GG PLA2R1 p-value = 6.4E-5 88.8 14.1 28.7 5.5 DRB1*03:01 East Asian European All combined Odds ratio 3.50 3.39 3.71 Lower.limit 2.72 3.01 3.34 Upper.limit 4.49 3.81 4.13 P value 9.2E-23 5.2E-82 2.9E-127 DQA1*05:01 East Asian European All combined Odds ratio 1.29 2.43 1.80 Lower.limit 1.07 2.00 1.63 Upper.limit 1.56 2.97 1.99 P value 8.9E-03 1.8E-18 1.1E-30 Unconditional analysis DRB1*15:01 East Asian European All combined Odds ratio 4.21 1.03 1.94 Lower.limit 3.50 0.88 1.73 Upper.limit 5.06 1.21 2.18 P value 4.1E-53 0.7 4.7E-29 0.7 1.0 1.4 2.0 6.0 Odds Ratio Controlled for DRB1*0301
Controlled for DRB1*03:01 and DQA1*05:01
0.7 1.0 1.4 2.0 6.0 Odds Ratio 0.7 1.0 1.4 2.0 6.0 Odds Ratio
d
e
b
c
a
Fig. 4 Ethnicity-specific HLA allelic effects and genetic interactions. a Stepwise conditioning of HLA risk alleles by ethnicity; Top: Unconditioned effect estimates, 95% confidence intervals, and P-values for DRB1*0301 demonstrate similar effects in East Asian and European cohorts. Middle: Effect estimates forDQA1*0501 after controlling for DRB1*0301 demonstrate significant heterogeneity, with stronger effects in the European cohorts (Cochrane’s Q P-value < 0.05). Bottom: Effect estimates forDRB1*1501 after controlling for both DRB1*0301 and DQA1*0501 demonstrate significant heterogeneity with risk effect in East Asians but no effect in Europeans (Cochrane’s Q P-value < 0.05). b PLA2R1 genotype interaction with East Asian HLA risk haplotypes, DRB1*0301 or DRB1*1501 (N cases/controls = 803/1,956, P = 7.8 × 10⁻³).cPLA2R1 genotype interaction with European HLA risk haplotypes, DRB1*0301 or DQA1*0501 (N
cases/controls= 1880/2627, multiplicative interaction test P = 6.4 × 10⁻⁵).dPLA2R1 genotype interaction with DRB1*0301-DQA1*0501 risk haplotype in Europeans (multiplicative interaction testP = 2.2 × 10⁻³).e No significant interaction between PLA2R1 and DQA1 risk haplotypes other than DQA1*0501-DRB1*0301 in Europeans (multiplicative interaction test P = 0.09). RH risk haplotype.
glomerular Hi-C contact sites
14(Supplementary Fig. 11). Notably,
the MN risk allele has previously been associated with lower
estimated glomerular
filtration rate in GWAS of renal
function
23,24, thus this locus may be more broadly associated with
the risk of kidney disease.
The top SNP on chromosome 6p25.3, rs9405192 (OR
= 1.29,
Meta-analysis P
= 1.4 × 10
−14), resides upstream of IRF4 gene,
which belongs to the family of transcription factors regulating
interferon-inducible genes. IRF4 is lymphocyte specific and
negatively regulates Toll-like-receptor signalling that is central
to the activation of innate immune system; this gene is known to
be under the transcriptional control of the NF-kB complex
25–27.
Unlike PLA2R1 and NFKB1, IRF4 does not appear to be
expressed in human kidney cells by single nuclei RNA-seq
28(Supplementary Fig. 12). We did not
find functional or coding
SNPs in LD with rs9405192, nor did we observe any cis-eQTL
effects for this variant, thus the precise mechanism underlying
this association remains unknown. However, the analysis of
binding sites for individual components of the NF-κB complex in
lymphocytes
29suggested binding of the complex in close
proximity of rs9405192 (Supplementary Fig. 13). The risk allele
at this locus is also in strong LD with variants previously
Phenotype sharing single locus with MN Phenotype sharing multiple loci with MN MN GWAS loci
Concordant SNP association
Association with unclear direction of effect Opposing SNP association Eosinophils Eosinophils+basophils Reticulocytes Systemic sclerosis Hodgkin's lymphoma C3 & C4 level MS Tuberculosis SLE T1D HLA 3rd Autoimmune hepatitis Nasopharyngeal ca EBV response Cutanous lupus RBC count Hematocrit Celiac disease UC Monocytes GFR Tonsillectomy Allergic disease Lymphocytes PBC NFKB1 Frontotemporal dementia HLA 1st PLA2R1 CLL MN HLA 2nd IgA level IBD Waist circumference IRF4 Ear infections Vogt-Koyanagi-Harada syndrome
Itch from mosquito bite Drug-induced liver injury Autism HBV HCV cirrhosis Shingles 0.0 0.15 0.3 0.45 0.6 0.75
Genetic risk score (decile)
Fraction α -PLA2R positive
b
c
D1 D2 D3 D4 D5 D6 D7 D8 D9 D10 P value = 9.0E-8Genetic risk score (decile)
D1 D2 D3 D4 D5 D6 D7 D8 D9 D10
Log(24-hour proteinuria level)
0.0 0.3 0.6 0.9 1.2 1.5 P value = 1.3E-3
a
Fig. 5 Pleiotropic effects of the MN loci and their clinical correlations. a The pleiotropy map was constructed based on overlapping genome-wide significant loci reported in the GWAS Catalogue: traits sharing a single locus with MN are indicated in yellow; traits sharing multiple loci are indicated in orange; arrows represent allelic associations that are identical to, or in tight LD (r2> 0.8) with the MN risk alleles; arrow thickness is proportional tor2
between alleles; concordant effects are indicated in red and opposed effects in blue. IBD: inflammatory bowel disease, includes ulcerative colitis (UC) and Crohn’s disease (CD); PBC primary biliary sclerosis, GFR glomerular filtration rate, CLL chronic lymphocytic leukemia, HBV hepatitis B virus; b Significant positive correlation of the GRS with anti-PLA2R antibody seropositivity (N = 1114 cases, Wald test P = 9.0 × 10⁻⁸) andc log-transformed 24-h proteinuria at diagnosis (N = 1329 cases, Slope test P = 1.3 × 10⁻³). Thex-axis depicts deciles of GRS; error bars correspond to standard errors; the P-values are adjusted for age, sex, and ethnicity.
associated with increased risk of inflammatory bowel disease
19,
and in weaker LD with several risk variants for chronic
lymphocytic leukemia (Supplementary Table 13, Fig.
5
a),
suggest-ing the pattern of pleiotropy that is similar to the NFKB1 locus.
Nevertheless, we detected no statistically significant genetic
interactions of IRF4 and NFKB1 loci.
In addition, we systematically annotated all other suggestive
non-HLA loci defined by P < 5.0 × 10
−5and these results are
summarized in Supplementary Table 14. To enhance potential
genetic discovery of novel podocyte antigens, we also repeated
genome scans after conditioning for the PLA2R1 locus, but
detected no additional suggestive loci.
SNP-based heritability and risk explained by GWAS. Using our
genotype data and genome-based restricted maximum likelihood
method (GREML)
30, we estimated the overall SNP-based
herit-ability of MN at 0.43 (SE
= 0.039) in East Asians and 0.36 (SE =
0.0046) in Europeans. Remarkably, all genome-wide significant
risk alleles exhibited unusually large effect sizes for GWAS. In
order to quantify the fraction of disease variance cumulatively
explained by genome-wide significant SNPs and their
interac-tions, we performed ethnicity-specific GRS analyses (see
Meth-ods). Each GRS was expressed as a weighted sum of risk alleles
with weights defined by their mutually adjusted effect estimates
and included the 3 independent non-HLA SNPs (rs6707458,
rs230540, rs9405192) as well as ethnicity-specific HLA risk alleles
and their interactions. This included rs9269027, rs1974461, and
rs9269027*rs6707458 interaction term for East Asians, and
rs9271541, rs9265949, rs2858309 and rs9271541*rs6707458
interaction term for Europeans (Supplementary Table 15). The
GRS calculated using this method explained 32% disease risk in
East Asians, 25% in Europeans, and 29% of overall disease risk
across all cohorts combined. Remarkably, the magnitude of the
GRS effect was comparable to rare, highly penetrant mutations
causing Mendelian forms of kidney disease, with individuals in
the top decile of GRS having 30 to 40-fold higher disease risk
compared to the lowest decile (Fig.
6
a, b).
Clinical correlations of the GRS. For a subset of patients with
available clinical data, we performed genetic correlation analyses
with selected clinical features reflective of disease severity. The
GRS was positively correlated with PLA2R antibody
seroposi-tivity (Wald test P
= 9.0 × 10
−8), and in those with detectable
antibodies, higher titers at the time of biopsy (Slope test P
= 1.2 ×
10
−9, Fig.
5
b). The GRS also predicted worse proteinuria at the
time of biopsy, which represents the key marker of MN severity
and prognosis (Slope test P
= 1.3 × 10
−3, Fig.
5
c). Other clinical
features, such as age at diagnosis, renal function, or serum
albumin levels at the time of biopsy were not significantly
cor-related with the GRS after multivariate adjustment
(Supplemen-tary Table 16).
Potential diagnostic implications of the GRS. Although the
diagnosis of MN is traditionally established by a kidney biopsy,
the detection of circulating PLA2R antibodies by ELISA has
recently emerged as a useful diagnostic modality
31. In this study,
we performed ELISA in sera obtained within 6 months of a
diagnostic kidney biopsy in a total of 2331 individuals (1488
cases, 300 healthy controls, and 543 disease controls). In East
Asians, we estimated that the standard ELISA cut-off of 20 U/mL
provided 100% specificity and 60% sensitivity for the diagnosis of
MN. In the analysis of Europeans, depending on the specific
cohort, the same cut-off provided 99–100% specificity and
51–57% sensitivity (Supplementary Table 17). While the antibody
level of 20 U/mL represents the manufacturer’s recommended
cut-off, levels 2–20 U/mL are frequently considered as
borderline-negative, and levels <2 U/mL as negative
31. In our cohorts, the
cut-off 2 U/mL had inadequate diagnostic specificity (range
73–92%). These results confirm the key limitation of the PLA2R
antibody ELISA, which has high specificity (99–100%) but low
sensitivity (51–60%) at the standard recommended cut-off point;
while lowering the cut-off increases sensitivity, it results in
inadequate specificity. Consequently, the levels in the
borderline-negative range (2–20 U/mL) are difficult to interpret clinically.
Given this limitation, we evaluated if the addition of genetic risk
information can improve the performance of ELISA, especially in
cases that fall in the borderline-negative range. First, we evaluated
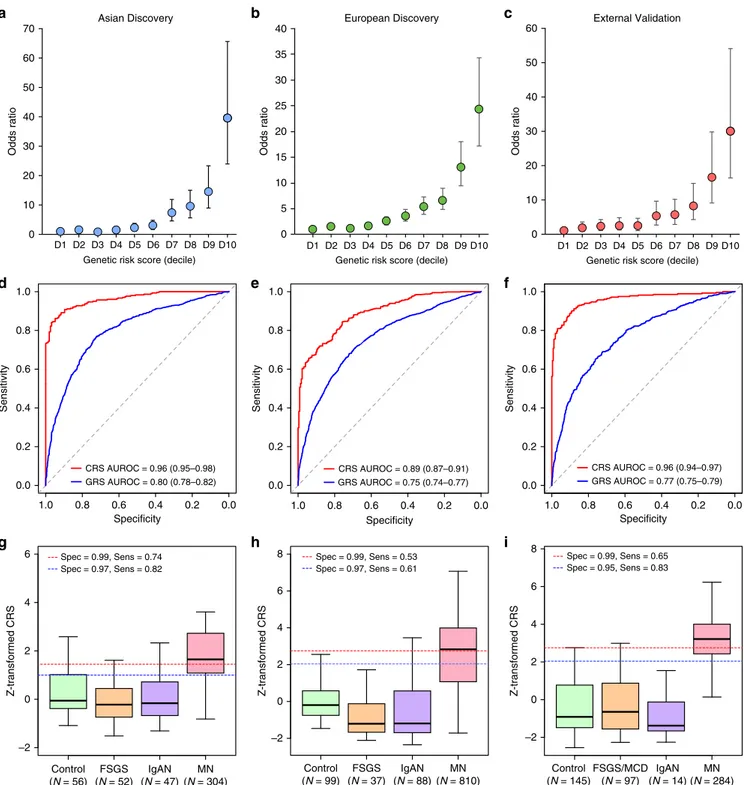
diagnostic properties of the GRS alone in our discovery cohorts. In
East Asians, the genetic test had area under the receiver operating
characteristics curve (AUROC) of 0.80 (95% CI: 0.78–0.82), while
in Europeans the AUROC was 0.75 (95% CI: 0.74–0.77).
Combining genetic and serologic tests in the form of a CRS
provided superior case discrimination with AUROCs of 0.96 (95%
CI: 0.95–0.98) in East Asians and 0.89 (95% CI: 0.87–0.91) in
Europeans (Fig.
6
, Supplementary Table 18).
We next tested the GRS performance in several external
validation cohorts, including three independent GWAS cohorts of
European ancestry as well as in the European-American
NEPTUNE participants with incident nephrotic syndrome
(Supplementary Table 18C-E). Overall, the effects and the
diagnostic performance of the GRS were comparable between
the European discovery and each validation cohort (Fig.
6
c).
When combined with the serum antibody titer, the CRS achieved
AUROC of 0.96 (95% CI: 0.94–0.97) across all validation cohorts
combined (Supplementary Table 18E, Fig.
6
f).
In the subgroup analyses, we compared the diagnostic
properties of GRS and CRS by the antibody status in all cohorts
pooled by ancestry (Fig.
7
). These analyses demonstrated that
both GRS and CRS were predictive of case status even for
antibody-negative MN. Importantly, the CRS continued to have
excellent performance in classifying the borderline-negative cases
(antibody level 2–20 U/mL range), with AUROCs of 0.98 (95%
CI: 0.97–0.99) in East Asians and 0.95 (95% CI: 0.93–0.96) in
Europeans. Notably, among all cases for which the ELISA test was
either negative or inconclusive, adding genetic information in the
form of CRS can establish the diagnosis in 20–37% cases with
99% specificity. The comparison of AUROCs between GRS, CRS,
and serum anti-PLA2R Ab test by ancestry is provided in
Supplementary Fig. 14, and the clinical implications of these
findings are summarized in Supplementary Note 1 and
Supplementary Table 19.
Lastly, we expanded our validation studies to non-European
participants of the NEPTUNE study (Supplementary Tables 20
and 21). Although the European risk score performance was
diminished in Hispanic Americans, the European GRS performed
well in African Americans, and this is despite substantial
differences in risk allele frequencies between Europeans and
Africans (Supplementary Table 22). Similar to the European
validation cohorts, the European GRS was superior compared to
the trans-ethnic GRS when applied to the NEPTUNE minority
populations, while the Asian GRS had relatively poor
perfor-mance in both African-American and Hispanic/Latino cohorts
(Supplementary Table 21, Supplementary Fig. 15).
Discussion
Our study provides important insights into an autoimmune
dis-ease and the genetic architecture of MN. First, we discover novel
genome-wide significant risk loci for MN with large effects
encoding two transcriptional master regulators of inflammation,
NFKB1 and IRF4. The association at the NFKB1 locus highlights
the role of the canonical NF-κB pathway in primary MN. Upon
activation by inflammatory signals, NFKB1 undergoes
pro-teasome processing to p50, an active DNA binding subunit of the
NF-κB complex. Inappropriate activation of this pathway has
previously been studied in progressive diabetic nephropathy
32,
and in the context of inflammatory diseases, including IBD
33,34and MN
35–37. Importantly, the MN risk allele at this locus has a
concordant effect on the risk of ulcerative colitis
18,19and primary
biliary cirrhosis
20,21. It has also been associated with increased
mRNA expression of NFKB1 in cis, and reduced DNA
D1 D2 D3 D4 D5 D6 D7 D8 D9D10
Genetic risk score (decile) 0 10 70 60 50 40 30 20 Odds ratio
Asian Discovery European Discovery
D1 D2 D3 D4 D5 D6 D7 D8 D9D10
Genetic risk score (decile) 0 5 40 30 25 20 15 10 Odds ratio 35 External Validation D1 D2 D3 D4 D5 D6 D7 D8 D9D10
Genetic risk score (decile) 0 10 60 50 40 30 20 Odds ratio
a
b
c
Specificity Sensitivity 1.0 0.8 0.6 0.4 0.2 0.0 0.0 0.2 0.4 0.6 0.8 1.0 Specificity 1.0 0.8 0.6 0.4 0.2 0.0 Sensitivity 0.0 0.2 0.4 0.6 0.8 1.0 Specificity 1.0 0.8 0.6 0.4 0.2 0.0 Sensitivity 0.0 0.2 0.4 0.6 0.8 1.0d
e
f
g
h
i
Control (N = 56) MN (N = 304) FSGS (N = 52) IgAN (N = 47) Z-transformed CRS –2 0 2 4 6 Control (N = 99) MN (N = 810) FSGS (N = 37) IgAN (N = 88) Z-transformed CRS –2 0 2 6 4 Z-transformed CRS –2 0 2 6 8 4 Control (N = 145) MN (N = 284) FSGS/MCD (N = 97) IgAN (N = 14) GRS AUROC = 0.80 (0.78–0.82) CRS AUROC = 0.96 (0.95–0.98) 8 Spec = 0.99, Sens = 0.53 Spec = 0.97, Sens = 0.61 GRS AUROC = 0.75 (0.74–0.77) CRS AUROC = 0.89 (0.87–0.91) GRS AUROC = 0.77 (0.75–0.79) CRS AUROC = 0.96 (0.94–0.97) Spec = 0.99, Sens = 0.74 Spec = 0.97, Sens = 0.82 Spec = 0.99, Sens = 0.65 Spec = 0.95, Sens = 0.83Fig. 6 Diagnostic performance of the genetic risk score (GRS) and the combined risk score (CRS). Genetic effects expressed as odds ratios (OR) and 95% confidence intervals in reference to the lowest decile of the GRS distribution for a East Asian discovery, b European discovery, and c European validation cohorts combined. GRS and CRS Receiver Operating Characteristics (ROC) curves ford East Asian discovery, e European discovery, and f European validation cohorts combined; AUROC Area under the ROC curve. Distributions of the CRS between healthy controls, diseased controls, and MN cases forg East Asian discovery, h European discovery, and i European validation cohorts combined. The box plots depict medians (horizontal lines), interquartile ranges (boxes), and minimum/maximum values (whiskers). The discovery CRS cut-offs of 1.00 and 1.45 in East Asians and 2.05 and 2.72 in Europeans have 97% and 99% specificity, respectively. The same European cut-offs were applied to the validation cohorts for comparisons of specificity and sensitivity.
methylation in trans across >400 CpGs that overlap with
NF-κB-binding sites, suggesting enhanced baseline activity of NF-κB
38.
The NF-κB complex is known to up-regulate IRF4 expression
with cross-regulatory feedback loops between NFKB1 and IRF4
described in several prior studies
25–27. Taken together, NFKB1
and IRF4 loci participate in a common regulatory pathway in
immune cells, and our genetic
findings clearly establish a critical
role of this pathway in the pathogenesis of MN.
Second, due to the bi-ethnic composition of our cohorts, we
were able to refine ethnicity-specific effects at the HLA locus,
defining DRB1*1501 as a major risk allele in East Asians,
DQA1*0501 in Europeans, and DRB1*0301 in both ethnicities.
These
findings suggest that different epitopes are likely presented
to T cells to initiate the anti-PLA2R response in East Asians and
Europeans. We also identified specific high-risk amino acid
substitutions, at positions 13, 71, and 74, mapping to the P4
pocket of DRβ1. Although the same positions contribute to the
risk of T1D
39and rheumatoid arthritis
40, the effects of individual
residues at each position are discordant, likely reflecting
differ-ences in target epitopes.
Third, we confirm that a single haplotype at the PLA2R1 locus
conveys the disease risk in both East Asians and Europeans, and
exhibits genetic interactions with HLA-DRB1 risk alleles. Our
analysis supports a regulatory function of the PLA2R1 risk
Ab >20 U/mL AUROC = 1.00 (1.00–1.00) Ab 2–20 U/mL AUROC = 0.98 (0.97–0.99) Ab <2.0 U/mL AUROC = 0.81 (0.74–0.87) Specificity 1.0 0.8 0.6 0.4 0.2 0.0 Ab >20 U/mL AUROC = 0.99 (0.99–1.00) Ab 2–20 U/mL AUROC = 0.95 (0.93–0.96) Ab < 2 U/mL AUROC = 0.72 (0.68–0.75)c
CRS in East Asiansd
CRS in Europeansa
GRS in East Asiansb
GRS in EuropeansSpecificity Sensitivity 1.0 0.8 0.6 0.4 0.2 0.0 Specificity 1.0 0.8 0.6 0.4 0.2 0.0 Specificity 1.0 0.8 0.6 0.4 0.2 0.0 0.0 0.2 0.4 0.6 0.8 1.0 Sensitivity 0.0 0.2 0.4 0.6 0.8 1.0 Sensitivity 0.0 0.2 0.4 0.6 0.8 1.0 Sensitivity 0.0 0.2 0.4 0.6 0.8 1.0 Ab >20 U/mL AUROC = 0.91 (0.88–0.94) Ab 2–20 U/mL AUROC = 0.87 (0.82–0.92) Ab <2.0 U/mL AUROC = 0.78 (0.71–0.85) Ab >20 U/mL AUROC = 0.80 (0.78–0.83) Ab 2–20 U/mL AUROC = 0.74 (0.69–0.79) Ab <2.0 U/mL AUROC = 0.69 (0.66–0.73)
Subgroup Cut-off Specificity Sensitivity
CRS All 1.45 99% 74%
CRS Ab- 1.45 99% 37%
GRS All 2.78 99% 15%
East Asians
Subgroup Cut-off Specificity Sensitivity
CRS All 2.50 99% 60%
CRS Ab- 2.50 99% 20%
GRS All 2.64 99% 13%
Europeans
e
f
Fig. 7 Diagnostic properties of the genetic risk score (GRS) and combined risk score (CRS) stratified by anti-PLA2R antibody status. Comparisons of receiver operating characteristic (ROC) curves to discriminate antibody positive (PLA2R Ab > 20 U/mL), borderline negative (PLA2R Ab 2–20 U/mL), and negative (PLA2R Ab < 2 U/mL) cases of primary MN from all available healthy and diseased controls combined fora GRS in East Asian discovery cohorts, b GRS in European discovery and validation cohorts, c CRS in East Asian discovery cohorts, d CRS in European discovery and validation cohorts. Overall sensitivities for risk score cut-offs corresponding to 99% specificities in (e) East Asian discovery cohorts and (f) European discovery and validation cohorts; CRS All: all patients with serum Ab measurements by ELISA within 6 months of a diagnostic kidney biopsy; CRS Ab-: patient subgroup with PLA2R Ab < 20 U/mL, and GRS All: all patients with GWAS data available for GRS calculation. AUROC: area under the ROC curve (95% confidence interval).
haplotype. The candidate causal variant resides in the
first intron of
PLA2R1 and intersects a predicted enhancer element. While this
variant is normally associated with suppressed PLA2R1
transcrip-tion across multiple tissues, it appears to increase expression of
PLA2R1 in the kidney. This
finding highlights the importance of
studying target tissues and is consistent with the
findings that
among CKD loci that are transcriptionally active in renal tissue,
15.8% of effects are kidney-specific
41. Notably, the top variants at
the PLA2R1 locus also intersect a putative NF-κB binding site in
lymphocytes, although no similar data is presently available for
podocytes. Further experimental work is thus needed to test if the
glomerular-specific eQTL effect is under the transcriptional control
of NF-κB. Moreover, larger glomerular compartment-specific
datasets will be needed to confirm the observed eQTL effects.
Another observation is that all four genome-wide significant
risk loci (PLA2R1, IRF4, NFKB1, and HLA) exhibit highly
pleiotropic effects and all four lead SNPs have a concordant effect
on the risk of inflammatory bowel disease (IBD). This observation
suggests shared pathogenic mechanism between IBD and MN.
Considering that MN is an orphan disease without a targeted
treatment, there may now be opportunities for drug
re-positioning approaches from IBD, where several new
anti-inflammatory agents are currently under development. Our
study suggests that the NF-κB and interferon pathways may
represent particularly attractive drug targets.
Remarkably, our GWAS loci are highly predictive of the disease
status and jointly explain up to one third of disease risk, an
exceptionally large fraction for common alleles. This may be
partially explained by the fact that MN frequently occurs after the
peak reproductive age, allowing the risk alleles to escape purifying
selection. Moreover, even though the risk alleles are common, our
interaction analysis demonstrates that specific high-risk genotype
combinations are relatively rare in the general population,
potentially explaining the low overall prevalence of MN
42. The
alternative hypothesis is that of balancing selection. NF-kB and
IRF4 are both involved in immune defenses against common
pathogens and some Phospholipase A2 ligands for PLA2R1
represent
downstream
NF-kB
targets
with
antibacterial
properties
43,44. Therefore, the observed high frequencies of MN
risk alleles could be explained by their protective effects against
common infections.
Finally, a simple GRS based on our GWAS loci has excellent
discriminant properties when combines with anti-PLA2R
ELISA test. Importantly, the combined genetic-serum test has
superior diagnostic properties compared to serologic test alone,
mitigating the key issue of low sensitivity. The GRS provides
complementary information to the serum test and correctly
re-classifies 20–37% of antibody-negative cases, potentially sparing
the need for a kidney biopsy in this large subgroup of patients.
In the clinical settings where neither a serum test nor a kidney
biopsy is possible, the GRS itself can establish a diagnosis of
MN with 99% specificity in 13–15% of cases. The practical
advantage of this approach is that the GRS can be readily
determined at any time after birth and, unlike the serum test, it
does not
fluctuate with time or in relationship to the disease
onset, activity, or treatment. One important limitation,
how-ever, is that genetic effects may be population-specific and may
not be generalizable to populations not represented in our
GWAS. The performance of the GRS is remarkably consistent
in our discovery and validation cohorts, including
African-Americans, but it appears to be lower in self-reported Latino/
Hispanics. Therefore, future efforts extending GWAS for MN to
more diverse populations will be important.
In summary, we described a highly unusual genetic
archi-tecture of MN, including large effect sizes for a small number of
common alleles and a strong evidence for ethnicity-specific
genetic interactions. These insights enabled formulation a
pow-erful genetic disease predictor that provides means to enhance a
non-invasive diagnosis of MN, and can be especially useful in the
settings where kidney biopsy represents too great of a risk or is
not readily available.
Methods
Study design overview. We performed a genome-wide meta-analysis of eight discovery cohorts of East Asian and European ancestry (2956 cases and 7799 controls), all genotyped with high resolution arrays and imputed to ~7 million common high-quality markers using ancestry-matched reference panels. The top signals from the meta-analysis (P < 5 × 10⁻⁵) were typed in the additional East Asian replication cohort of 826 cases and 1239 controls. Subsequently, all cohorts (3782 cases and 9038 controls) were analyzed jointly to define genome-wide sig-nificant signals. All subjects provided informed consent to participate in genetic studies, and the Institutional Review Board of Columbia University as well as local ethics review committees for each of the individual cohorts approved our study protocol. The individual cohorts, genotyping methods, and quality control analyses are described in the Supplementary Methods.
Primary association analyses and genome-wide meta-analyses. Within each cohort, primary association scans were performed for markers that were common (MAF > 0.01) and imputed at high quality (r2> 0.8) using logistic regression under
additive coding of dosage genotypes, and with adjustment for cohort-specific sig-nificant principal components (PCs) of ancestry. To quantify potential inflation of type I error due to stratification or technical artifacts, we estimated genomic inflation factors45for each genome-wide scan after excluding HLA and PLA2R loci. No substantial inflation was noted in any individual scan (lambda consistently <1.05 for each individual cohort). Subsequently, afixed effects meta-analysis was performed to combine the results of the eight discovery cohorts using METAL46. Genome-wide distributions of P-values were examined visually using quantile-quantile plots for each individual cohort as well as for the combined analysis. The final meta-analysis quantile-quantile plot showed no global departures from the expected null distribution (Supplementary Fig. 3), with the genomic inflation factor estimated at 1.03 for the overall meta-analysis. Suggestive signals were defined by P-value < 5.0 × 10⁻⁵. To declare genome-wide significance of a novel locus, we used the generally accepted P-value threshold of 5.0 × 10⁻⁸.
Conditional analyses. To detect additional independent SNPs at genome-wide significant loci, we performed stepwise conditional analyses of each locus using logistic regression. This was done by including the genotype of conditioning SNP (s) under additive coding as covariate(s) in the outcome model. The conditional analyses were performed individually within each cohort and with adjustments for cohort-specific ancestry PCs. Subsequently, the conditioned summary statistics were combined across cohorts usingfixed effects meta-analysis, similar to our primary association analyses.
Credible set analyses. For each of the three genome-wide significant non-HLA loci, we derived 99% credible sets using the trans-ethnic and ethnicity-specific meta-analysis results. First, we derived approximate Bayes factors from GWAS association statistics using Wakefield’s formula, as implemented in the R package gtx47. Using CAVIAR software48, we next calculated the posterior probability (PP) for each SNP driving the association signal at each locus. We assumed there was only a single causal variant at each locus, since no additional independent SNPs were detected on stepwise conditioning analyses. We derived both trans-ethnic as well as ethnicity-specific 99% credible sets based on ranking the variants by their PPs and adding the variants to the set until cumulative PP > 99% was reached for each region. The overlaps between ethnicity-specific and trans-ethnic analyses were visualized in Supplementary Fig. 5.
HLA imputation. Six discovery cohorts (Chinese, South Korean, Japanese, Eur-opean-1, European-2, and Turkish) had primary genotype data available for HLA imputation and association testing. For each of these cohorts, we imputed classical HLA alleles at two- and four-digit resolution, as well as individual amino acid polymorphisms at class I (A, -B, and -C) and class II (DQB1, HLA-DQA1 and HLA-DRB1) loci using SNP2HLAsoftware49. The European cohorts and the East Asian cohorts were imputed separately, using ethnicity-specific reference panels. For European reference, we used the pre-phased HLA reference dataset generated by the Type 1 Diabetes Genetics Consortium (T1DGC, 5,225 indivi-duals)49. For our East Asian cohorts, we used the Pan-Asian HLA Reference Panel (268 individuals)50. For validation of classical HLA association results in East Asians, we built additional East Asian reference panel based on the MHC sequence data from Zhou et al. (10,689 Han Chinese)10. In the association analyses, we included only common HLA alleles (MAF > 0.01) that were imputed with high certainty (R2> 0.8).