&
Imaging Agents
Structural Features of Europium(II)-Containing Cryptates That
Influence Relaxivity
Chamika U. Lenora,
[a]Fabio Carniato,
[b]Yimin Shen,
[c]Zahid Latif,
[c, d]E. Mark Haacke,
[c, d]Philip D. Martin,
[e]Mauro Botta,*
[b]and Matthew J. Allen*
[a, d]Abstract: EuII-containing complexes were studied with
re-spect to properties relevant to their use as contrast agents for magnetic resonance imaging. The influences of molecu-lar parameters and field strength on relaxivity were studied
for a series of EuII-containing cryptates and their adducts
with b-cyclodextrins, poly-b-cyclodextrins, and human serum
albumin. Solid- and solution-phase characterization of EuII
-containing complexes is presented that demonstrates the
presence of inner-sphere molecules of water. Additionally, relaxivity, water-exchange rate, rotational correlation time, and electronic relaxation times were determined using
varia-ble-temperature 17O NMR, nuclear magnetic relaxation
dis-persion, and electron paramagnetic resonance spectroscopic techniques. These results are expected to be instrumental in
the design of future EuII-based contrast agents.
Introduction
Magnetic resonance imaging (MRI) is a noninvasive technique used to visualize the interior of objects with high spatial
reso-lution.[1]The contrast observed in most MR images can be
en-hanced with contrast agents that modulate the attributes,
in-cluding longitudinal (T1) relaxation times, of protons on
proxi-mal water molecules. Contrast agents for MRI are often
para-magnetic GdIII-based complexes,[2] but EuII-containing
com-plexes have been studied as redox-active alternatives to GdIII
-based complexes.[3] EuIIis isoelectronic with GdIIIand shortens
the T1 relaxation times of nearby water protons to a similar
extent as GdIII, leading to enhanced contrast in T
1-weighted
images. The ability to shorten T1 relaxation times is measured
in terms of relaxivity (r1), and the relaxivity of a paramagnetic
contrast agent depends on factors such as the applied mag-netic field and molecular parameters, including hydration
number (q), water-exchange rate (kex), and rotational
correla-tion time (tR). An understanding of the relationships among
the structures of paramagnetic complexes, the molecular pa-rameters that influence relaxivity, and magnetic field strength is crucial to the ability to rationally design contrast agents. The effects of paramagnetic metal ions on the relaxation of water molecules are often described using the
Solomon–Bloember-gen–Morgan equations.[4] Relative to GdIII-based contrast
agents, the applicability of these equations to EuII-containing
complexes is understudied. To obtain experimental validation
of how molecular parameters influence the relaxivity of EuIIat
different field strengths, we studied three EuII-containing
com-plexes and supramolecular adducts of one of the comcom-plexes with cyclodextrins and albumin. These complexes and inclu-sion complexes that differ in one or more molecular parame-ters were studied over a range of field strengths. Herein, we report the findings from these studies in terms of the
relation-ships among the structures of EuII-containing cryptates;
molec-ular parameters including q, kex, and tR; and field strengths
from 0.00021 to 11.7 T.
Results and Discussion
Synthesis and characterizationTo understand how molecular parameters influence relaxivity,
we studied EuII-containing complexes 1–3 (Figure 1) and
supra-molecular inclusion complexes of complex 3 with b-cyclodex-trin (b-CD), poly-b-cyclodexb-cyclodex-trin (poly-b-CD), and human serum
albumin (HSA). Ligands for EuII-containing complexes 1 and 2
[a] C. U. Lenora, Prof. M. J. Allen
Department of Chemistry, Wayne State University 5101 Cass Avenue, Detroit, MI 48202 (USA) E-mail: [email protected] [b] Dr. F. Carniato, Prof. M. Botta
Dipartimento di Scienze e Innovazione Tecnologica Universit. del Piemonte Orientale “Amedeo Avogadro” Viale T. Michel 11, 15121 Alessandria (Italy)
E-mail: [email protected]
[c] Dr. Y. Shen, Dr. Z. Latif, Prof. E. M. Haacke Department of Radiology
Wayne State University School of Medicine 3990 John R Street, Detroit, MI 48201 (USA) [d] Dr. Z. Latif, Prof. E. M. Haacke, Prof. M. J. Allen
Barbara Ann Karmanos Cancer Institute 4100 John R Street, Detroit, MI 48201 (USA) [e] Dr. P. D. Martin
Lumigen Instrument Center, Chemistry Department Wayne State University
5101 Cass Avenue, Detroit, MI 48202 (USA)
Supporting information and the ORCID identification number(s) for the au-thor(s) of this article can be found under:
are commercially available, and the synthesis of ligand 7, which was used to form complex 3, is shown in Scheme 1. Briefly, 3-(biphenyl-4-yl)propane-1,2-diol was treated with methyl bromoacetate to obtain diacetate derivative 4 that was saponified then acidified to afford diacid 5. The diacid was converted into diamide 6 via stepwise reactions with thionyl chloride followed by diaza-18-crown-6. The diamide was
re-duced with borane-tetrahydrofuran (BH3·THF) complex to
afford ligand 7.
EuII-containing complexes 1–3 were prepared by mixing
li-gands and EuCl2in water followed by adjustment of pH to 7.4
with phosphate-buffered saline. Formation of complexes 1 and 2 were monitored using water-proton relaxation-rate enhance-ment. In this experiment, water-proton relaxation rate was measured as a function of the amount of metal added to a so-lution of ligand. Relaxation rate decreased with the addition of ligand up to a 1:1 ligand-to-metal ratio (Supporting Informa-tion, Figures S1 and S2), and after that point, the rate did not change (analysis of variance; ANOVA single factor analysis,
95% confidence interval). Because EuCl2and complexes 1 and
2 have different relaxivity values, these data suggest that in so-lution, complexes 1 and 2 exist as 1:1 ligand-to-metal com-plexes. However, the relaxivity of complex 3 is similar to that
of EuCl2, preventing the monitoring of the formation of
com-plex 3 via proton relaxation rate. Also, the UV/Vis absorption
profiles of complex 3 and EuCl2overlap, indicating that UV/Vis
spectroscopy does not provide useful information regarding
the formation of EuII-containing complex 3. Therefore, we used
inductively coupled plasma mass spectrometry (ICP-MS) to
in-vestigate the complexation of EuIIby cryptand 7 to form
com-plex 3. We prepared two samples of 7 and EuCl2 with
ligand-to-metal ratios of 1:2 and 1:1. Metal not bound to cryptand
was precipitated with phosphate-buffered saline,[5] and the
concentrations of Eu in the supernatants were measured using
ICP-MS. The metal concentrations after precipitation were con-sistent with the formation of 1:1 ligand-to-metal complexes, even in the presence of excess metal (Supporting Information, Table S1). Once complex formation was verified, we character-ized the complexes in the solid state and in solution.
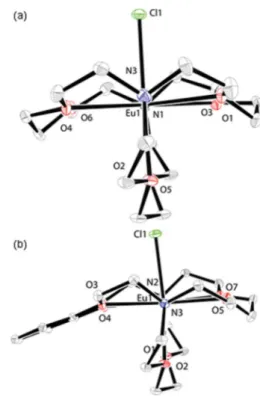
To study coordination environments in the solid state, we obtained X-ray crystal structures of 1 and 2. We were unable to grow X-ray quality crystals of complex 3. Complex 1 displays a coordination number of nine in an eclipsed hula-hoop
geom-etry (Figure 2a).[6]Eight coordination sites are occupied by the
six oxygen atoms and two nitrogen atoms of the cryptand, and the ninth coordination site is occupied by chloride. Simi-larly, the crystal structure of complex 2 features a
nine-coordi-nate eclipsed hula-hoop geometry (Figure 2b), where EuIIis
co-ordinated by six oxygen atoms and two nitrogen atoms from the cryptand and one chloride ion. These data indicate that in the solid state, 1 and 2 exist as 1:1 metal-to-ligand complexes, consistent with proton-relaxation-rate-enhancement measure-ments in solution. Additionally, the crystal structures provide valuable bond distances for modeling relaxometric properties in solution. Accordingly, we turned our attention to further studying the coordination environments of 1–3 in solution.
To investigate the coordination of chloride in solution, we measured the molar conductivity of complexes 1–3 in water. The molar conductivities of metal complexes 1, 2, and 3 were
177:3, 183:6, and 199: 4 S cm2mol@1, respectively. These
values are consistent with 2:1 dissociation in water,[7]indicating
that, on average, both chloride ions are dissociated from EuIIin
Figure 1. EuII-containing cryptates used in this study. Complexes are drawn
with two coordinated molecules of water, and counteranions are not shown for clarity.
Scheme 1. Synthesis of ligand 7.
Figure 2. Crystal structures of a) cryptate 1 (R-factor=0.0259, resolutio-n=0.75 a) and b) cryptate 2 (R-factor=0.0203, resolution=0.55 a). Ellipsoids are set at 50 % probability; hydrogen atoms and outer-sphere chloride coun-teranions are omitted for clarity.
solution. Further, 17O NMR line-broadening (Supporting
Infor-mation, Tables S2–S4) in the presence of EuII-containing
com-plexes is consistent with the presence of inner-sphere water, suggesting that chloride dissociation enables the coordination
of water. Both conductivity and 17O NMR data are consistent
with the presence of EuII-containing complexes that exist in
so-lution as nine-coordinate complexes with one inner-sphere water molecule, ten-coordinate complexes with two inner-sphere water molecules, or a mixture of nine- and ten-coordi-nate complexes. After studying the coordination environment
of EuII-containing cryptates 1–3 in solution, we focused on
studying the ability of the complexes to influence relaxation
enhancement. Because we expected EuII-containing complexes
to behave similarly to GdIII-containing complexes with respect
to relaxivity and because aggregation of small GdIII-containing
complexes results in increased positive relaxation
enhance-ment,[8] we studied the influence of concentration on
relaxa-tion-rate enhancement to determine if, and at what concentra-tion, aggregates form with complexes 1–3.
Aggregation studies
To determine whether relaxometric properties allude to the ag-gregation of complexes 1–3, longitudinal water-proton relaxa-tion rates were measured as a funcrelaxa-tion of concentrarelaxa-tion at 378C. For complexes 1 and 2, plots of relaxation rate versus concentration afforded linear regression lines (Figure 3). The
slopes of the lines afford relaxivities (2.1 and 3.7 mm@1s@1 for
complexes 1 and 2, respectively) that match reported values.[9]
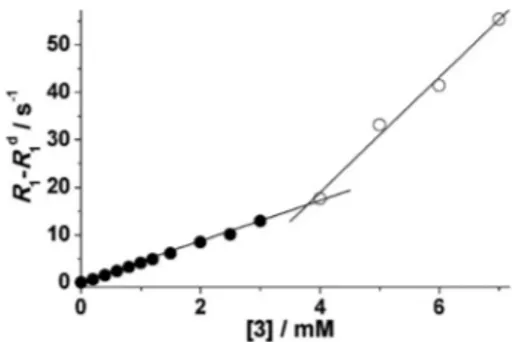
These values are also consistent with the relaxivities expected for low molecular weight chelates. Because the data in Figure 3 can be well-described by one line, it is unlikely that complexes 1 and 2 aggregate at concentrations below 10 mm. Unlike complexes 1 and 2, complex 3 showed an inflection point in the relaxation-rate profile around 3.8 mm (Figure 4). Below 3.8 mm, a linear relationship was observed with a
relax-ivity value of 4.3 mm@1s@1, as expected for complex 3.[9] A
change in the slope of the line was observed above 3.8 mm,
consistent with a higher relaxivity value of 12.1 mm@1s@1. This
change in slope is likely due to the formation of aggregates occurring through intermolecular hydrophobic interactions
be-tween biphenyl moieties. Aggregation increases the molecular tumbling time resulting in larger relaxivities, and these types of hydrophobic intermolecular interactions have been
ob-served with similarly functionalized GdIII-containing
comp-lexes.[8a,b] To further study the aggregation of complex 3,
dy-namic light scattering was performed at two different concen-trations (1 and 8 mm). The data (Supporting Information, Fig-ure S4) indicate that complex 3 aggregates at the higher con-centration (8 mm) but not at the lower concon-centration (1 mm). These data are consistent with and supports the relaxometric data. It has also been reported that aggregate formation leads to high-field bumps in nuclear magnetic relaxation dispersion
(NMRD) profiles and affects electronic relaxation parameters.[8b]
We used the results of these aggregation studies to avoid ag-gregation by performing all relaxometric characterizations, in-cluding binding-interaction studies of complex 3 with cyclo-dextrins and HSA, below the self-aggregation concentration of complex 3.
Formation of inclusion compounds of 3 with b-CD and poly-b-CD
The formation of host–guest non-covalent interactions be-tween suitably functionalized complexes and slowly tumbling substrates is a well-established approach to increase
relaxivi-ty.[10]The presence of the biphenyl moiety in 3 leads to an
in-teraction of the complex with the hydrophobic cavity of b-cy-clodextrin (b-CD). The binding interaction was investigated using the well-established proton-relaxation-enhancement
technique.[11]This technique consists in measuring the changes
of R1 of a solution of a complex as a function of increasing
concentrations of the host. With this method, the binding
pa-rameters KA, n (the number of equivalent and independent
binding sites), and r1b(the relaxivity of the final supramolecular adducts) can be evaluated. A dilute aqueous solution of 3 (0.9 mm) was titrated with b-CD, at 60 MHz and 310 K, and the
least-squares fit of R1versus the binding isotherm of b-CD
con-centration (Figure 5) provided the value of the affinity constant
[KA= (4.0: 0.2)V103Lmol@1] and the relaxivity of the adduct
(r1b= 8.7: 0.2 mm@1s@1). Upon binding of complex 3 with
b-CD, a relaxivity enhancement of 2.1V was observed (4.2 :0.1
and 8.7: 0.2 mm@1s@1for 3 and 3/b-CD, respectively). This
en-Figure 3. Water-proton relaxation rates (60 MHz, pH 7.4, 378C) versus con-centration of complexes 1 (*) and 2 (*). The solid lines are the linear best
fit (R2= 0.99).
Figure 4. Water-proton relaxation rates (60 MHz, pH 7.4, 378C) versus con-centration of complex 3. The solid lines are linear best fits (R2=0.99 for both
hancement of relaxivity (+ 107%) is likely an effect of the in-crease in rotational correlation time (tR) associated with the
in-crease in molecular weight.[10]This data led us to use 2.5
equiv-alents of b-CD for all further relaxometric studies of 3/b-CD to
favor (> 99% macromolecule-bound complex based on KA)
complex 3 being associated with b-CD.
A similar titration was performed to investigate the larger supramolecular assemblies formed by complex 3 with poly-b-cyclodextrin (poly-b-CD). A solution of complex 3 (1 mm) in phosphate-buffered saline was titrated with poly-b-CD, and re-laxation-rate enhancement was measured (Figure 6). The
poly-b-CD that was used had an average molecular weight of 19 kDa, corresponding to approximately 16 b-CD units, each of which can bind in principle one unit of complex 3. The poly-mer is characterized by nearly equivalent binding sites and, therefore, is expected to influence the rotational dynamics of each bound complex in an approximately equivalent manner. Data were fit to a simple model that considers the presence of n equivalent and independent binding sites, affording associa-tion constants and bound relaxivities. The best-fit of the data
was obtained with n=9 and a KA value of 2.4(:0.2) V
103Lmol@1, similar to the value found for the interaction with
b-CD. Association of complex 3 with poly-b-CD increased
relax-ivity from 4.2 to 12.5 mm@1s@1, which is an enhancement of
+198%, consistent with a pronounced decrease in molecular tumbling.[8a,10a,b, 12]This data led us to use one equivalent (with the assumption of nine binding sites per equivalent) of poly-b-CD for all further relaxometric studies of 3/poly-b-poly-b-CD to favor
(ca. 95% macromolecule-bound complex based on KA)
com-plex 3 being associated with poly-b-CD.
Interaction of 3 with HSA
In addition to forming inclusion complexes with cyclodextrins, the biphenyl group can promote non-covalent interactions with hydrophobic binding sites on HSA. Binding parameters for the interaction of 3 with HSA were determined using the
proton-relaxation-enhancement method by measuring R1 of a
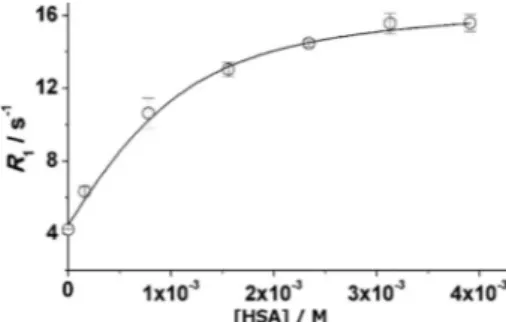
solution of complex 3 (1 mm) in phosphate-buffered saline as a function of protein concentration (Figure 7). The binding
in-teractions of complex 3 with HSA result in a large relaxivity
gain (from 4.2 to 16.6 mm@1s@1) that we primarily attribute to
the decrease of the rotational dynamics of the complex in the
adduct with the protein.[13] Analysis of the experimental data
was carried out assuming the presence of one class of equiva-lent and independent binding sites (n= 1), even though the presence of multiple sites with lower affinity on HSA cannot
be excluded.[14] In this way, we could estimate the value of
the thermodynamic association constant (KA= 2.7(:0.4) V
103Lmol@1), which is of the same order of magnitude as found
with b-CD and poly-b-CD. Consequently, this data led us to use eight equivalents of HSA for all further relaxometric studies of 3/HSA to favor (ca. 91% macromolecule-bound complex based
on KA) complex 3 being associated with HSA.
After characterizing EuII-containing complexes 1–3 and the
interactions of complex 3 with b-CD, poly-b-CD, and HSA, we studied the relaxometric behavior of those complexes and macromolecular systems at different field strengths.
Relaxometric characterization
To evaluate the molecular parameters that determine the
effi-ciency of the EuII-containing complexes as relaxation agents,
variable-field (0.00021 to 11.7 T) longitudinal1H-NMR relaxation
rates (NMRD profiles) were measured via fast-field-cycling
re-laxometry and variable-temperature17O NMR spectroscopy was
performed. The NMRD profiles of complexes 1–3 showed that relaxivity was in the order 3> 2> 1 at every field strength studied (Figure 8). The relaxivities of complexes 1–3 are high-est at low field strengths (<0.02 T), and there is a dispersion between 0.05 and 0.2 T. Around ultra-high fields (+7 T), the re-laxivities of complexes 1–3 increase from 3 to 7 T and then de-crease with increasing field strengths above 7 T. When complex Figure 5. Water-proton relaxation rates (60 MHz, pH 7.4, 378C) of solutions
of 3 (0.9 mm) as a function of the amount of b-CD. Error bars represent the standard error of the mean of three independently prepared samples.
Figure 6. Water-proton relaxation rates (60 MHz, pH 7.4, 378C) of solutions of 3 (1 mm) as a function of the amount of poly-b-CD. Error bars represent the standard error of the mean of three independently prepared samples.
Figure 7. Water-proton relaxation rates (60 MHz, pH 7.4, 378C) of solutions of 3 (1.0 mm) as a function of the concentration of HSA. Error bars represent the standard error of the mean of three independently prepared samples.
3 forms inclusion complexes with cyclodextrins or HSA, relaxiv-ity changes. The NMRD profiles of inclusion complexes 3/b-CD and 3/poly-b-CD indicate that these complexes possess higher relaxivities than complex 3 at all fields studied (Figure 8). Broad bumps in relaxivity peaking around 1 T were observed, and these relaxivities decreased at higher field strengths. When complex 3 interacted with HSA, relaxivity increased rela-tive to cyclodextrin-bound complexes below 7 T, with a narrow peak around 0.7 T. In the ultra-high field region, the relaxivity of 3/HSA was lower than that of 3/b-CD and 3/poly-b-CD.
The analysis of these NMRD profiles using the theory of par-amagnetic relaxation enables evaluation of the molecular rameters and elucidation of the relationship between these
pa-rameters and relaxivity. The field-dependence of r1arises from
modulation of magnetic dipolar interactions between metal ions and solvent nuclei. Modulation occurs either through chemical exchange between bound and bulk water molecules
(inner-sphere)[4a] or through long-range interactions with
outer-sphere water molecules that diffuse near the
paramag-netic ions (outer-sphere).[4a]Experimentally acquired data were
analyzed in terms of the Solomon–Bloembergen–Morgan equations and Freed’s model for the inner- and outer-sphere
contributions, respectively, to proton relaxivity.[4]In the relaxa-tion equarelaxa-tions, some parameters were set to known or reason-able values: water-coordination number (q), distance between
EuII ions and the nuclei of inner-sphere (r) and outer-sphere
water protons (a), and the diffusion coefficient (D). Moreover,
as a first approximation, the exchange lifetime tMwas set to
the value previously determined for 1 by Tjth, that is,298t
M=
3.2 ns.[15] Water-coordination numbers of complexes 1–3 were
assumed to be two (q =2) based on a ten-coordinate EuII
-con-taining cryptate that was recently reported with two
non-adja-cent water molecules.[16]Furthermore, the isomorphic SrII
ana-logue of complex 1 provides support of a water-coordination
number of two.[15]Another key parameter that is related to
co-ordinated water is the Eu@H distance between the EuII ions
and the proton of coordinated water molecules. This value was fixed to 3.2 a, which was obtained from a crystal structure of a
ten-coordinate EuII-containing cryptate with two non-adjacent
inner-sphere water molecules.[16] The Eu@H distance of 3.2 a
matches the value reported for another EuII-containing
com-plex (3.2 a for [EuDTPA(H2O)]3@
(DTPA=diethylenetriamine-N,N,N’,N’’,N’’-pentaacetate).[17] Furthermore, two other
parame-ters affecting the outer-sphere contributions to relaxivity are
the distance between EuIIions and the nuclei of outer-sphere
water protons, a, and the relative diffusion coefficient, D. The
value of a was set to 4.5 a based on the distance from EuIIto
the furthest ligand proton of crystal structure of complex 1. The diffusion coefficient D was fixed to the value for
[EuDTPA-(H2O)]3@.[17] The parameters q, r, a, and D were fixed to the
values mentioned above during the least-squares analyses of the NMRD profiles. In the analyses, the parameters of electron
relaxation, D2 and t
V, and the rotational correlation time, tR, were used as adjustable parameters. The results of the best-fit procedure are reported in Table 1.
More detailed information on the kinetics of water exchange
are obtained by measuring 17O NMR transverse relaxation rate
(R2) as a function of temperature, typically obtained at a
rela-Figure 8. NMRD profiles of solutions of 1 (*), 2 (&), 3 (^), 3/b-CD (*),
3/poly-b-CD (~), and 3/HAS (^) at pH 7.4 and 298 K. The solid lines were fitted
as-suming r=3.2 a, q=2, a=4.5 a, and D=23.0 V10@10m2s@1.
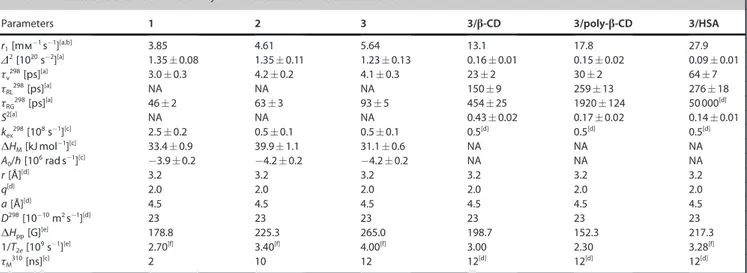
Table 1. Parameters relevant to the relaxivity of 1–3 and macromolecular adduct of 3.
Parameters 1 2 3 3/b-CD 3/poly-b-CD 3/HSA
r1[mm@1s@1][a,b] 3.85 4.61 5.64 13.1 17.8 27.9 D2[1020s@2][a] 1.35:0.08 1.35: 0.11 1.23:0.13 0.16:0.01 0.15:0.02 0.09 :0.01 tv298[ps][a] 3.0:0.3 4.2 :0.2 4.1 :0.3 23:2 30: 2 64:7 tRL298[ps][a] NA NA NA 150:9 259 :13 276: 18 tRG298[ps][a] 46:2 63 :3 93: 5 454:25 1920 :124 50000[d] S2[a] NA NA NA 0.43:0.02 0.17:0.02 0.14 :0.01 kex298[108s@1][c] 2.5:0.2 0.5 :0.1 0.5 :0.1 0.5[d] 0.5[d] 0.5[d] DHM[kJmol@1][c] 33.4:0.9 39.9: 1.1 31.1:0.6 NA NA NA A0/(h [106rad s@1][c] @3.9:0.2 @4.2 :0.2 @4.2:0.2 NA NA NA r [a][d] 3.2 3.2 3.2 3.2 3.2 3.2 q[d] 2.0 2.0 2.0 2.0 2.0 2.0 a [a][d] 4.5 4.5 4.5 4.5 4.5 4.5 D298[10@10m2s@1][d] 23 23 23 23 23 23 DHpp[G][e] 178.8 225.3 265.0 198.7 152.3 217.3 1/T2e[109s@1][e] 2.70[f] 3.40[f] 4.00[f] 3.00 2.30 3.28[f] tM310[ns][c] 2 10 12 12[d] 12[d] 12[d]
[a] Parameters obtained from NMRD fitting. [b] Relaxivity value measured at 20 MHz and 298 K. [c] Parameters obtained from17O NMR spectroscopy. [d]
Pa-rameters fixed during the fitting procedure. [e] PaPa-rameters obtained from X-band EPR spectroscopy at 110 K. [f] Values obtained from Ref. [18]. NA= not applicable.
tively high magnetic field strength (>4.7 T). The
temperature-dependence of R2 is described by the Swift–Connick
equa-tions.[19] These equations involve the bound-water residency
lifetime tM, electronic relaxation times T1eand T2e, the hyperfine coupling constant A0/(h, and q.
Water exchange
Variable-temperature 17O NMR relaxation rates, R
2p, for com-plexes 1–3 were measured at 9.4 T and pH 7.4. The data are
often reported as reduced transverse relaxation rates, R2r,
de-fined as 1/T2r= R2r=R2p/pM, where pM is the molar fraction of
inner-sphere water molecules. The reduced transverse 17O
re-laxation rates measured for EuII-containing complexes 1, 2, and
3 are presented in Figure 9. The sign of the temperature
de-pendence of 1/T2r depends on whether the transverse
relaxa-tion is dominated by tM, which increases with decreasing
tem-perature, or by the transverse relaxation time of the
inner-sphere water molecules, T2m, which increases with increasing
temperature. For the complexes 1, 2, and 3, 1/T2r increases
with decreasing temperature over the temperature range stud-ied, indicating short residence times for inner-sphere water molecules in these complexes. Thus, all three complexes can be considered to be in the fast-exchange regime for water ex-change.
The kexvalue of 1 is consistent with the previously reported
value, obtained from a variable-temperature and pressure
17O NMR study at 9.4 T.[15]The rates of water exchange of
com-plexes 2 and 3 are quite comparable with each other, with dif-ferences of the order of experimental error. Compared to the value of 1, the rates for complexes 2 and 3 are slower by a factor of 5. Although the parameters are affected by a non-negligible uncertainty owing to the accuracy of the measure-ments in the case of low-concentration solutions, the increase in the residency times of the inner-sphere water molecules for
complexes 2 (tM298=20 ns) and 3 (tM298= 20 ns) relative to 1
(tM298= 4 ns) appears to be significant. A well-known complex,
investigated in detail, is [Gd(EGTA)(H2O)]@(EGTA=
3,12-bis(car-boxymethyl)-6,9-dioxa-3,12-diazatetradecanedioate) for which
it has been reported a tM of 30 ns (at 298 K), a surprisingly
short value for a q =1 GdIII-containing complex of a
poly(ami-nocarboxylic) ligand.[20] Two derivatives of [Gd(EGTA)(H
2O)]@ functionalized with benzene or naphthalene moieties fused to the oxyethylene bridges were synthesized and their
relaxomet-ric properties studied.[21] The k
ex values were found to be
roughly twice as high as the corresponding value of
[Gd(EG-TA)(H2O)]@,[22] an opposite trend to that measured for
com-plexes 1–3. In the absence of variable-pressure 17O NMR data
that can provide information on the mechanism of the ex-change process, we can only suggest a plausible hypothesis of
this trend. For [Gd(EGTA)(H2O)]@, the mechanism of exchange
is dissociative: The faster rate of water exchange measured for the functionalized derivatives was rationalized in terms of a higher steric crowding of the aromatic moiety relative to the ethylene group, inducing a destabilization of the bound water molecule and thus a decrease in its mean residency lifetime. On the other hand, water exchange for 1 was found to
pro-ceed via an interchange mechanism,[15]which implies that the
incoming water molecule also participates in the rate-deter-mining step. Therefore, the introduction of hydrophobic func-tional groups can perturb the solvation shell of the complex close to the water coordination sites and make the exchange process slower (longer tM).
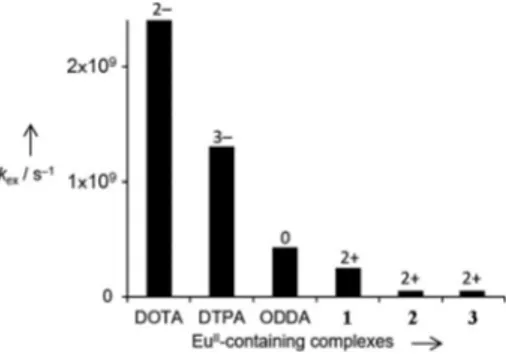
To explore the influence of charge on water-exchange rate, the water-exchange rates of complexes 1–3 were compared
with other EuII-containing complexes (Figure 10). Two
com-plexes are anionic and have in common the presence of one coordinated water molecule. One is neutral (EuODDA; q =1) (ODDA =1,14,10,13-tetraoxa-7,16-diazacyclooctadecane-7,16-di-acetate), and 1–3 are cationic with q=2. The number and the
type of EuII-containing complexes are limited, making it
impos-sible to draw firm conclusions; however, the impact of the global electric charge appears to have a predominant role on
water-exchange rate, as observed with GdIII-containing
com-plexes.[23]Anionic complexes exhibit significantly faster rates of exchange relative to that of the neutral complex, and the
cat-ionic chelates have even slower values of kex. On the other
hand, the kex values of the EuII-containing complexes cover a
much more limited range than that characteristic of GdIII
che-lates, that is, two orders of magnitude instead of five. At least
partially, the faster rates of exchange of the EuII-containing
complexes compared to those of GdIIIcan be attributed to the
lower charge density and longer metal-coordinated water dis-tance. Both parameters are more favorable for fast water ex-change with EuIIrelative to GdIII.[24]
Figure 9. Temperature dependence of reduced transverse17O NMR
relaxa-tion rates of 1 (*), 2 (&), and 3 (^) at 9.4 T and pH 7.4. The solid lines are the
best fits of the experimental data points.
Figure 10. Water-exchange rate of anionic, neutral, and cationic EuII
-contain-ing complexes. Data for EuII-containing complexes of DOTA,[3b]DTPA,[25]and
Because of the short tM values, complexes 1–3 are in the fast-exchange regime, where this parameter does not influence or limit relaxivity. The same condition occurs for the macromo-lecular adducts of 3. Plots of the temperature-dependence of
1H relaxivity, determined at 9.4 T in the range of 288 to 318 K
(Supporting Information, Figure S7), show that r1 decreases
with increasing temperature for all the systems. These results indicate that the inclusion complexes of 3 are in the fast water-exchange regime over the entire temperature range studied.
Electronic relaxation time
Electronic relaxation is characterized by two parameters: the trace of the square of the transient zero field splitting (ZFS)
tensor, D2, and the correlation time that describes the
modula-tion of the ZFS, tV. In the least-squares fitting procedure, these parameters are essentially determined from NMRD profiles.
The values of D2and t
Vof complexes 1–3 are similar to those
reported for [EuII(H
2O)8]2+ and to each other.[26] As noted by
Tjth and co-workers, this is a different behavior from GdIII
-con-taining complexes for which, typically, electron spin relaxation is slower after the aqua ion is chelated.[27]
Unlike GdIII-containing chelates, 1/T
1e cannot be considered
negligible compared to 1/tR. Therefore, electronic relaxation
can limit relaxivity at typical imaging fields, even for
low-mo-lecular-weight EuII-containing complexes. For example, in the
case of complex 3, 1/T1econtributes to the value of 1/tCabout
40% at 0.5 T and 4.5 % at 3 T (Supporting Information, Fig-ure S8). The contribution becomes negligible in the ultra-high field range (<1% at 7 T). This influence, albeit limited, of the electronic relaxation time on relaxivity might explain the small bump near 7 T, observable in NMRD profiles of 1–3. The
X-band EPR spectra of 1–3 were recorded at 110 K.[18] The
X-band (0.34 T) line width (DHpp, G) values show a slight increase
from 1 to 3, reflecting small difference in their electronic
relax-ation times. From the bandwidth, the T2e values were
calculat-ed (Table 1), using simplifications introduccalculat-ed by Reuben and
adapted by Merbach.[28] The T
2e values compare favorably to
the values estimated from fitting the NMRD profiles using the
Morgan equation.[4]
In the analysis of 3/b-CD, 3/poly-b-CD, and 3/HSA, the pa-rameters for electronic relaxation were used as empirical fitting parameters and do not have precise physical meanings for
these slowly tumbling systems.[29]
Rotational correlation time
In the clinically relevant region of proton Larmor frequencies (>10 MHz), rotational correlation represents the limiting factor of relaxivity. This relationship implies that the overall
correla-tion time, tC, is largely dominated by the rotational correlation
time and that the contribution of both the exchange lifetime and the electronic relaxation can be safely neglected. Because
tRis roughly proportional to the molecular weight of EuII
-con-taining chelates, a linear dependence of tRon the molecular
masses of the complexes should exist. A plot of the tRvalues
of 1–3 (Table 1) as a function of molecular mass yields a
straight line (R2=0.987). This linear behavior implies that the
outer-sphere contribution to r1is nearly identical for the three
complexes. In comparison to low-molecular-weight GdIII
-con-taining complexes, the tRvalues are slightly shorter, even
ac-counting for the larger size of EuIIrelative to GdIII.[4a,17]This dis-crepancy might arise, in part, from the choice of the distance value r. For example, if the value of r is fixed to 3.3 instead of
3.2, then the tRvalue of 2, which has the same molecular mass
as [Gd(DOTA)(H2O)]@(tR= 66 ps),[30]increases from 63 to 75 ps. Additionally, a different solvation sphere due to the different charge densities of the two ions might contribute to the differ-ences in rotational correlation times.
The presence of a biphenyl group in complex 3 facilitates the formation of adducts with cyclodextrins and HSA, and the rotational correlation time of those adducts was also studied. To obtain information regarding the rotational dynamics of the
inclusion complexes of 3, the Lipari–Szabo model was used.[31]
This model-free approach considers the occurrence of an
inter-nal rotation, characterized by a correlation time tRL,
superim-posed on a global motion described in terms of the correlation
time tRG. The degree of correlation between the two types of
motion is described by the parameter S2 that assumes the
value of zero when the two motions are completely independ-ent; in the absence of local fluctuations, the complex is
immo-bilized, the motion is isotropic, and S2=1. In complex 3, the
bi-phenyl moiety is connected to the cryptand through a methyl-ene group that can freely rotate causing local rotation super-imposed to global tumbling motion of the complex. Therefore, a five-parameter (D2, t
V, tRL, tRG, and S2) least-squares fit of the data was performed (Table 1).
The global rotational correlation times of complexes 1–3 and of cyclodextrins and HSA bound to complex 3 (Table 1) correlate with the molecular weights of the molecules, where increasing molecular weight roughly correlates with increasing rotational correlation time.
The marked decrease in molecular tumbling following the formation of the supramolecular adducts is signaled by the for-mation of broad relaxivity peaks in the high field region of the NMRD profiles, distinctive of slowly rotating systems. However, an increase of the local rotational flexibility of the metal com-plex at the binding site is highlighted by the increasing differ-ence between the local and global values of the rotational cor-relation times, which limits the relaxivity. This local rotational
flexibility is also shown by the decrease of S2 from 0.43 for 3/
b-CD to 0.14 for 3/HSA. The S2 obtained for complex 3/b-CD
indicates that the inclusion complex prevents internal rotation to some extent. This observation is further evidenced by global rotational correlation time of 3/b-CD being only 3.0 times longer than the local rotational correlation time. The re-laxivity enhancement of 2.1 times (at 1.5 T) observed upon for-mation of inclusion complexes between complex 3 and b-CD further supports the presence of a rigid adduct with restricted internal rotation in 3/b-CD. As expected, an even larger in-crease in rotational correlation time was observed when com-plex 3 was mixed with poly-b-CD. The larger difference be-tween local and global rotations of the macrocyclic complex 3/
poly-b-CD and the lower value of the order parameter S2 indi-cate a higher degree of rotational flexibility than 3/b-CD. Be-cause of internal rotation, the relaxivity enhancement observed in 3/poly-b-CD at 1.4 T is only 3.5 despite the global rotational correlation time of 3/poly-b-CD being 20 times longer than that of complex 3.
The biphenyl moiety in complex 3 also interacts with HSA to yield an increase in global rotational correlation time. However, this slowdown in molecular motion is partly offset by the high degree of local motion: The relaxivity enhancement of
com-plex 3 obtained upon binding with HSA (20.9 mm@1s@1, 1.4 T)
is only 3.9 times that of complex 3. Therefore, the relaxivity of the adduct is primarily limited by the poor correlation between global and local motions. A more restricted local rotation of the complex at the binding site of the protein would favor a larger enhancement of relaxivity. It has to be noted that the fit-ting (continuous lines in Figure 8) was restricted to frequencies above 3 MHz because of the inadequacy of Solomon–Bloem-bergen–Morgan theory for the description of the rotational dy-namics of slow-rotating systems at low magnetic field strengths.
Conclusion
The present study describes a detailed analysis of the contribu-tion of molecular parameters (water-exchange rate, electronic relaxation time, and rotational correlation time) to the
relaxivi-ty of EuII-containing cryptates over a wide range of field
strengths using1H NMR,17O NMR, and EPR spectroscopy.
The results reported here demonstrate for the first time that it is possible to achieve a high relaxivity enhancement through
non-covalent interactions between suitably functionalized EuII
-containing complexes and slowly tumbling substrates like b-CD, poly-b-b-CD, and HSA. Similarly to the case of well-known
GdIII-based complexes, the relaxivities of rapidly rotating EuII
chelates are essentially limited by the value of the rotational
correlation time. A lengthening of tRcauses a considerable
in-crease in the longitudinal relaxation rate of water protons.
However, unlike what is often observed in the case of GdIII
-based complexes, the slow exchange process of the bound water molecules does not hamper the increase in relaxivity at the imaging fields of the supramolecular adducts. This is
be-cause the EuIIcomplexes investigated to date have solvent
ex-change rates values in the range necessary to achieve high re-laxivity. This property, in the case of macromolecular systems,
largely compensates for the negative effect on r1of a greater
distance between the water protons and the paramagnetic ion, thus enabling relaxivity values comparable to those of the
analogous GdIII-based systems.
Despite these interesting and encouraging results, the number and type of complexes studied is limited and there is
a need to expand the available library of EuII-based systems to
obtain more in-depth information on the correlation between solution structure and molecular relaxation parameters. How-ever, these preliminary results clearly indicate that in the case
of EuII-containing complexes, it is possible to design and
devel-op highly sensitive macromolecular or nanosized probes for advanced MRI applications.
Experimental Section
Commercially available chemicals were of reagent-grade purity or better and were used without further purification unless otherwise stated. Water was purified using a PURELAB Ultra Mk2 water purifi-cation system (ELGA) and degassed under reduced pressure prior to use. 3-(Biphenyl-4-yl)propane-1,2-diol was synthesized according to a reported procedure.[9] Analytical thin-layer chromatography
(TLC) was carried out on ASTM TLC plates precoated with silica gel 60 F254 (250 mm layer thickness). TLC visualization was
accom-plished using a UV lamp followed by charring with potassium per-manganate stain (3 g KMnO4, 20 g K2CO3, 5 mL 5% w/v aqueous
NaOH, 300 mL H2O). Flash chromatography was performed using
silica gel 60, 230–400 mesh (EMD chemicals). 1H NMR, correlation
spectroscopy (COSY),13C NMR, distortionless enhancement by
po-larization transfer (DEPT), and heteronuclear multiple quantum co-herence (HMQC) spectra were obtained using an MR400 (9.4 T) or V500 (11.7 T) spectrometers. Peaks were assigned using DEPT, COSY, and HMQC spectra or by comparison with reported spec-tra.[9] Chemical shifts are reported relative to residual solvent
sig-nals (CD3CN:1H: d=1.94 ppm;13C: d=1.32 ppm).1H-NMR data are
assumed to be first order, and the apparent multiplicity is reported as “s”=singlet, “d”=doublet, “dd”=doublet of doublet, “ddd”= doublet of doublet of doublets, “m”=multiplet, and “brs”=broad singlet. Italicized elements are those that are responsible for the shifts. High-resolution electrospray ionization mass spectra (HRE-SIMS) were obtained using an electrospray time-of-flight high-reso-lution Waters Micromass LCT Premier XE mass spectrometer. Determination of Eu concentration: The concentrations of Eu were determined using ICP-MS or energy- dispersive X-ray fluores-cence (EDXF) spectroscopy. Samples for ICP-MS were diluted using aqueous nitric acid (2%). Standard solutions were prepared by serial dilution of a commercially available standard (Eu2O3in
aque-ous nitric acid (5%) 1000 ppm, Alfa Aesar). Calibration curves were generated using the 153Eu isotope ion counts for a 10–100 ppb
concentration range. ICP-MS analyses were performed using an Agilent Technologies 7700V ICP-MS instrument in the Lumigen In-strument Center of Wayne State University. EDXF measurements were performed with a Shimadzu EDX-7000 spectrometer. Calibra-tion curves were generated using fluorescence intensity at 5.845 keV for a 250–1000 ppm concentration range.
Determination of longitudinal proton relaxation times: Longitu-dinal proton relaxation times were measured using six different in-struments. A Bruker minispec was used at 1.4 T and 378C using an inversion recovery technique. NMRD profiles were measured at 25
oC over a continuum of magnetic fields from 0.0002 to 0.2 T on a
fast field-cycling Stelar SmartTracer relaxometer, and data points at high field strengths were measured on a Stelar Spinmaster relax-ometer (0.5–1.6 T) equipped with a BrukerWP80 magnet. Suscepti-bility weighted imaging (SWI) was performed to acquire relaxivity data at 3 T (Siemens TRIO) and 7 T (Clinscan). Multiple flip angles (5, 10, 15, 20, 25, and 308) were used in the SWI experiment to allow for the determination of T1 following a reported
proce-dure.[32] MR images were processed using SPIN (SVN Revision
1757), and Matlab (T.12.0.635 R2011a) was used to calculate effec-tive transverse relaxation times, T2*, and corrected T1 maps. Data
points at 9.4 and 11.7 T were measured using inverse recovery methods with Varian unity 400 and Varian 500S instruments.
Variable-temperature 17O NMR spectroscopy:
Variable-tempera-ture17O NMR measurements were performed using a Varian-500S
(9.4 T) spectrometer for samples of 1 (5 mm), 2 (5 mm), and 3 (1.2 mm) in buffered saline, with a blank of phosphate-buffered saline (pH 7.4) with 1% 17O-enriched water (diluted from
20% enriched H217O). Transverse relaxation rates were calculated
from line widths at half height following a reported procedure.[9]
EPR spectroscopy: EPR spectroscopy was performed on a Bruker EMX X-band spectrometer equipped with an Oxford variable-tem-perature cryostat. EPR samples were prepared and sealed under an atmosphere of N2in Norell SEPR250S EPR tubes and were frozen in
liquid N2before insertion into the sample cavity. EPR spectra of 3/
b-CD and 3/poly-b-CD were acquired at 110 K (Figures S5 and S6). Acquisition parameters included a microwave frequency of 9.38 GHz, a microwave power of 1.99 mW, a modulation frequency of 100 kHz, a receiver gain of 30 dB, and a modulation amplitude of 4.0 G.
Molar conductivity measurements: Molar conductivity measure-ments were carried out using an Omega CDH 280 portable con-ductivity meter that was calibrated with aqueous KCl (0.01m, 1.413 mScm@1). Conductivity values were calculated from three
in-dependently prepared solutions of metal complexes (1.00 mm, 4.00 mL) measured in water under an atmosphere of N2at ambient
temperature. Results are reported as mean:standard error of three independently prepared samples.
Dynamic light scattering measurements: Dynamic light scattering data were obtained using a Malvern Zetasizer Nano-ZS instrument (ZEN3600) operating with a 633 nm wavelength laser. Dust was re-moved from samples by filtering through 0.2 mm hydrophilic filters. Samples of complex 3 (1 and 8 mm in phosphate-buffered saline) were prepared in air-tight cuvettes inside a wet glove box under an atmosphere of N2.
Dimethyl-2,2’-({[1,1’-biphenyl]-4-yl}propane-1,2-dily)bis(oxy) di-acetate (4): NaH (58% in oil, 1.45 g, 35.0 mmol, 4 equiv) was added to a solution of 3-(biphenyl-4-yl)propane-1,2-diol (2.00 g, 8.76 mmol, 1 equiv) in anhydrous tetrahydrofuran (15 mL) under an atmosphere of Ar at ambient temperature, followed by the dropwise addition of methyl bromoacetate (6.60 mL, 70.1 mmol, 8 equiv). The resulting reaction mixture was stirred at ambient temperature for 22 h, and excess NaH was quenched with metha-nol (3 mL). Solvents were removed under reduced pressure, and the resulting residue was extracted with diethyl ether (5V30 mL). Purification was performed using silica gel chromatography (5:1 hexanes/ethyl acetate) to yield 2.31 g (71%) of 4 as a colorless oil. TLC: Rf=0.20 (3:1 hexanes/ethyl acetate); 1H NMR (400 MHz, CD3CN): d=2.90 (d,3J (H,H)=4.0 Hz, 2H; CH2), 3.56 (ddd,3J (H,H)= 4.0, 12.0, 40.0 Hz, 2H; CH2CH), 3.66 (s, 3H; CH3), 3.68 (s, 3H; CH3), 3.80–3.87 (m, 1H; CHCH2), 4.09 (s, 2H; CH2C=O), 4.18 (s, 2H; CH2C= O), 7.31–7.66 ppm (m, 9H; CHCH);13C NMR (101 MHz, CD 3CN): d= 37.8 (CH2), 52.1 (CH3), 68.0 (CH2C=O), 69.1 (CH2C=O), 73.5 (CH2CH), 81.0 (CHCH2), 127.6 (CHCH), 127.7 (CHCH), 128.2 (CHCH), 129.8 (CHCH), 131.0 (CHCH), 131.4 (CHCH), 138.6, 139.7, 141.6, 171.6, 171.8 ppm; HRESIMS (m/z): [M++Na]+ calcd for C
21H24O6Na,
395.1471; found, 395.1477.
2,2’-(3-{[1,1’-Biphenyl]-4-yl}propane-1,2-dily)bis(oxy) diacetic acid (5): LiOH (1.03 g, 43.0 mmol, 8 equiv) was added to a solution of 4 (2.00 g, 5.38 mmol, 1 equiv) in methanol (9 mL) and water (3 mL), and the reaction mixture was stirred at ambient tempera-ture for 6 h. The resulting yellow solution was concentrated under reduced pressure, and the residue was dissolved in water (8 mL) and acidified with HCl (6m, 3 mL). The resulting white solid was collected by filtering, washed with water (15 mL), and dried under reduced pressure to yield 1.85 g (quantitative) of 5 as a white
solid.1H NMR (400 MHz, CD 3CN): d=2.88 (dd,3J (H,H)=2.0, 6.4 Hz, 2H; CH2), 3.47–3.68 (m, 2H; CH2), 3.83–3.91 (m, 1H; CH), 4.03–4.19 (m, 4H; CH2), 7.29–7.69 (m, 9H; CHCH), 9.60 ppm (brs, 2H; OH); 13C NMR (101 MHz, CD 3CN): d=37.7 (CH2), 68.2 (CH2), 68.7 (CH2), 73.9 (CH2), 82.0 (CH), 127.7 (CHCH), 127.8 (CHCH), 128.3 (CHCH), 129.9 (CHCH), 131.1 (CHCH), 138.0, 140.0, 141.5, 171.8, 172.2 ppm; HERESIMS
(m/z): [M++Na]+calcd for C
19H20O6Na, 367.1158; found, 367.1148.
5-([1,1’-Biphenyl]-4-ylmethyl)-4,7,13,16,21,24-hexaoxa-1,10-di-azabicyclo[8.8.8]hexacosane-2,9-dione (6): Thionyl chloride (3.60 mL, 49.4 mmol, 10 equiv) was added to 5 (1.70 g, 4.94 mmol, 1 equiv), and the resulting solution was heated at reflux for 3 h under an atmosphere of Ar. The reaction mixture was concentrated under reduced pressure to obtain a yellow oil that was dissolved in anhydrous toluene (150 mL) under an atmosphere Ar. To a sepa-rate solution of 4,13-diaza-18-crown-6-ether (1.30 g, 4.94 mmol, 1 equiv) in anhydrous toluene (150 mL) was added triethylamine (2.00 mL, 14.8 mmol, 3 equiv), and the resulting solution was stirred for 15 min. The two solutions were added simultaneously over 60 min to anhydrous toluene (300 mL) at 0–58C. The resulting mixture was stirred for 24 h while allowing to warm to ambient temperature. Solvent was removed under reduced pressure, and the residue was extracted with CH2Cl2(5V10 mL). Purification was
performed using silica gel chromatography (10:1 CH2Cl2/methanol)
to yield 1.46 g (52%) of 6 as a yellow oil. TLC: Rf=0.32 (10:1
CH2Cl2/methanol); 1H-NMR (400 MHz, CD3CN): d=2.60–3.10 (m, 5H; CH2), 3.20–4.80 (m, 28H, CH and CH2), 7.20–7.70 ppm (m, 9H; CH); 13C NMR (101 MHz, CD 3CN): d=37.2 (CH2), 37.4 (CH2), 37.7 (CH2), 38.0 (CH2), 47.3 (CH2), 47.7 (CH2), 48.2 (CH2), 48.3 (CH2), 48.4 (CH2), 49.0 (CH2), 49.1(CH2), 49.3 (CH2), 49.35 (CH2) 49.4 (CH2), 49.6 (CH2), 49.65 (CH2) 49.7 (CH2), 49.8 (CH2), 49.9 (CH2), 68.7 (CH2), 69.2 (CH2), 69.3 (CH2), 69.7 (CH2), 69.8 (CH2), 69.9 (CH2), 70.0 (CH2), 70.1 (CH2), 70.2 (CH2), 70.3 (CH2), 70.4 (CH2), 70.9 (CH2), 71.0 (CH2),71.1 (CH2), 71.28 (CH2), 71.3 (CH2), 71.4 (CH2), 71.6 (CH2), 71.7 (CH2), 71.8 (CH2), 71.9 (CH2), 72.0 (CH2), 72.1 (CH2), 72.2 (CH2), 72.4 (CH2), 73.6 (CH2), 73.7 (CH2), 74.9 (CH2), 78.6 (CH), 79.7 (CH), 81.6 (CH), 82.7 (CH), 127.5 (CHCH), 128.0 (CHCH), 129.7 (CHCH), 130.7 (CHCH), 130.8 (CHCH), 138.5, 139.6, 141.4, 169.5, 169.6 ppm; HRESIMS (m/z): [M++H]+calcd for C 31H43N2O8, 571.3019; found 571.3012. 5-([1,1’-Biphenyl]-4-ylmethyl)-4,7,13,16,21,24-hexaoxa-1,10-di-azabicyclo[8.8.8]hexacosane (7): Borane–tetrahydrofuran complex (14 mL, 14 mmol, 1m in tetrahydrofuran, 10 equiv) was added to a solution of 6 (0.800 g, 1.40 mmol, 1 equiv) in anhydrous tetrahy-drofuran under an atmosphere of Ar at 08C in a drop-wise manner, and the resulting mixture was heated at reflux for 24 h before the reaction mixture was allowed to cool to ambient temperature. Aqueous HCl (6m, 14 mL) was added to the reaction mixture, and the mixture was heated at reflux for 4 h. The pH of the reaction so-lution was adjusted to 11 by adding concentrated ammonium hy-droxide (20 mL). The resulting solution was concentrated under re-duced pressure to obtain white solid that was purified using silica gel chromatography (20:1 CH2Cl2/methanol) to yield 0.5 g (66%) of
7 as a yellow oil. TLC: Rf=0.23 (10:1 CH2Cl2/methanol); 1H-NMR
(400 MHz, CD3CN): d=2.55–2.88 (m, 10H; CH2), 3.03–3.11 (m, 1H; CH2), 3.32–3.82 (m, 26H; CH and CH2), 7.30–7.66 ppm (m, 9H; CH); 13C NMR (101 MHz, CD 3CN): d=38.4 (CH2), 53.4 (CH2), 53.5 (CH2), 53.7 (CH2), 53.8 (CH2), 54.1 (CH2), 54.3 (CH2), 66.1 (CH2), 68.0 (CH2), 68.1 (CH2), 68.57 (CH2), 68.59 (CH2), 68.8 (CH2), 68.9 (CH2), 69.2 (CH2), 69.6 (CH2), 71.4 (CH2), 79.4 (CH), 126.7 (CH), 127.7 (CH), 127.8 (CH), 128.3 (CH), 129.2 (CH), 129.9 (CH), 131.0 (CH), 138.4, 139.6, 141.5 ppm; HRESIMS (m/z): [M++H]+ calcd for C
31H47N2O6, 543.3434;
Metal complexes 1–3: Metal complexes 1–3 were prepared ac-cording to reported procedures,[9]using a wet glove box under an
atmosphere of N2using degassed water. The resulting EuII
-contain-ing complexes were in phosphate-buffered saline (11.9 mm phos-phates, 2.7 mm potassium chloride, 137 mm sodium chloride, pH 7.4). Samples for NMRD measurements or long-term studies were flame sealed, and samples for other NMR and EPR experi-ments were sealed using paraffin wax and used immediately. For NMRD measurements, macromolecules (b-CD, poly-b-CD, and HSA) were used in the blanks and the concentration of macromolecule in each sample was kept constant: 2.5, 1.0, and 4.0 mm for b-CD, poly-b-CD, and HSA, respectively.
To study the stability of complex 2 in phosphate-buffered saline, an aliquot (300 mL) of a solution of complex 2 in phosphate-buf-fered saline was flame sealed in an NMR tube under an atmos-phere of N2. The relaxivity of this sample was measured (60 MHz,
378C) over the course of one month and was triplicated with inde-pendently prepared samples (Supporting Information, Figure S3). No change in relaxivity was observed, indicating that any competi-tion between phosphate and the cryptand in 2 was below the de-tection limit of the technique.
X-ray quality crystals of EuII-containing complexes were obtained
by vapor diffusion. A solution of metal complex was prepared by dissolving EuCl2 and ligand in methanol under an inert
atmos-phere. The resulting clear solution was stirred for 1 h then filtered through a 0.2 mm hydrophilic filter. Tetrahydrofuran was diffused into the filtrate to obtain needle-like crystals. Crystal structure anal-yses were performed on a Bruker APEX-II Kappa geometry diffrac-tometer with Mo radiation and a graphite monochromator using a Bruker-charge-coupled-device-based diffractometer equipped with an Oxford Cryostream low-temperature apparatus. Data were ac-quired at 100 K. Structures were solved by the direct method using the SHELXS-97 program that is part of APEX II2 and refined by the least squares method, SHELXL 2012 incorporated into ShelXle.[33]
Single crystals of 1 contained one cation of 1 with one chloride, and no water molecules bound, one non-covalent chloride coun-terion, and one non-covalent molecule of water in the asymmetric unit. The structure of 1 was solved with a resolution of 0.75 a in space group P21/c. Single crystals of 2 contained one cation of 2
with one bound chloride, no water molecules bound, and one non-covalent molecule of water in the asymmetric unit. The struc-ture of 2 was solved with a resolution of 0.55 a in space group P21/c. All non-hydrogen atoms were refined anisotropically.
CCDC 1549045 and 1549046 contain the supplementary crystallo-graphic data for this paper. These data can be obtained free of charge from The Cambridge Crystallographic Data Centre.
Acknowledgements
This work was supported by the National Institutes of Health (R01EB013663). M.B. and F.C. are grateful to Universit/ del Pie-monte Orientale for financial support (Ricerca locale 2016). The authors thank Dr. Derek J. Averill from Shimadzu Scientific In-struments for use of the EDXF spectrometer, Prof. Jeremy Ko-danko for use of the conductivity meter, and Levi Ekanger for assistance acquiring EPR spectra.
Conflict of interest
The authors declare no conflict of interest.
Keywords: cryptands · cyclodextrins · europium · lanthanides · magnetic resonance imaging
[1] a) G. Radecki, R. Nargeot, I. O. Jelescu, D. Le Bihan, L. Ciobanu, Proc. Natl. Acad. Sci. USA 2014, 111, 8667 – 8672; b) S. J. van Veluw, J. J. M. Zwanenburg, J. Engelen-Lee, W. G. M. Spliet, J. Hendrikse, P. R. Luijten, G. J. Biessels, J. Cereb. Blood Flow Metab. 2013, 33, 322– 329; c) B. L. van de Bank, I. J. Voogt, M. Italiaander, B. L. Stehouwer, V. O. Boer, P. R. Luijt-en, D. W. J. Klomp, NMR Biomed. 2013, 26, 367– 375.
[2] a) E. Boros, M. Polasek, Z. Zhang, P. Caravan, J. Am. Chem. Soc. 2012, 134, 19858 –19868; b) S. Laus, R. Ruloff, P. Tjth, A. E. Merbach, Chem. Eur. J. 2003, 9, 3555 –3566; c) S. R. Banerjee, E. J. Ngen, M. W. Rotz, S. Kakkad, A. Lisok, R. Pracitto, M. Pullambhatla, Z. Chen, T. Shah, D. Arte-mov, T. J. Meade, Z. M. Bhujwalla, M. G. Pomper, Angew. Chem. Int. Ed. 2015, 54, 10778 –10782; Angew. Chem. 2015, 127, 10928 –10932; d) S. Aime, M. Botta, S. G. Crich, G. Giovenzana, R. Pagliarin, M. Sisti, E. Terre-no, Magn. Reson. Chem. 1998, 36, S200– S208; e) S. Laurent, L. V. Elst, R. N. Muller, Contrast Media Mol. Imaging 2006, 1, 128–137.
[3] a) L. A. Ekanger, L. A. Polin, Y. Shen, E. M. Haacke, P. D. Martin, M. J. Allen, Angew. Chem. Int. Ed. 2015, 54, 14398–14401; Angew. Chem. 2015, 127, 14606 – 14609; b) L. Burai, P. Tjth, G. E. Moreau, A. Sour, R. Scopelliti, A. E. Merbach, Chem. Eur. J. 2003, 9, 1394 –1404; c) L. A. Ekanger, M. M. Ali, M. J. Allen, Chem. Commun. 2014, 50, 14835– 14838; d) M. Regueiro-Figueroa, J. L. Barriada, A. Pallier, D. Esteban-Gjmaz, A. D. Blas, T. Rodr&guez-Blas, P. Tjth, C. Platas-Iglesias, Inorg. Chem. 2015, 54, 4940 – 4952; e) L. A. Ekanger, D. R. Mills, M. M. Ali, L. A. Polin, Y. Shen, E. M. Haacke, M. J. Allen, Inorg. Chem. 2016, 55, 9981 –9988; f) L. A. Ekanger, L. A. Polin, E. M. Haacke, M. J. Allen, Contrast Media Mol. Imaging 2016, 11, 299– 303; g) N.-D. H. Gamage, Y. Mei, J. Garcia, M. J. Allen, Angew. Chem. Int. Ed. 2010, 49, 8923– 8925; Angew. Chem. 2010, 122, 9107 –9109; h) L. A. Basal, Y. Yan, Y. Shen, E. M. Haacke, M. Mehrmo-hammadi, M. J. Allen, ACS Omega 2017, 2, 800– 805; i) L. A. Ekanger, L. A. Basal, M. J. Allen, Chem. Eur. J. 2017, 23, 1145 –1150; j) M. Botta, M. Ravera, A. Barge, M. Bottaro, D. Osella, Dalton Trans. 2003, 1628 –1633. [4] a) P. Caravan, J. J. Ellison, T. J. McMurry, R. B. Lauffer, Chem. Rev. 1999, 99, 2293– 2352; b) N. Bloembergen, E. M. Purcell, R. V. Pound, Phys. Rev. 1948, 73, 679– 712; c) I. Solomon, Phys. Rev. 1955, 99, 559 –565; d) N. Bloembergen, J. Chem. Phys. 1957, 27, 572 –573; e) N. Bloembergen, L. O. Morgan, J. Chem. Phys. 1961, 34, 842 –850.
[5] J. Garcia, A. N. W. Kuda-Wedagedara, M. J. Allen, Eur. J. Inorg. Chem. 2012, 2135– 2140.
[6] a) A. Ruiz-Mart&nez, D. Casanova, S. Alvarez, Chem. Eur. J. 2008, 14, 1291 –1303; b) A. N. W. Kuda-Wedagedara, C. Wang, P. D. Martin, M. J. Allen, J. Am. Chem. Soc. 2015, 137, 4960– 4963.
[7] A. Apelblat, M. A. Esteso, M. Besˇter-Rogacˇ, J. Phys. Chem. B 2013, 117, 5241 –5248.
[8] a) S. Avedano, M. Botta, J. S. Haigh, D. L. Longo, M. Woods, Inorg. Chem. 2013, 52, 8436 –8450; b) B. C. Webber, C. Cassino, M. Botta, M. Woods, Inorg. Chem. 2015, 54, 2085 – 2087; c) D. T. Schehle, J. Schatz, S. Laurent, L. V. Elst, R. N. Muller, M. C. A. Stuart, J. A. Peters, Chem. Eur. J. 2009, 15, 3290 –3296; d) C. Vanasschen, N. Bouslimani, D. Thonon, J. F. Desreux, Inorg. Chem. 2011, 50, 8946 – 8958.
[9] J. Garcia, J. Neelavalli, E. M. Haacke, M. J. Allen, Chem. Commun. 2011, 47, 12858 – 12860.
[10] a) S. Aime, M. Botta, L. Frullano, S. G. Crich, G. B. Giovenzana, R. Pagliar-in, G. Palmisano, M. Sisti, Chem. Eur. J. 1999, 5, 1253 –1260; b) S. Aime, M. Botta, F. Fedeli, E. Gianolio, E. Terreno, P. Anelli, Chem. Eur. J. 2001, 7, 5261 –5269; c) S. Aime, S. G. Crich, E. Gianolio, E. Terreno, A. Beltrami, F. Uggeri, Eur. J. Inorg. Chem. 1998, 1283 – 1289; d) S. Aime, M. Botta, M. Panero, Magn. Reson. Chem. 1991, 29, 923 –927.
[11] a) R. A. Dwek, Nuclear Magnetic Resonance in Biochemistry: Applications to Enzyme Systems, Oxford University Press, Oxford, 1973; b) B. G. Jen-kins, E. Armstrong, R. B. Lauffer, Magn. Reson. Med. 1991, 17, 164 –178; c) S. Aime, M. Botta, M. Fasano, E. Terreno in The Chemistry of Contrast Agents in Medical Magnetic Resonance Imaging, 1st ed. (Eds.: A. E. Mer-bach, P. Tjth), John Wiley & Sons, Ltd. Chichester, UK, 2001, pp. 193 – 242.
[12] E. Battistini, E. Gianolio, R. Gref, P. Couvreur, S. Fuzerova, M. Othman, S. Aime, B. Badet, P. Durand, Chem. Eur. J. 2008, 14, 4551 –4561.
[13] a) P. Caravan, N. J. Cloutier, M. T. Greenfield, S. A. McDermid, S. U. Dunham, J. W. M. Bulte, J. C. Amedio, R. J. Looby, R. M. Supkowski, W. D. Horrocks, Jr., T. J. McMurry, R. B. Lauffer, J. Am. Chem. Soc. 2002, 124, 3152 –3162; b) J. Garcia, M. J. Allen, Inorg. Chim. Acta 2012, 393, 324– 327; c) V. Henrotte, L. V. Elst, S. Laurent, R. N. Muller, J. Biol. Inorg. Chem. 2007, 12, 929 –937; d) T. N. Parac-Vogt, K. Kimpe, S. Laurent, L. V. Elst, C. Burtea, F. Chen, R. N. Muller, Y. Ni, A. Verbruggen, K. Binnemans, Chem. Eur. J. 2005, 11, 3077 – 3086; e) S. Aime, M. Botta, S. G. Crich, G. B. Gio-venzana, R. Pagliarin, M. Piccinini, M. Sisti, E. Terreno, J. Biol. Inorg. Chem. 1997, 2, 470 –479.
[14] S. Aime, M. Botta, M. Fasano, S. G. Crich, E. Terreno, J. Biol. Inorg. Chem. 1996, 1, 312 –319.
[15] L. Burai, R. Scopelliti, P. Tjth, Chem. Commun. 2002, 2366 –2367. [16] G.-X. Jin, M. D. Bailey, M. J. Allen, Inorg. Chem. 2016, 55, 9085 – 9090. [17] L. Burai, P. Tjth, S. Seibig, R. Scopelliti, A. E. Merbach, Chem. Eur. J.
2000, 6, 3761 –3770.
[18] J. Garcia, Studies on the Physiochemical Properties of Eu2+ Cryptates:
Implications to Contrast Agents for Magnetic Resonance Imaging. Ph. D. Thesis, Wayne State University, Detroit, MI (USA), 2013.
[19] T. J. Swift, R. E. Connick, J. Chem. Phys. 1962, 37, 307.
[20] S. Aime, A. Barge, A. Borel, M. Botta, S. Chemerisov, A. E. Merbach, U. Meller, D. Pubanz, Inorg. Chem. 1997, 36, 5104 –5112.
[21] S. Avedano, L. Tei, A. Lombardi, G. B. Giovenzana, S. Aime, D. Longo, M. Botta, Chem. Commun. 2007, 4726 –4728.
[22] M. Botta, S. Avedano, G. B. Giovenzana, A. Lombardi, D. Longo, C. Cassi-no, L. Tei, S. Aime, Eur. J. Inorg. Chem. 2011, 802–810.
[23] B. N. Siriwardena-Mahanama, M. J. Allen, Molecules 2013, 18, 9352– 9381.
[24] a) D. H. Powell, O. M. N. Dhubhghaill, D. Pubanz, L. Helm, Y. S. Lebedev, W. Schlaepfer, A. E. Merbach, J. Am. Chem. Soc. 1996, 118, 9333 –9346;
b) P. Tjth, O. M. N. Dhubhghail, G. Besson, L. Helm, A. E. Merbach, Magn. Reson. Chem. 1999, 37, 701–708.
[25] S. Seibig, P. Tjth, A. E. Merbach, J. Am. Chem. Soc. 2000, 122, 5822– 5830.
[26] P. Caravan, P. Tjth, A. Rockenbauer, A. E. Merbach, J. Am. Chem. Soc. 1999, 121, 10403–10409.
[27] P. Tjth, L. Burai, A. E. Merbach, Coord. Chem. Rev. 2001, 216–217, 363 – 382.
[28] a) J. Reuben, J. Phys. Chem. 1971, 75, 3164 –3167; b) D. H. Powell, A. E. Merbach, G. Gonz#lez, E. Brecher, K. Micskei, M. F. Ottaviani, K. Kçhler, A. V. Zelewsky, O. Y. Grinberg, Y. S. Lebedev, Helv. Chim. Acta 1993, 76, 2129 –2146.
[29] L. Helm, Prog. Nucl. Magn. Reson. Spectrosc. 2006, 49, 45– 64.
[30] S. Aime, M. Botta, Z. Garda, B. E. Kucera, G. Tircso, V. G. Young, M. Woods, Inorg. Chem. 2011, 50, 7955–7965.
[31] a) G. Lipari, A. Szabo, J. Am. Chem. Soc. 1982, 104, 4546–4559; b) G. Lipari, A. Szabo, J. Am. Chem. Soc. 1982, 104, 4559–4570.
[32] E. M. Haacke, R. W. Brown, M. R. Thompson, R. Venkatesan, Magnetic Resonance Imaging Physical Principles and Sequence Design, John Wiley & Sons, Inc., New York, 1999, pp. 654.
[33] C. B. Hebschle, G. M. Sheldrick, B. Dittrich, J. Appl. Crystallogr. 2011, 44, 1281 –1284.
Manuscript received: May 12, 2017 Revised manuscript received: June 27, 2017 Accepted manuscript online: July 14, 2017 Version of record online: August 22, 2017