UNIVERSITÀ DEGLI STUDI DI FOGGIA
FACOLTÁ DI MEDICINA E CHIRURGIA
PhD Course in Experimental and Regenerative Medicine
XXXI Cycle
Dissecting the TRIM8 role
in the pathogenesis of glioma
Tutor PhD Student
Prof. V.M Fazio Santina Venuto
Supervisor
Dr. Giuseppe Merla
ABSTRACT ……….. p.1 1. Introduction ……….. p.2
1.1. General features of glioblastoma ………. p.2 1.2. TRIM proteins superfamily ………. p.2 1.3. TRIM/RBCC as a class of E3-Ubiquitin ligases ………. p.3
1.3.1. TRIM proteins are involved in tumor development and progression ……….. p.5 1.4. TRIM proteins control cell cycle progression………... p.5
1.4.1. Kinesin motor proteins control mitotic spindle formation ……….. p.6 1.5. TRIM8 ………. p.7 1.5.1. The tumor suppressor role of TRIM8 ……….. p.8 1.5.2. The oncogenic role of TRIM8 ………. p.9 1.5.3. TRIM8 in the regulation of STAT3……….. p.12
1.5.3.1. The JAK/STAT pathway ………. p.12 1.5.3.2. The TRIM8-PIAS3-STAT3 loop ……….... p.13
1.5.3.3. TRIM8 and STAT3 regulate stemness in glioblastoma ……….. p.13
2. AIM OF THE THESIS………... p.15 3. MATERIAL AND METHODS……….. p.17
3.1. Cell lines ……….. p.17 3.2.Retroviral vectors ………. p.17 3.3.RNA-Seq library preparation and sequencing ……….. p.17 3.4.Pre-processing and mapping reads to the mouse reference genome ………. p.18 3.5.Differential expression and survival analyses ………... p.18 3.6.PCR arrays validation of RNA-Seq differential expressed genes ……….... p.19 3.7.Quantitative real time PCR ………... p.19 3.8.Dual-luciferase assay ……… p.19 3.9.Co-immunoprecipitation and western blot ………... p.19 3.10. Isolation of nuclear and cytoplasmic extract ……….. p.20 3.11. DNA-binding assay ……… p.20 3.12. Cell sonication ……… p.20 3.13. Immunoprecipitation and mass spectrometry analysis ……….. p.20
3.14. Silencing experiments ………. p.21
3.15. Fluorescence and confocal microscopy ……….. p.21
3.16. Live-cell imaging ……… p.22 3.17. Cell synchronization ………... p.22
3.18. Metaphase Spreads and Karyotyping ………. p.22 3.19. Flow cytometric analysis ………. p.22
4. RESULTS ……….. p.23
4.1.TRIM8-driven transcriptomic profile identified glioma-related
nodal genes and pathways ………. p.23 4.1.1. TRIM8-related transcriptomic profile ………... p.23 4.1.2. Gene set functional enrichment analysis ………... p.23 4.1.3. Validation of RNA-Seq data ………. p.25 4.1.4. Correlation of CNS and glioma-related genes expression
with TRIM8 in TCGA cohort ………... p.26 4.1.5. TRIM8 physically interacts with STAT3 ………. p.27 4.1.6. TRIM8 promotes STAT3 transcriptional activity ……… p.29 4.1.7. TRIM8 directly binds SIE-sequences ………... p.32 4.2.TRIM8-driven proteomic profile identifies its role in the mitotic
spindle machinery ……… p.33 4.2.1. TRIM8 physically interacts with mitotic proteins ……… p.33 4.2.2. Disentangling the role of TRIM8 in the mitotic spindle processes ……….. p.34 4.2.3. TRIM8 silencing induces monopolar spindle cells and
slows down mitosis progression ………... p.35 4.2.4. TRIM8 is required for chromosomal stability ……….. p.39
5. DISCUSSION ……… p.40 6. CONCLUSIONS ………... p.45 7. BIBLIOGRAPHY……….. p.46
ABSTRACT
Human gliomas are a heterogeneous group of primary malignant brain tumors, whose molecular pathogenesis is not yet solved. Therefore, understanding the molecular mechanisms underlying their aggressive behavior may lead to better management, appropriate therapies, and good outcomes through the identification of novel specific glioma-associated genes. Members of the tripartite motif (TRIM) proteins family are involved in many biological processes, including transcriptional regulation, cell proliferation and differentiation and cell cycle progression. Alterations of TRIM proteins are associated with a variety of pathologies like developmental disorders, inflammatory diseases and cancers. Among TRIMs protein family, TRIM8 encodes an E3 ubiquitin ligase involved in various pathological processes, including hypertrophy, antiviral defense, encephalopathy, and cancer development. We have identified TRIM8 as a gene aberrantly expressed in gliomas, whose expression correlates with unfavorable clinical outcome in glioma patients. To gain insights into the TRIM8 functions, we profiled the TRIM8 transcriptome and interactome in primary mouse embryonic neural stem cells using RNA-sequencing and proteomics, followed by bioinformatics analysis. Functional analysis, including biochemical and cellular assays were then performed to explore TRIM8 roles in different pathways.
Our study firstly identified enriched pathways related to the neurotransmission and to the central nervous system (CNS) functions, providing additional evidence about the existence of a functional interactive crosstalk between TRIM8 and STAT3 with possible implications in the development and progression of glioma. Then, we found that TRIM8 interacts with KIFC1 and KIF11/Eg5, two master regulators of mitotic spindle assembly and cytoskeleton reorganization. Exploring the TRIM8 role in the mitotic spindle machinery, we showed that TRIM8 localizes at the mitotic spindle during mitosis and plays a role in centrosome separation at the beginning of mitosis with a subsequent delay of the mitotic progression and impact on chromosomal stability.
Our results substantiate the role of TRIM8 in the brain functions through the deregulation of genes involved in different CNS-related pathways, including JAK-STAT. Moreover, we provided insights on the physiological function of TRIM8 in the mitotic spindle machinery, pointing to an emerging role for TRIM8 in the regulation of mitosis.
1. Introduction
1.1. General features of glioblastoma
Gliomas are the most universal inherent brain tumors in adults and are nearly uniformly fatal. Glioblastoma (GBM) is the most common and the most malignant variant in the wide spectrum of intrinsic glial brain tumors being the most aggressive diffuse glioma of astrocytic lineage. Defining histopathological features are necrosis and endothelial proliferation, resulting in the assignment of grade IV glioma, the highest grade in the World Health Organization (WHO) classification of brain tumors(1).
GBMs are further classified into primary (de novo) and secondary tumors that arise from different frequently altered pathways(2). Primary GBM occurs de novo without evidence of a less malignant
precursor, whereas secondary GBM develops from initially low-grade diffuse astrocytoma (WHO grade II diffuse astrocytoma) or anaplastic astrocytoma (Grade III). GBM develops via a complex network of different genetic and molecular aberrations, leading to significant changes in major signaling pathways. Gene deregulation shows a crucial role in advancement of gliomas and glioblastoma(3).
While there have been advances in forgiving the molecular genetics of these tumors, the cell type(s) of origin are still uncertain, and the molecular determinants of disease aggressiveness are not well understood(3). Therefore, it is essential to explore the prognostic factors of gliomas and glioblastoma
and further to study the molecular mechanism responsible for gliomas and glioblastoma progression.
1.2. TRIM proteins superfamily
Members of the tripartite motif (TRIM) protein family (also known as RBCC family) contain a tripartite motif domain. The TRIM is composed of three zinc-binding domains, a RING (R), B-box type 1 (B1) and B-box type 2 (B2), followed by a coiled-coil (CC) region(4, 5). Proteins belonging to
this family are implicated in a variety of processes like development and cell growth and are involved in several human diseases(6).
The overall architecture of the tripartite motif is highly conserved throughout evolution and serves as an integrated functional structure. The RING is a DNA-binding domain with a zinc finger motif and mainly functions as an ubiquitin-protein isopeptide ligase (E3)(4, 7, 8). The Box1 (B1) and
B-Box-2 (B2) domains are critical determinants of the TRIM motif, influencing the substrate recognition and/or the ubiquitin ligase activity and determining the ability of TRIM proteins to form homo‑multimers and interact with other proteins. They have different length and consensi and, when found together, the type 2 B-box is always preceded by the type 1(8, 9). A predicted coiled-coil
Finally, one or more C-terminal domains of different length and nature usually follow the TRIM motif to confer specificity of functions to the entire protein(6, 8) (Fig. 1).
TRIM proteins identify a variety of cellular compartments, specifically depending on the integrity of their domains and their propensity to form high-order molecular weight structures. The propensity of these proteins to define specific and often novel cellular compartments and to facilitate protein aggregation suggests that they might act as a protein scaffold for the assembly of higher order molecular weight structures to recruit proteins involved in several distinct processes(8).
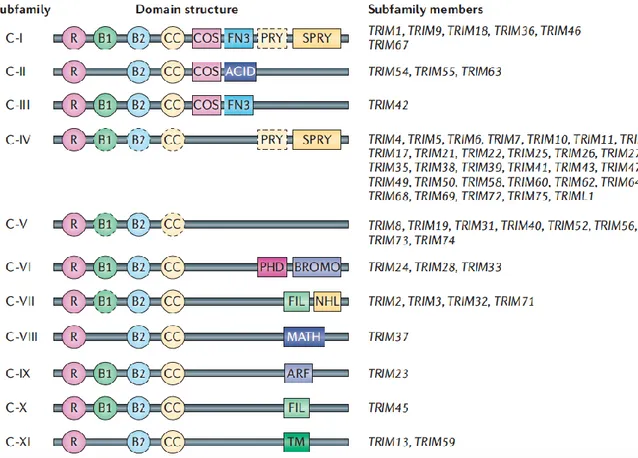
Figure 1. The structural classification of human tripartite motif (TRIM) subfamily (C‑I to C‑XI). Almost all
TRIM proteins have a RING-finger domain (R), one or two B‑box domains (B) and a coiled-coil domain (CC). Some members of the subfamily lack one or more amino‑terminal domains (shown as dashed outline domains). ACID, acid-rich region; ARF, ADP-ribosylation factor family domain; BROMO, bromodomain; COS, cos-box; FIL, filamin-type I G domain; FN3, fibronection type III repeat; MATH, meprin and TRAF-homology domain; NHL, NCL1, HT2A and LIN41 domain; PHD, PHD domain; PRY, PRY domain; SPRY, SPRY domain; TM, transmembrane region; Ub, ubiquitin.
1.3. TRIM/RBCC as a class of E3-Ubiquitin ligases
Although the TRIM/RBCC family proteins have a highly conserved structure, they are involved in a variety of cellular processes, including regulation of cell cycle progression, intracellular signaling, differentiation, development, apoptosis, protein quality control, innate immunity, autophagy, and carcinogenesis(10). The presence of the RING domain and its strong association to ubiquitination
Ubiquitination is a versatile post-translational modification mechanism used by eukaryotic cells mainly to control protein levels through proteasome-mediated proteolysis, playing an important role in the degradation of proteins that function in the cell cycle, intracellular signaling, DNA repair, protein quality control, and transcriptional regulation(12). Protein ubiquitination is a multi-step
process that involves at least three classes of enzymes. The E1 ubiquitin-activating enzyme activates ubiquitin with ATP. The E2 ubiquitin-conjugating enzyme has a core catalytic domain required for transferring ubiquitin from E1 to E2 itself. In the last step, the E3 ubiquitin ligase enzyme recognizes specific substrate protein and conjugates ubiquitin to a lysine on a specific target protein. The resulting polyubiquitinated conjugates are detected and rapidly degraded by the 26S proteasome, a protein complex for protein degradation with nuclear and cytoplasmic functions(10) (Fig. 2). The ubiquitin proteasome system (UPS) handles 80 to 90% of intracellular
protein degradation, including key signaling molecules that promote cell cycle progression, cellular adhesion, and proliferation and induce anti-apoptotic pathways(13). Interestingly, deregulated
proteolysis of oncoproteins and tumor suppressors involved in major signaling cancer pathways can contribute to the development of different tumors, including glioma(13, 14).
Figure 2. An overview of the proteasome system. Ubiquitin conjugation is catalyzed by
ubiquitin-activating enzyme (E1), ubiquitin-conjugating enzyme (E2) and ubiquitin ligase (E3). E3 is a scaffold protein that mediates between E2 and the substrate, and it is thought to be the component of the ubiquitin conjugation system that is most directly responsible for substrate recognition. The resulting covalent ubiquitin ligations form polyubiquitylated conjugates that are rapidly detected and degraded by the 26S proteasome. On the basis of occurrence of covalent linkage with ubiquitin, E3 enzymes have been classified into two families: the HECT family and the RING family.
It is generally accepted that E3 ligases are responsible for substrate recognition and therefore confer specificity to the system(15). Over 600 E3 ligases have been characterized in humans and are
classified into 3 different classes: homologous to E6-AP carboxyl terminus (HECT), really interesting new gene (RING) and RING-between-RING (RBR)(16). RING proteins are the largest
class of E3 ligases and among them the tripartite motif (TRIM) family proteins represent the largest subfamily of RINGs(17). To date, there are more than 80 known TRIM protein genes in humans(10)
involved in many biological processes, and their alteration are associated with a variety of pathologies including developmental disorders, inflammatory diseases and cancers(17).
1.3.1. TRIM proteins are involved in tumor development and progression
Ubiquitylation is one of the many post-translational modifications used by eukaryotic cells to regulate cellular physiology, and the ubiquitin-mediated proteolytic pathway has a crucial role in the elimination of short-lived regulatory proteins, including oncogenes and tumor suppressor genes(18, 19). As TRIM proteins are involved in several biological processes, some members of the
tripartite motif protein family are thought to be important regulators of carcinogenesis(18). Indeed,
changes in the expression of some TRIM proteins are strongly correlated with the malignancy of cancers and prognosis(10).
Relevant for this study, a number of TRIMs are involved in glioma development and progression with both oncogenic and tumor suppressor role. Briefly, TRIM37 has an oncogenic role in glioma progression influencing proliferation, migration/invasion, and the epithelial-mesenchymal transition (EMT) phenotype in glioma cells, through the regulation of PI3K/Akt pathway(20, 21). TRIM24
expression is positively correlated with glioma malignancy and is required as EGFR co-activator, recruiting and stabilizing STAT3 oncogene in multiple glioma cell lines(22, 23). Moreover, TRIM28
is over expressed in glioma and its expression positively correlates with tumor malignancy, poor overall survival and progression-free survival(24, 25). Finally, TRIM11 expression levels are
upregulated in human high-grade gliomas and glioma-derived stem-like cells (GSCs). TRIM11 overexpression potentially leads to a more aggressive glioma phenotype, mediated through the EGFR signaling pathway(26). On the other hand, TRIMs like TRIM3 and TRIM11 have a tumor
suppressor role in glioma. In particular, TRIM3 is deleted in primary human glioma(27) while
TRIM45 interacts with and stabilizes p53 in glioma, promoting the K63-linked ubiquitination of p53 to protect p53 from degradation and inactivation, thereby suppressing GBM proliferation and tumorigenicity(28).
1.4. TRIM proteins control cell cycle progression
Among the cellular processes TRIMs are involved in, one that have to be faithful coordinated and regulated is the control of cell cycle and in particular of mitosis(29). Cell cycle control at different
checkpoints between S and M phases is responsible for cells progression and proliferation and many TRIM proteins are involved in controlling cell cycle transition phases. To obtain an optimal cell cycle progression and cells proliferation, TRIMs regulate proteins involved in the cell cycle
TRIM proteins can control above all, the regulation of the different mitotic phases. Interestingly, TRIM superfamily has been shown to possess a domain necessary for the microtubule binding(31).
As a consequence, a lot of TRIM proteins co-localize with or are important for the regulation of many key components of the mitotic spindle, including kinetochore, centrosomes and midbodies (32-37).
1.4.1. Kinesin motor proteins control mitotic spindle formation
The mitotic spindle is a dynamic bipolar structure that self-assembles from component parts at the entry into mitosis. The two ends of the spindle are called spindle poles, are located where spindle microtubules converge and are associated with centrosomes, the sites for microtubule nucleation. Correct spindle formation and function by generating forces that establish and maintain spindle bipolarity and elongation, requires various motor microtubule associated proteins (MAPs) that regulate the nucleation, organization, dynamics, and crosslinking of spindle microtubules. Among motor proteins, Kinesin-5 family members function as bipolar homotetramers, with pairs of motor heads at opposite ends of an elongated molecule. This structural organization allows the motor to crosslink two adjacent microtubules. Among kinesin-5 family proteins, KIF11/Eg5 is a plus-end directed microtubule motor protein that forms a bridge between two adjacent and antiparallel microtubules to facilitate their movement in opposite directions from each of the duplicated centrosomes relative to one another, driving bipolar spindle formation(38, 39). KIF11/Eg5 interacts
with microtubules and moves toward plus ends with short run lengths in an ATP-dependent, bidirectional diffusive behavior of the protein N-terminus(40).
In contrast to plus-end-directed kinesins, kinesin-14 family proteins are specific minus-end-directed motors; they utilize the chemical energy of ATP hydrolysis to move along microtubules from their plus- to their minus-end, exploiting ATP hydrolysis(41, 42). Among the three members of this family,
KIFC1 (HSET) is a dimer involved in spindle pole organization(43).
The bipolar spindle apparatus is maintained by antagonistic relationships(41). Within the bipolar
spindle, on parallel and anti-parallel microtubules, there is an antagonistic relationship between KIFC1 and KIF11 in order to crosslink and slide microtubules, a common mechanism to maintain correct spindle organization(44-46). Briefly, kinesin-14 motors generate inward pulling forces on
spindles, whereas the kinesin-5 motors have been shown to generate outwards forces on spindles(47).
Exerting opposite forces, KIFC1 and KIF11 cooperatively regulate microtubule aster formation, centrosome separation and correct spindle organization, thus the balance between KIFC1 and KIF11 is responsible for correct microtubule assembly(41) (Fig. 3). Remarkably, disturbing the
stoichiometric balance between KIFC1 and its counterforce generating kinesin KIF11 is responsible of the formation of monopolar and multipolar spindles observed in different forms of cancers(38, 48).
In particular, monopolar spindles occur when only a single spindle pole and a single microtubule aster are present in a prometaphase cell(49).
Figure 3. Counterbalance between KIFC1 and KIF11/Eg5 motors. In mammalian, kinesin-14 KIFC1 and kinesin-5
Eg5 cooperatively regulate microtubule aster formation, centrosome separation and spindle assembly.
1.5. TRIM8
The TRI-partite Motif 8 (TRIM8)/GERP protein is a member of the TRIM family proteins(6).
TRIM8 protein is composed of 551 amino acids (aa) with a molecular weight of 61.5 kDa. TRIM8 protein also contains Nuclear Localization Signals (NLS), thus it is a nuclear protein localized to structures best described as “nuclear bodies”. These nuclear structures depend on the coiled-coil domain, since the deletion of this domain induces diffused nuclear staining and no discrete foci(50)
(Fig. 4). Interestingly, TRIM8 modulates the activity of important cellular proteins through protein-protein interactions mainly mediated by the coiled-coil and the C-terminus domain(51).
Figure 4. TRIM8 protein structure. The different TRIM8 domains are reported with the numbers indicating the first
and the last amino acid for each one.
finger protein (GERP)(52). We described TRIM8 as a brain gene whose expression correlates with
unfavorable clinical outcome in glioma patients. We found that a restored TRIM8 expression induced a significant reduction of clonogenic potential in U87MG and patient's glioblastoma cells. Finally, we provide experimental evidences showing that miR-17 directly targets the 3' UTR of TRIM8 and post-transcriptionally represses TRIM8 expression(53).
1.5.1. The tumor suppressor role of TRIM8
TRIM8 shows a dual role either as oncogene or as tumor suppressor gene, depending on the cellular context in quite diverse pathways, as embryonic development and differentiation, innate immune response and in a variety of human cancers(50). Involvement of TRIM8 in cancer was first
highlighted in brain tumors including glioblastomas, where the TRIM8 loss of heterozygosity was observed(52). Moreover, TRIM8 tumor suppressor role was also found in other tumors as
glioblastoma multiforme (GBM), larynx squamous cell carcinoma (LSCC), clear cells renal carcinoma (ccRCC), anaplastic thyroid cancer (ATC), colorectal cancer (CRC), chronic lymphocytic leukemia (CLL) and osteosarcoma cell lines(50) (Fig. 5).
Figure 5. Schematic representation of the tumor suppressor network involving TRIM8. Following cellular stress,
the p53 tumor suppressor protein trans activates TRIM8 gene, which in turn stabilizes p53, promoting the transcription of p53 target genes involved in cell proliferation arrest (p21), DNA repair (GADD45A), and the suppression of the MYCN oncogenic activity. MYCN promotes the transcription of miR-17-5p and miR-106b-5p, which target TRIM8 mRNA, promoting its degradation.
- TRIM8 in the regulation of p53
Experimental evidences has outlined TRIM8 as one of the gene which low expression levels correlates with nodal metastatic progression in primary larynx squamous cell carcinoma (LSCC)
and whose stable expression inhibits tumor cell colony formation in vitro and tumor cell growth(51).
In different types of cancer, TRIM8 is implicated in a feedback loop in the tumor suppressor circuit controlled by p53(54, 55). Tumors harboring p53 mutations, which lead to expression of inactive p53
protein, account for about 50% of all human cancers and predict a considerably worse patient prognosis in comparison with malignancies with functional p53(55). Besides the many tumors that
have an inactivating mutation in the p53 coding sequence, an additional 40% contain a wild-type
p53 gene but the p53 pathway is often inactivated through alterations in its regulators or rather still
unknown mechanisms(55).
In human osteosarcoma cell lines, TRIM8 directs the cells toward a program of cell cycle arrest, modulating p53 stability and activity(54). In particular, TRIM8 physically interacts with p53,
stabilizes and activates p53 protein enhancing its half-life, resulting in a suppression of cell proliferation, due to a p53-dependent cell cycle arrest in G1. This TRIM8-mediated p53 stabilization occurs through MDM2, without a directly interaction between TRIM8 and MDM2, but resulting in a highly impairment of MDM2-p53 interaction. Under stress conditions p53 induces TRIM8 expression, which in turn stabilizes p53, leading to cell cycle arrest and reduction of cell proliferation through the enhancement of p21 and GADD45 expression, two p53 targets(54) (Fig. 5).
A prominent role for TRIM8 as tumor suppressor implicated in the p53 loop was shown in clear cell Renal Cell Carcinoma (ccRCC). TRIM8 is down regulated in patients affected by ccRCC, the most common and aggressive subtype of RCC and the decrease of TRIM8 expression is linked to a malignant transformation of the cells. In this cancer, TRIM8 down regulation suppresses p53 activity increasing cell proliferation rate, as a result of MDM2 protein stabilization and p53 protein degradation. Interestingly, the restoration of TRIM8 levels in RCC cell line makes them more sensitive to the action of chemotherapy, through the reactivation of the p53 pathway, making TRIM8 an enhancer of the chemotherapy efficacy(55).
1.5.2. The oncogenic role of TRIM8
Although some studies point to the tumor suppressor role of TRIM8, a number of oncogenic mechanisms have been proposed concerning a TRIM8 role in the regulation of inflammatory pathways, including the NF-kB pathway, and therefore supporting tumor onset and progression(50)
Figure 6. Schematic representation of the oncogenic network involving TRIM8. Proinflammatory cytokines, such
as TNFα and IL-1β, promote NF-κB activation mediated by TRIM8, through two different mechanisms: i) promoting the translocation of PIAS3 from the nucleus to cytoplasm and its subsequent degradation; PIAS3 in the nucleus interacts with p65, preventing NF-κB activation; ii) mediating TAK1 polyubiquitination and subsequent activation. TAK1 is a member of the MAPK kinase family that promotes the phosphorylation of IKK (IκB Kinase) leading to the phosphorylation of IκBα, its degradation, and activation of NF-κB. Moreover, TRIM8 induces the activation of the JAK-STAT pathway promoted by Interferon-γ (IFN-γ), through the degradation of two STAT proteins inhibitors, PIAS3 and SOCS-1 (suppressor of cytokine signalling-1).
-TRIM8 has an oncogenic role in TNFα/NF-kB pathway
NF-kB is an inducible transcription factor and its activation plays a pivotal role in many cellular events such as cell proliferation, inhibition of apoptosis, and innate immunity(56). The deregulation
of this pathway has been observed in many cancers, skeletal abnormalities, neurodegenerative and autoimmune diseases and metabolic disorders(57). NF-kB activation is induced by tumor necrosis
factor alpha (TNFα) and IL-1β and requires the signal-induced phosphorylation and degradation of IκB proteins that is mediated by IκB kinase (IKK) complex(58). Interestingly, also ubiquitination has
a role in the regulation of NF-kB pathway. The binding of TNFα to its receptor leads to the recruitment of several ubiquitin ligases that are either auto-ubiquitinated or ubiquitinates other substrates to activate downstream IKK complex, resulting in the translocation of NF-kB to the nucleus and consequent activation(59-61). In particular, TRIM8 exerts an oncogenic role in this
context, positively regulating TNF-induced NF-κB activation in two ways: i) promoting TGFβ activated kinase 1 (TAK1) activation; ii) through the translocation of protein inhibitor of activated STATs 3 (PIAS3) from nucleus to cytoplasm(62, 63).
TRIM8 interacts with TAK1, a serine/threonine kinase essential for TNFα- and IL-β–induced NF-κB activation. TAK1, together with other proteins, activates the IKK complex after a large variety of stimuli, including the proinflammatory cytokines tumor necrosis factor α (TNFα) and
interleukin-1β (IL-1β)(64). Interestingly, TAK1 polyubiquitination is involved in the regulation of
TAK1-mediated signaling pathways(65). In this context, TNFα and IL-1β trig TRIM8 mediated
K63-linked polyubiquitination of TAK1 at residue K158, thus stimulating TNFα- and IL-1β–induced NF-κB activation(62, 66).
Another way by which TRIM8 positively regulates TNF induced NF-kB activation is at p65 level, stimulating the translocation of PIAS3 from nucleus to cytoplasm. PIAS3 negatively regulates NF-kB transcription via its interaction with p65 in the nucleus(67). Mediating the spatial regulation and
turnover of PIAS3, TRIM8, activated and stabilized by TNFα, inhibits PIAS3-mediated negatively regulation of NF-kB (Fig. 6)(63).
TNF is one of the pro-inflammatory cytokines that is constitutively present in tumor microenvironments and regulates various steps of tumorigenesis(68). TRIM8 positive regulation of
TNF-mediated NF-kB activation supports TRIM8 oncogenic role. This observation is enforced by the evidence that TRIM8 regulates clonogenic and migration ability of cells, through NF-kB pathway(63).
-TRIM8 regulates the suppressor of cytokine signaling-1 (SOCS-1)
Another example in which TRIM8 has been described as an oncogene concerns its role in decreasing the protein stability of SOCS-1 and reversing the SOCS-1-mediated inhibition of JAK-STAT activation by IFNγ(69). Cytokines control many different cellular functions, including
proliferation, differentiation, and gene expression and the biological cellular response to cytokines involves a complex network of signal transduction machinery(70). Oligomerization of cytokine
receptors expressed on the surface of target cells triggers the activation of members of the JAK family of protein-tyrosine kinases that constitutively associate with the cytokine receptor and act as docking sites for signaling molecules(71). The intensity and duration of cytokine signaling seems to
be regulated by several mechanisms, involving the protein inhibitors of activated STATs (PIAS) and the suppressor of cytokine signaling (SOCS protein)(69). SOCS genes are induced by cytokines
and can inhibit cytokine signaling by binding to downstream signaling molecules. SOCS proteins are tightly regulated but are extremely labile too, and proteasome inhibitors decrease their degradation(72).
TRIM8 is a suppressor of cytokine signaling-1 (SOCS-1) interacting protein. TRIM8 mRNA can be induced by IFNγ in murine B lymphoid M12 cells, murine fibroblasts and HeLa cells and the N-terminal 204 aminoacids of TRIM8 interact with SOCS-1. TRIM8 accelerates the degradation of SOCS-1, probably through its E3-ubiquitin ligase activity. This destabilizing action on SOCS-1 prevents SOCS-1-mediated inhibition of IFNγ, activating JAK-STAT pathway(69). Therefore,
TRIM8 may be a regulator of SOCS-1 function in the IFNγ pro-inflammatory pathway, exerting its oncogenic role (Fig. 6)(69).
1.5.3. TRIM8 in the regulation of STAT3 1.5.3.1. The JAK/STAT pathway
Another important pathway tightly regulated by TRIM8 and important for stemness and oncogenesis, places TRIM8 in a positive feedback loop with the JAK/STAT signaling.
The JAK/STAT signaling pathway transduces information originated from cytokines extracellular signals finally regulating DNA transcription of genes important for cell proliferation, differentiation, and apoptosis(73). STAT proteins (STATs) belong to a family of transcription factors
that are activated by polypeptide ligands, such as cytokines and growth factors. STATs comprise seven members: STAT1, STAT2, STAT3, STAT4, STAT5 (a/b) and STAT6(74). Among them,
STAT3 is a crucial member of the STAT family, which forms a dimer following activation, enters the nucleus, and regulates the transcription of diverse target genes(75).
STAT3 protein contains six functional domains: i) N-terminal domain (ND), which is able to stabilize the dimerized STAT3 and promotes the formation of tetramers of two STAT3 dimers to make it more stable with DNA; ii) coiled-coil domain (CCD), which mediates STAT3 direct binding to the receptor and facilitates STAT3 phosphorylation on 705-tyrosine site (Y705); iii) DNA binding domain (DBD), which, by recognizing the specific sequences on DNA, will direct STAT3 to the promoters of target genes to initiate the transcriptional activation ; iv) the linker region, the function of which is unknown at present; v) Src homology 2 (SH2) domain, the most conserved part of STAT3, which plays a critical role in the process of signal transduction through STAT3 phosphorylation and subsequent dimerization; vi) C-terminal transcriptional activation domain (TAD), in which is located the STAT3 phosphorylation on 727-tyrosine site (Y727)(73).
The Janus kinase (JAK) family consists of four non-receptor tyrosine kinases, JAK1, JAK2, JAK3 and tyrosine kinase 2 (TYK2), which phosphorylate a number of signaling molecules that contain specific SH2 domain(76). Different cytokine receptors on the cell membrane bind the corresponding
ligands to form homologous or heterodimers, which drive the mutual phosphorylation of the JAKs in proximity, and facilitate the activation of STAT3. STAT3 phosphorylation at the Y705 and/or the Y727 site, leads to the activation and dimerization of STAT3, which will rapidly enter the nucleus, specifically bind to the STAT inducible element sequences (SIE), and initiate the activation and transcription of target genes(73).
The activity of STAT3 in the nucleus is tightly controlled by two negative regulators, SOCS and PIAS. In particular, PIAS is an important negative regulator of STAT3 activity(77). PIAS3 affects
the DNA-binding activity of p-STAT3; ii) the suppression of transcription by recruiting other co-regulators, including histone deacetylases; iii) the sumoylation of p-STAT3; iv) the suppression of transcription by sequestering p-STAT3 to certain sub-nuclear structures where co-repressor complexes are enriched(78).
1.5.3.2. The TRIM8-PIAS3-STAT3 loop
STAT3 has a broad range of biological functions, including cell activation, cell proliferation and apoptosis. Activated STAT3 has been shown to protect tumor cells from apoptosis and promote cell proliferation by regulating genes encoding antiapoptotic and proliferation-associated proteins(79).
In this regulation mechanism, TRIM8 controls STAT3 activation interacting with PIAS3 and i) degradating PIAS3 through the ubiquitin- proteasome pathway, ii) excluding PIAS3 from the nucleus, through the interaction with heat shock protein 90β (Hsp90β) and consequently modulating
Nanog transcription in embryonic stem cells(80, 81).
In the first case, TRIM8 physically interacts with PIAS3, determining its monoubiquitylation and consequently contributing to the proteasomal degradation of PIAS3, destabilizing its structure. Moreover TRIM8, that is a nuclear protein, causes the disruption of the nuclear localization of PIAS3, translocating it in the cytosolic fraction and excluding PIAS3 from the nucleus(80).
Consequently, TRIM8 induces a down-regulation of the PIAS3-STAT3 interaction thus positively regulating STAT3-dependent gene expression and thereby inducing oncogenesis(80).
STAT3 plays an important role in leukemia inhibitory factor (LIF) signaling pathway in embryonic stem (ES) cells to maintain their pluripotent state. LIF-dependent signaling pathways in mouse ES cells also modulate different signals, including Nanog transcription(81). In ES cells, heat shock
protein 90β (Hsp90β) interacts with STAT3 and accelerates STAT3 nuclear translocation, thus regulating LIF signaling(82). In this context TRIM8 binds Hsp90β and consequently modulates the
translocation of phosphorylated STAT3 into the nucleus. Accordingly, TRIM8-knockdown results in an accumulation of a large amount of total STAT3 and tyrosine 705 (Y705)-phosphorilated STAT3 in the nucleus and in a down-regulation of Nanog transcription. Thus, TRIM8 modulates the interaction between STAT3 and Nanog promoter region through the chaperon activity of Hsp90β, suggesting that TRIM8 has an important role in the regulation of STAT3-mediated signaling in the differentiation and self renewal of ES cells(81).
1.5.3.3. TRIM8 and STAT3 regulate stemness in glioblastoma
TRIM8 also has a role in maintaining stemness and self-renewing capabilities of glioblastoma multiforme stem-like cells (GSCs) through the activation of STAT3 signaling(83) (Fig. 7).
Figure 7. Schematic model of the TRIM8-PIAS3-STAT3 pathway that regulates glioblastoma stemness. TRIM8
suppresses PIAS3 through proteasomal degradation, resulting in enhanced activation of STAT3. STAT3 promotes GSC stemness factors SOX2, NESTIN, CD133, and c-MYC. In addition, STAT3 promotes TRIM8 expression, forming a positive bidirectional regulatory loop involving TRIM8 and STAT3.
TRIM8 expression in GSCs positively correlates with GSC markers NESTIN and CD133 as well as the stem cells transcription factors c-MYC and SOX2, thus maintaining the self-renewing capability of these cells. Moreover, TRIM8 expression is strongly and positively correlated with STAT3, SOX2, NESTIN, Olig2, Nanog and BMI suggesting that TRIM8 is relevant to GBM stemness(83).
Interestingly, in patient-derived GBM neurospheres, TRIM8 overexpression correlates with STAT3 upregulation and PIAS3 suppression. Conversely, after TRIM8 knockdown, PIAS3 expression increases and reduces the expression levels of activated STAT3(83). Since TRIM8 overexpression
reduces the half-life of PIAS3 of about 2 hours, Zhang et al. demonstrated that TRIM8 suppresses PIAS3, most likely through ubiquitin-mediated proteasomal degradation, leading to upregulation and activation of STAT3(83).
Moreover, in GSCs there is a strong positive mRNA correlation between TRIM8 and STAT3. Interestingly, TRIM8 promoter region contains two transcription factor binding sites (TFBS) for STAT3, and TRIM8 shows a parallel dose-dependent increase in protein expression, in response to IL-6, known to potently induce STAT3 activation in GSC and regulate their self-renewal capacity(84, 85). Therefore, STAT3 activation contributes to TRIM8 expression in GBM neurosphere
cells and TRIM8 regulates GBM neurosphere stemness through a bidirectional positive feedback loop involving PIAS3 and STAT3(83) (Fig. 7).
2. AIM OF THE THESIS
Since E3 ubiquitin ligase proteins regulate carcinogenesis through the timely control of many cellular processes such as DNA damage response, metabolism, transcription, and apoptosis(76, 86-88),
we reasoned that the TRIM8 activity might impact on cell transcriptome patterns, thereby promoting cancer development and progression. Moreover, to gain further insights into TRIM8 function in brain biology, we searched for putative novel TRIM8 protein partners using a proteomic approach combined with Mass Spectrometry.
The identification of TRIM8-related transcript and substrate signatures was carried out on normal embryonic neural stem cells (eNSC) infected with a retrovirus expressing FLAG-Trim8 or an empty vector. NSCs display molecular hallmarks of forebrain radial glia and can be considered as the “bona fide” healthy counterpart of glioma cells(89). Moreover, in vitro culture of neural stem cells
has proven to be a valuable experimental approach for exploring molecular processes in disease models of the central nervous system (CNS)(90). Firstly, we profiled the whole transcriptome of
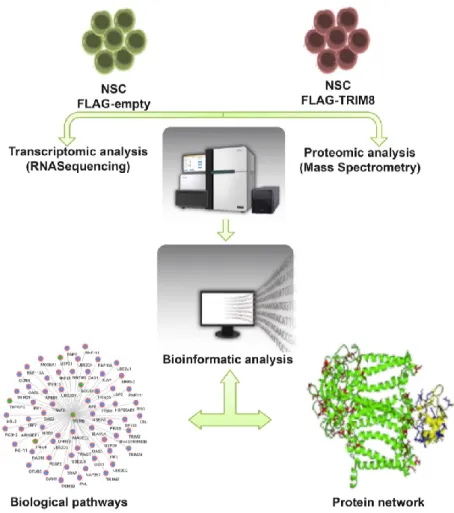
normal eNSC infected with a retrovirus expressing FLAG-Trim8 by using RNA-Seq, to assess the differential gene expression perturbations due to TRIM8 overexpression and to identify several genes and transcripts. Then, a proteomic approach based on TRIM8 immunoprecipitation (IP) assays coupled to LC-MS/MS in eNSC, allowed us to detect a plethora of TRIM8 interacting proteins (Fig. 8). Both transcriptomic and proteomic data were analyzed with several bioinformatics tools to define protein networks and pathways relevant for gliomagenesis.
Figure 8. Experimental strategy. Embryonic neural stem cells (eNSC) are infected with a retrovirus expressing
FLAG-Trim8 or an empty vector. We obtained TRIM8-related biological pathways and protein network through both RNA-Seq and Mass Spectrometry analysis, examined with bioinformatics tools.
Overall this thesis aims to i) profile TRIM8-related transcriptome to identify TRIM8 particular substrates and glioma-related biological pathways; ii) profiling TRIM8-related interactome to classify TRIM8 protein network and specific interactors highly relevant for gliomagenesis; iii) exploring the effect of TRIM8 and TRIM8-targeted substrates and interactors on biological networks relevant for cancer progression.
The possibility of selectively targeting TRIM8 expression or TRIM8 substrates and/or interactors will provide a unique opportunity to translate the generated knowledge into the clinical setting in the form of TRIM8-based therapeutics.
3. MATERIAL AND METHODS 3.1. Cell lines
Murine embryonic neurospheres were established starting from E14 telencephalic progenitors obtained as described in(91). Briefly, E14 telencephalic emispheres were dissected from the brain
and dissociated in 1 ml of Trypsin/EDTA (Life Technologies) for 15 minutes at 37 °C. DMEM medium with 10% fetal bovine serum (Thermo Fisher Scientific) was then added and cells were mechanically dissociated with a Pasteur pipette. After centrifugation for 5 minutes at 500 RCF, cells were resuspended in neural stem cells medium (DMEM/F12 from Thermo Fisher Scientific, 1× B27 supplement from Thermo Fisher Scientific, 10 ng/ml EGF from Peprotech, 10 ng/ml bFGF from Peprotech) and seeded in 24 well plates (50,000–150,000 cells/well). After plating, cells were infected with replication in competent retrovirus expressing the murine FLAG-tagged Trim8 sequence and a GFP cassette or a control vector expressing only the GFP cassette. After a short period of expansion in vitro, infected cells were FACS-sorted to obtain a pure population of GFP-positive cells that were used for RNA-Seq analysis. Human fibroblasts were maintained in DMEMF12 while HEK293, Hela and U87MG cell lines were maintained in DMEM with Glutamax medium. Both medium were supplemented with 10% fetal bovine serum and 1% antibiotics (Thermo Fisher Scientific).
3.2. Retroviral vectors
The murine FLAG-tagged Trim8 sequence was cloned in the pCAG:GFP MMLV retroviral vector (kindly provided by Dr. M. Goetz, Institute of Stem Cell Research, Germany), upstream the IRES– GFP reporter cassette. As control vector we used the same pCAG:GFP vector expressing only the IRES-GFP cassette. Replication-defective retroviral supernatants were prepared by transiently transfecting plasmids into Phoenix packaging cells and harvesting the supernatant after 2 days. The supernatants were concentrated by centrifugation and stored at −80 °C before use.
3.3. RNA-Seq library preparation and sequencing
Total RNA was extracted using mini RNase kit reagent (Qiagen) and treated with DNase-RNase free (Qiagen). RNA integrity was evaluated by using the Agilent 2100 Bioanalyzer (Agilent Technologies). Next generation sequencing experiments were performed by Genomix4Life S.r.l. (Baronissi, Italy). Indexed libraries were prepared from purified RNA with the TruSeq Total Stranded RNA Sample Prep Kit (Illumina) according to the manufacturer's instructions. Libraries were quantified using the Agilent 2100 Bioanalyzer (Agilent Technologies). Indextagged samples were equimolar and the overall concentration was 2 nM. The pooled samples were subject to cluster generation and sequenced using an Illumina HiSeq 2500 System (Illumina) in a 2×100 paired-end format at a final concentration of 8 pmol.
3.4. Pre-processing and mapping reads to the mouse reference genome
RNA-Seq yielded an average number of 68,5 million reads per sample, ranging from 60 to 86 million reads. Raw data (.fastq files) were quality-controlled using the FastQC v0.11.5 software package and exhibited an average quality score as high as 36 (phred). Reads were discarded if the average per-base phred values were<20 or trimmed by Trimmomatic(92) if the phred values of>5%
of nucleotides at the extremities of the reads were lower than 20. Residual adapter sequences were removed by cutadapt.>75% of the paired-end reads were mapped to the GRCm38 mouse reference genome by TopHat 2. To summarize the alignments statistics, the resulting BAM files were analysed using SAMtools.
3.5. Differential expression and survival analyses
Uniquely mapped reads were counted and RPKM-normalized. To assess the cross-sample consistency of the expression profiles, the Pearson's correlation coefficient was calculated for each pairwise combination of samples. Differential gene expression was obtained by one-way ANOVA, as implemented in Partek® Genomics Suite® version 6.6, if Benjamini-Hochberg's FDR-adjusted p-values<.05. Any random batch effect was mitigated by the Batch Effect Removal® tool of Partek. Differentially expressed genes were subjected to Gene Set Enrichment Analysis (GSEA) by Ingenuity® Pathway Analysis (IPA®, Qiagen, Summer 2017 Release). The whole procedure of functional enrichment analysis was based on the prior calculation of the activation z-scores, by which we inferred the activation states of biological functions and pathways. An enrichment score (Fisher's exact test, p-value), instead, was calculated to measure the overlap between observed and predicted deregulated gene sets. We considered p-values <.05, with positive or negative z-scores indicating predicted activated or inhibited functions/pathways. Categories of functional annotations were ranked by a score computed with the weighted sum of the absolute z-scores of the diseases and functions belonging to the categories. Weights were calculated as the complement of the inverse of -log p-value (pv), as reported in(93). Correlation of expression between functionally
relevant genes and TRIM8 was checked in The Cancer Genome Atlas (TCGA; https:// cancergenome.nih.gov/) cohort of glioma tissues (530 Low Grade Gliomas and 166 Glioblastomas) through Spearman correlation test. Considering the high variability of the gene expression profiles of these tumor samples, a minimum correlation value of 0.2 was set. The Log-Rank test was used to compare the survival distributions of two samples divided according to the mean expression values of TRIM8 and of other relevant genes. Samples having expression levels greater than the mean value were assigned to the High group, while samples with the expression values less or equal to the mean were assigned to the Low group. All statistical computations were made through R statistical software (R version 3.3.2).
3.6. PCR arrays validation of RNA-Seq differential expressed genes
Mouse embryonic neurospheres were infected with a retrovirus expressing FLAG-Trim8 or with an empty vector. Total RNA was extracted using mini RNase kit reagent (Qiagen), treated with DNase-RNase free (Qiagen), quantified by Nanodrop (Thermo Fisher Scientific) and reverse-transcribed using RT2 First Strand Kit (Qiagen) according to the manufacturer's instructions. Resulting complementary DNA from each sample was aliquoted both into mouse Jak-Stat signalling RT2 Profiler™ PCR arrays (Qiagen/SABiosciences catalog no. PAMM-039Y, gene list provided online). Real-time PCRs were performed on an ABI 7900 (Thermo Fisher Scientific-Applied Biosystems). Data were analysed by using RT2 Profiler PCR Array data analysis software (www. SABiosciencies.com/pcrarraydataanalysis.php), provided by SABiosciences.
3.7. Quantitative real time PCR
Total RNA from mouse embryonic neurospheres infected with a retrovirus expressing FLAG-Trim8 or with an empty vector was reverse transcribed using the Quantitect Transcription kit (Qiagen), according to the manufacturer's instructions. Oligos for qPCR were designed using the Primer express program(94) with default parameters. GAPDH and ACTIN were used as reference genes. The
reactions were run in triplicate in 10 ul of final volume with 10 ng of sample cDNA, 0.3mM of each primer, and 1XPower SYBR Green PCR Master Mix (Thermo Fisher Scientific-Applied Biosystems). Reactions were set up in a 384-well plate format with a Biomeck 2000 (Beckmann Coulter) and run in an ABI Prism7900HT (Thermo Fisher Scientific-Applied Biosystems) with default amplification conditions. Raw Ct values were obtained using SDS 2.3 (Applied Biosystems). Calculations were carried out by the comparative Ct method as reported in(95).
Significance was determined by a two-tailed unpaired t-test for means.
3.8. Dual-luciferase assay
HEK293 and U87MG cells were plated in 12-wells culture dishes at a density of 4×10⁴ cells/ml and
then co-transfected with a pNanoLuc- SIE reporter vector (Promega), pGL3-basic FireFly (Promega) and pDEST-EGFP-STAT3, p3xFLAG-TRIM8 or p3xFLAG-TRIM8 b-box deletion mutant constructs, using Lipofectamine® LTX (Thermo Fisher Scientific) according to the manufacturer's instructions. 48 h after transfection, firefly luciferase activity was monitored using the Dual-GLO® Luciferase Assay System (Promega) in a Glomax 96 microplate luminometer and was normalized to the Nano luciferase activity of the pNanoLuc-SIE vector for each transfected well.
3.9. Co-immunoprecipitation and western blot
cells were co-immunoprecipitated with anti-FLAG (Sigma) or anti-EGFP (Santa Cruz) using Dynabeads magnetic beads (Thermo Fisher Scientific) following manufacturer's instructions. Complexes were analyzed by SDS page electrophoresis and blotted with the indicated antibodies. Horseradish peroxidase conjugated anti-mouse (Santa Cruz) and anti-rabbit (Santa Cruz) antibodies and the ECL chemiluminescence system (GE Healthcare) was used for detection.
3.10. Isolation of nuclear and cytoplasmic extract
HEK293 and U87MG cells were plated in 60mm culture dishes transfected with the indicated plasmids. After 48 h, cells were harvested and fractionated. Nuclear and cytoplasmic extraction was prepared using an NE-PER Nuclear Cytoplasmic Extraction Reagent kit (Pierce) according to the manufacturer's instruction. Protein concentrations of cytoplasmic and nuclear extracts were measured using the Pierce 660 nm protein assay (Thermo Fisher Scientific) with the GloMax Discover System (Promega). Nuclear and cytoplasmic extracts were resolved by SDS page electrophoresis and blotted with anti-STAT3 (79D7, Cell Signaling), anti-Phospho-STAT3 (Tyr705, Cell Signaling), anti-LaminB (Santa Cruz) and anti-αtubulin (Sigma). ImageJ software was used to quantify band signal intensity. Values are expressed as fold differences relative to the endogenous STAT3 protein, set at 1.
3.11. DNA-binding assay
HEK293 cells were plated in 100mm culture dishes at a density of 5×10⁵ cells/ml, transfected with
the indicated plasmids. After 48 hours, cells were lysed in RIPA buffer. Protein concentrations of cell lysates were measured as described above and incubated with the immobilized STAT3 Consensus Oligonucleotide Sepharose conjugate (Stat3 Consensus oligonucleotide sequence: 5’-GATCCTTCTGGGAATTCCTAGATC-3 ′ ) (Santa Cruz, sc-2571 AC) in binding buffer, according to the manufacturer's instruction. Samples were centrifuged, washed and eluted from the beads by using Elution Buffer. Then, SDS–PAGE was performed.
3.12. Cell sonication
HEK293 and U87MG cells were plated in 60mm culture dishes and transfected with FLAG-TRIM8, EGFP-STAT3 and/or empty vectors. 48 hours after transfection, cell pellets were lysed in RIPA buffer and then the suspension was sonicated with a microtip attached to UP50H sonifier, 40% amplitude, and constant power 12 times for 60 s, allowing the suspension to cool on ice for 1 minute between pulses. After sonication, the spread of size fragments was checked by running 1 μl of total cell lysate on a 1% agarose gel.
3.13. Immunoprecipitation and mass spectrometry analysis.
Mouse embryonic neurospheres were lysate in Lysis Buffer (150mM NaCl, 50mM Tris-HCl, pH 7.4, 1mM PMSF, 1% NP-40, and cocktail of proteases inhibitors). Total protein extracts were
pre-cleared and incubated overnight at 4°C with M2 anti-FLAG magnetic-conjugated antibodies beads (Sigma). Beads were washed with lysis buffer containing up to 300mM NaCl. The retained protein complexes were eluted by competition with FLAG peptide for 5 hours at 4°C. Protein components were then fractionated by 8-15% gel for SDS-PAGE and protein bands, stained with colloidal blue Coomassie (Pierce), were excised from the gel and subjected to proteomic procedure for protein identification(96). Nanoscale liquid chromatography coupled to tandem mass spectrometry
(nanoLC-MS/MS) analyses of peptide mixtures were performed on a LTQ-Orbitrap mass spectrometer (ThermoFisher Scientific) equipped with a nano-electrospray ion source and coupled with a nanoEasy-LC II capillary HPLC system (Proxeon Biosystem). Samples were injected onto a capillary chromatographic system consisting of a 2 cm length trapping column (C18, ID 100um, 5um) and a 10 cm C18 reverse phase silica capillary column (ID 75um, 3um) (ThermoFisher Scientific). A gradient of 80 minutes of acetonitrile eluents was used for separation (0.3μL/min flow rate). Mass spectrometry analysis was performed with a resolution set to 30,000 and a mass range from m/z 200 to 1800 Da. The five most intense doubly and triply charged ions were selected and fragmented in the ion trap. All MS/MS samples were analyzed using licensed Mascot software (Matrix Science) to search the UniProt database for mus musculus taxonomy. Searches were performed with 1-missed cleavage allowed, carbamidomethylcysteine as fixed modification, pyro-GLU with N-terminal glutamine, pyro-carbamidomethylcysteine with N-terminal CAM-CYS, methionine oxidation as variable modifications.
3.14. Silencing experiments.
Stealth RNAi duplexes against human TRIM8 (Thermo Fisher Scientific, TRIM8HSS129955; TRIM8HSS129956; TRIM8HSS188606) and stealth RNAi negative control (Thermo Fisher Scientific) were transfected in HeLa, HF and U87MG cells using Lipofectamine RNAiMAX (Thermo Fisher Scientific) according to the manufacturer's protocol. TRIM8-silencing was confirmed by Western Blot analysis using anti-TRIM8 C-20 (Santa Cruz) and by qPCR.
3.15. Fluorescence and confocal microscopy.
Immunostaining analysis were carried out as reported in(95). Cells were seeded on glass coverslips
and, 24 hours after RNA interference, fixed with 100% methanol, incubated in blocking solution containing PBS and 1% bovine serum albumin (BSA), and counterstained with α-TRIM8 (1:500, Sigma), α -tubulin antibody (1:1000, Sigma), γ -tubulin antibody (1:1000, Sigma). After an incubation with Alexa Fluor 568 goat anti-rabbit IgG, Alexa Fluor 568 goat anti-mouse IgG, Alexa Fluor 488 goat anti-rabbit IgG, Alexa Fluor 488 goat anti-mouse IgG (1:500, Thermo Fisher Scientific) followed by DAPI (Molecular Probes), immunostained cells were covered with a drop of
780-META module and Leica TCS SP8 confocal microscopy (Leica, Wetzlar, Germany). Images were captured, pseudo-colored and analyzed by Leica LAS AF software.
3.16. Live-cell imaging.
Cells were seeded on 8-well slides (80826, ibiTreat, Ibidi) and observed under an inverted microscope (Eclipse Ti - Nikon) using a 40x objective. During the observation, cells were kept in a microscope stage incubator at 37°C and 5% CO2. Images were acquired over a 24 hours period by
using a DS-Qi1Mc camera. Image and video processing were performed with NIS-Elements AR 3.22.
3.17. Cell synchronization.
Cell synchronization was carried out on HeLa cells by plating cells onto 12 multi-well plates; after Stealth RNAi transfection (as described in silencing experiments section) Cells were treated with 4 mM thymidine in complete medium for 12 hours, washed twice with PBS, incubated for 12 hours in complete medium, and treated again for 12 hours with 4 mM thymidine in complete medium. The resulting G1/S-enriched cells were washed twice with PBS and released into the cell cycle in the presence of DMEM-10% FBS until the harvest time.
3.18. Metaphase Spreads and Karyotyping.
Human primary fibroblasts transiently transfected with control or TRIM8 shRNAs were treated with 50ng/mL Colcemid (Invitrogen-Life Technologies) for 2 hours before proceeding with metaphases preparations. Cells were collected and resuspended in a hypotonic solution of 2% KCl and 2% Na3C6H5O7 for 7 minutes at 37°C. Metaphase spreads were then prepared and stained with
Giemsa-trypsin (G-band) procedure. Analysis was carried out using the OLYMPUS BX41 microscope equipped with a BASLER scA1400-17gmASI digital camera. Images were analyzed using the Applied Spectral Imaging (ASI) software V7.0.6.8860. Unless stated differently, for each experiment at least one hundred metaphases for each sample were counted.
3.19. Flow cytometric analysis
HeLa synchronized cells were collected over indicated time points and fixed in 100% ethanol for 30 minutes at -20°C. Fixed cells were treated with RNaseA (Sigma) for 20 minutes at room temperature. Cell cycle was determined by DNA stained with propidum iodide (Sigma) 10μg/ml in PBS. Flow cytometries were performed by MoFlo® AstriosTM (Beckman Coulter) and the data
4. RESULTS
4.1. TRIM8-driven transcriptomic profile identified glioma-related nodal genes and pathways
4.1.1. TRIM8-related transcriptomic profile
RNA-Seq revealed 1365 differentially expressed transcripts of 912 genes (Fig. 9A). 723 of them (corresponding to 648 RefSeq genes) differed significantly of at least 1.5 folds (192 upregulated transcripts of 178 genes and 531 downregulated transcripts of 470 genes). We next performed a pathway enrichment analysis obtaining that 80 genes, among all differentially expressed genes, significantly enrich 18 pathways by IPA analysis (Fig. 9B; table is not shown). 53% of these genes (43 out of 80 genes) are related to cell-morphology, cell death and survival, with a preponderantly representation of signalling pathways related to neurotransmission and to CNS, including axonal guidance, GABA Receptor, ephrin B, synaptic long-term potentiation/depression, and glutamate receptor (Fig. 9B; Tab. 1). Focusing on signaling pathways related to neurotransmission and to the CNS, we found that four out of five CNS-related pathways have in common the M-RAS gene (NM_008624, p-value=.0060, FC=−1.54), which encodes for a member of the Ras family of the small GTPases, specifically expressed in brain and heart (Fig. 9C, Tab. 1). Moreover, two out of five CNS-related pathways, the glutamate receptor and synaptic long-term potentiation/depression signalling, share GRM8 (NM_008174, p-value=.010, FC=−2.24), GRM1 (NM_001114333, pvalue=. 036, FC=8.19), and GRIA4 (NM_0011, p-value=.044, FC=1.68) genes (Fig. 9C).
4.1.2. Gene set functional enrichment analysis
In a research of the most represented over-represented diseases and biological functions, we performed a gene set enrichment analysis that yielded 68 significantly represented biological functions grouped into different processes (Fig. 9D, table is not shown). These line up with the classes of enriched pathways, which can be ascribed in neurological, neurotransmission, transport and cellular organization-related functions. Among the differentially expressed genes, VEGF (NM_001110268, p-value=.017, FC=−16) is the most pleiotropic gene, since it participates to 51 out of 68 biological functions (Tab. 1) and 4 pathways out of 18 (table is not shown).
Figure 9. TRIM8-related transcriptomic profile in neural stem cells. (A) Volcano plot of 722 differentially
expressed transcripts (orange-coloured). (B) Forest plot (left) reporting 18 significantly enriched pathways, log(p-value) > 1.3; Stacked bar plot (right) accounting for proportions of upregulated and downregulated genes for each pathway.
(C) EULER diagram representing the number of genes participating to five signalling pathways related to
neurotransmission and to the CNS. (D) Treemap representing over-represented diseases and biological functions, grouped into processes, as calculated by IPA. Predicted activated processes are coloured in red, while inhibited processes are coloured in green, according to the inferred zs. Sizes of squares are proportional to -log(p-values). The greater a square, the more significant the enrichment of the function it corresponds to.
4.1.3. Validation of RNA-Seq data
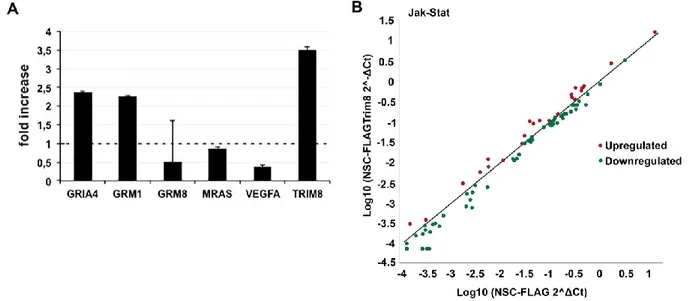
RNA-Seq analysis revealed a set of genes that resulted differentially expressed. In order to validate this result, we measured the expression of GRIA4, GRM1, GRM8, MRAS, and VEGFA genes by qPCR analysis on eNSC infected with a retrovirus expressing FLAG-Trim8, compared to that of control cells. Accordingly with the RNA-Seq data, we showed an up-regulation of GRIA4 and
GRM1 (FC: 2.37; 2.26, respectively) and a down-regulation of GRM8, MRAS, and VEGFA (FC:
0.5; 0.86; 0.37, respectively) (Fig. 10A).
Interestingly, the pathways enrichment analysis revealed a perturbation of many genes related to the JAK-STAT signaling pathway. Therefore, we verified the differential expression of a set of genes associated to JAK/STAT using a commercial PCR array. The panel of mouse genes includes nuclear co-factors, receptors and co-activators associated with the Stat proteins, Stat-inducible genes, and negative regulators of the Jak-Stat pathway. We monitored a global dysregulation of the Jak-Stat pathway in accordance to RNA-Seq data in eNSC infected with a retrovirus expressing FLAG-Trim8, compared to control cells (Fig. 10B). For instance, Epor, Jak1, and Smad5 were found significantly down-regulated while Stat3 up-regulated in overexpressing FLAG-Trim8 eNSC, compared to control cells, respectively.
Figure 10. Validation of RNASeq data. (A) qPCR analyses were carried out on eNSC infected with a retrovirus
expressing FLAG-TRIM8 or FLAG as control. Data were normalized to the expression of β-actin and L41. Bar represents the average of three replicated experiments±standard errors. (B) The graph plots the log10 of normalized
039Y. The central line indicates unchanged gene expression. Symbols outside the delimited area indicate fold-differences larger than a threshold that we set to 1. The red symbol in the upper-left corner readily identifies up-regulated genes, and the green symbols in the lower right corner readily identify down-up-regulated genes. Values were derived by taking the means of fold changes of three biological replicates per time point.
4.1.4. Correlation of CNS and glioma-related genes expression with TRIM8 in TCGA cohort
Recently, we evidenced a significant increase in the risk of death and disease progression in WHO grade III gliomas with low TRIM8 expression levels compared to those with high mRNA levels(53).
Our expression data showed that the transcriptional levels of a number of CNS- and glioma-related genes, such as GRIA4, GRM1, GRM8, EPOR, SMAD5, MRAS, STAT3, and VEGFA, were significantly perturbed by TRIM8 expression. Therefore, we investigated whether a correlation may exist between the transcriptional level of TRIM8 and these brain-related genes in a cohort of 530 Low Grade Glioma (LGG) and 166 Glioblastoma (GB) tissues from The Cancer Genome Atlas (TCGA) Research Network. The analysis revealed a significant positive correlation in LGG cohort between the expression of TRIM8 and GRIA4, while a significant negative correlation was found between TRIM8 and STAT3 and VEGFA. With regard to the GB cohort, TRIM8 expression positively correlates with GRM1 and STAT3 transcriptional levels (Fig. 11A).
In order to examine the prognostic value of combined TRIM8 expression with the transcriptional levels of the above selected genes, we performed a survival analysis through Log-Rank test in the TCGA cohort of LGG and GB tissues. Survival analysis estimated a significant decrease of death-risk in LGG patients with: i) high TRIM8 expression associates to low GRIA4 expression, compared with low TRIM8 and low GRIA4; ii) high TRIM8 with high VEGFA or STAT3, compared with low
TRIM8 and high VEGFA or STAT3. Analyzing GB tissues, Kaplan-Meier survival curves
highlighted that high TRIM8 expression with low STAT3, compared with high TRIM8 and high
STAT3, was co-related to favorable clinical outcomes in glioma patients (Fig. 11B). These data
suggested that such expression combination might be a useful supplement to the repertoire of clinicians for predicting survival time of glioma patients and that the ability to use just one or a handful of genes to predict outcome could have an impact on therapeutic treatments.
Figure 11. Correlation of CNS and glioma-related genes expression with TRIM8 in TCGA cohort. (A) Spearman
correlation between TRIM8 and GRIA4, STAT3, VEGFA, and GRM1 transcriptional levels. Graphical representation of log-transformed RPKM of 6 genes identified by RNA-Seq in a cohort of LGG and GB of The Cancer Genome Atlas Research Network (y axis) and TRIM8 (x axis). Colors represent the density of observations at paired expression values. Higher densities are represented by red regions and lower densities are in blue, while yellow and green regions have intermediate densities that go from higher to lower, respectively. (B) Kaplan-Meier curves for Overall Survival according to RNA-Seq FPKM from LGG and GB TCGA data. We performed the Log-Rank test between the combinations of TRIM8 expression groups and those made by other relevant genes.
4.1.5. TRIM8 physically interacts with STAT3
Our results showed that both STAT3 and TRIM8 expressions were significantly correlated in glioma tissues and associated to clinical outcomes in glioma patients. Therefore, based on all these
Co-immunoprecipitation experiments demonstrated that overexpressed TRIM8 and STAT3 self-associate in both HEK293 (Fig. 12A-B) and U87MG cells (Fig. 12C). To delineate the minimal motif regions involved in TRIM8-STAT3 interaction, we used a set of STAT3 and TRIM8 deletion mutants (Fig. 12D). We found that TRIM8 interacts with all STAT3 mutants, but with the C-terminal construct expressing only the transactivation domain, from amino acid 688 to the end of the STAT3 protein. This data suggests that the SH2 domain of STAT3 is required for the efficient binding of TRIM8. The physical interaction between TRIM8 and STAT3 persisted also when we used STAT3Y705F, a construct expressing a dominant-negative STAT3 mutant harboring a substitution of tyrosine 705 to phenylalanine, which fails to be phosphorylated, suggesting that the STAT3 phosphorylation status is dispensable for TRIM8 interaction (Fig. 12E). Finally, to understand if even some TRIM8 specific domains were involved in this interaction, we tested the TRIM8 deletion mutants, founding that all mutants retain the ability to interact with STAT3 (Fig. 12D-F).