Università Politecnica delle Marche
Scuola di Dottorato di Ricerca in Scienze dell’Ingegneria Curriculum in Energetica
---
Lean implementation and its relationship
with operational responsiveness, failure
factors and resilience
Ph.D. Dissertation of:
Ilaria De Sanctis
Advisor:
Prof. Filippo Emanuele Ciarapica
Curriculum supervisor:
Prof. Maurizio Bevilacqua
XV edition - new serie
Università Politecnica delle Marche
DIISM- Department of Industrial Engineer and Mathematical Science Via Brecce Bianche — 60131 - Ancona, Italy
Acknowledgements
I want to express my recognition to:
Università Politecnica delle Marche, Professors M. Bevilacqua and F. E. Ciarapica that finance my Ph.D project and actively cooperate to the development of this research.
Universidad Politécnica de Madrid that host me for 9 mouths and Professor J. Ordieres-Merè that support my researches and actively cooperates to the development of this research.
JMAC Europe consulting firm which support the collection of Lean Barriers data.
Center for Leadership Mannheim consulting firm, which provides anonymized organizational data helping the development of the lean structural network model.
vi
Abstract
Lean Management (LM) is a multi-faceted socio-technical approach that requires organizations to strive along several dimensions simultaneously. Initially, a conceptual model has been proposed for investigating the network of influences among lean practices, operational responsiveness and company growth performances in Italian companies. A structural equation modelling and a second order confirmatory factor analysis have been used to test the hypothesized relationships in the structural models.
Secondly, including manufacturing firms belonging to 23 different countries, the factors influencing the success of LM and human, cultural, economic, strategic and supply chain integration barriers during the start-up and the sustainment phase of lean projects have been analysed.
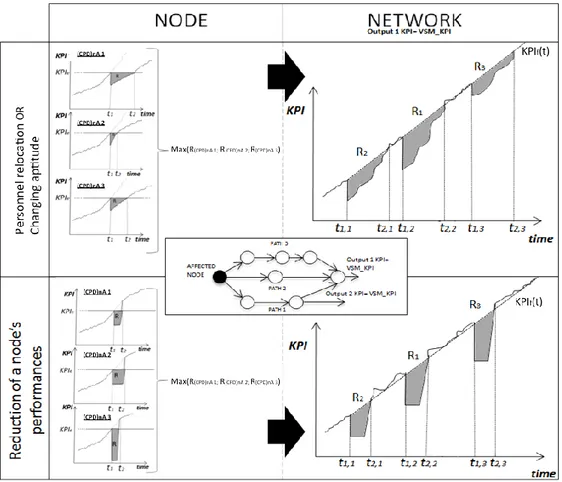
Thus, taking an organizational network view, this thesis provides a definition for Resilience and a model able to calculate the resilience of a lean organization taking into account both the organizational topology as well as the attitude and the learning curves of operators. Nodes have been modelled using the Hidden Markov Model and characterized by a learning curve. The resilience is calculated as the area included between the KPI trend during the time of the disruption event and the straight line parallel to the time axes. A case study has been analysed to explain the proposed model.
Results of this thesis highlights that the operational responsiveness is only partially connected to a Lean strategy of a company and there is no direct relationship between lean bundles and firm’s performances. In addition the results revealed that some cultural aspects such as Performance Oriented and Gender Egalitarianism help to maintain a lean culture. Finally, results from this study will have a practical implication assisting human resource managers and production managers in predicting and evaluating global and local effects of the personnel relocation and possible reduction in performance of the workstations.
vii
Contents
Chapter 1. ... 1
Introduction 1.1 Project Background ... 1
1.2 Lean practices, operational responsiveness and company performances in Italy…………. ... 3
1.3 Lean barriers ... 5
1.4 Lean structural network resilience ... 7
1.5 Description of Tasks ... 7
Chapter 2. ... 11
Literature Review 2.1 Lean practices responsiveness ... 11
2.1.1 Responsiveness 2.1.2 Lean practices and bundles of lean practices 2.1.3 A model of lean practices responsiveness: Theoretical foundation 2.2 Lean difficulties review……….…………... 39
2.2.1 Strategic Barriers 2.2.2 Economic Barriers
2.2.3 Supply Chain integration Barriers 2.2.4 Human Barriers
2.2.5 Cultural Barriers 2.2.6 National Culture
viii
2.3 Knowledge sharing in Lean organizational network ... 57 2.3.1 Resilience in Lean organizational network
2.3.2 Factors affecting resilience
Chapter 3. ... 66 Research Methodology
3.1 Lean implementation, operational responsiveness and firms’ growth performances methodology ………...….66
3.1.1 Survey definition, evaluation and distribution 3.1.2 Sample Definition
3.1.3 Confirmatory factor analysis and structual Equation modeling
3.2 Lean barriers methodology ... 76 3.2.1 Lean Barriers survey definition
3.2.2 Lean Barriers sample definition
3.2.3 Lean Barriers survey evaluation and distribution. 3.2.4 Association rule analysis
3.2.5 Network Analysis
3.3 Lean Structural Network Resilience Methodology ... 85 3.3.1 Identification
3.3.2 Modeling of nodes behavior 3.3.3 Characterization of nodes
3.3.4 Network analysis and Resilience calculation
Chapter 4. ... 99 Results
4.1 Lean practices, operational responsiveness and firms' growth performances results ... 99
ix
4.1.2 Hypothesis testing 4.1.3 Endogeneity bias 4.1.4 Qualitative interviews
4.2 Results lean diffciulties……….…….111 4.2.1 Sample characteristics
4.2.2 Measurement scale assesses-Lean barriers 4.2.3 Network characteristics and visualization
4.3 Lean structural network resilience results………..…134 4.3.1 Nodes modelling and characterization results
4.3.2 Lean Structural Network resilience calculation
Chapter 5………145 Discussion
5.1 Discussion of results linking Lean practices, operational responsiveness and firms' growth performances………...…...………...145
5.1.1 Relationships between lean practices and operational responsiveness 5.1.2 Relationships between lean practices and growth performances 5.1.3 Relationships between operational responsiveness and growth performances
5.2 Lean barriers, discussion of results……….…………...153 5.2.1 Lean management implementation and success
5.2.2 Lean management Barriers in the start-up phase 5.2.1 Lean management Barriers in the maintaining phase
5.3 Lean structural network resilience discussion………...………160
Chapter 6..………….……… 162 Final remarks
x
Chapter 7……….……….………166
Limitation and future developments References ... 168
Appendices ... 181
Appendix 1……….………182
Appendix 2……….…187
xi
List of Figures
Figure 1 Pareto analysis of lean bundles. Figure 2 Pareto analysis of lean practices.
Figure 3 Research model linking lean best practices, operational responsiveness and firm growth performances.
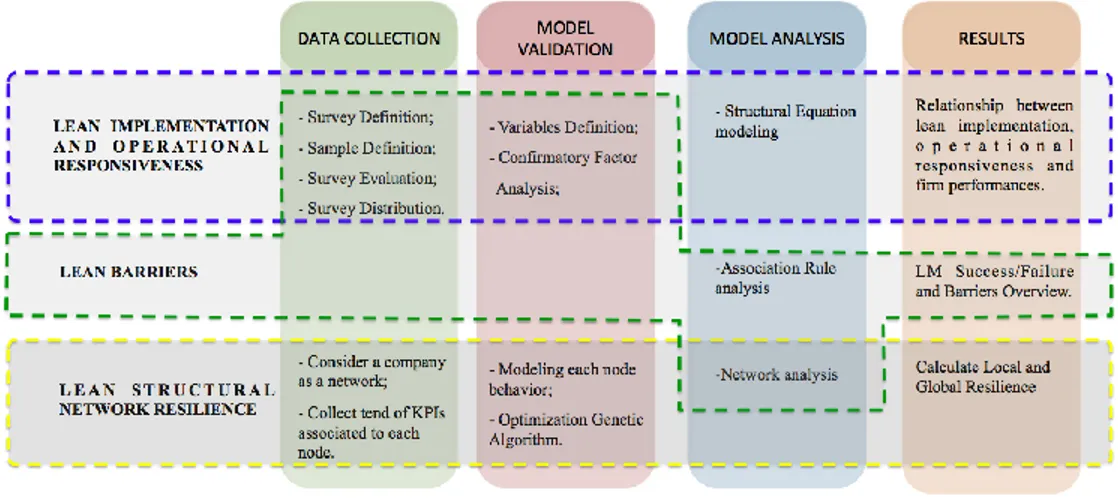
Figure 4. Lean difficulties research model. Figure 5 General methodology.
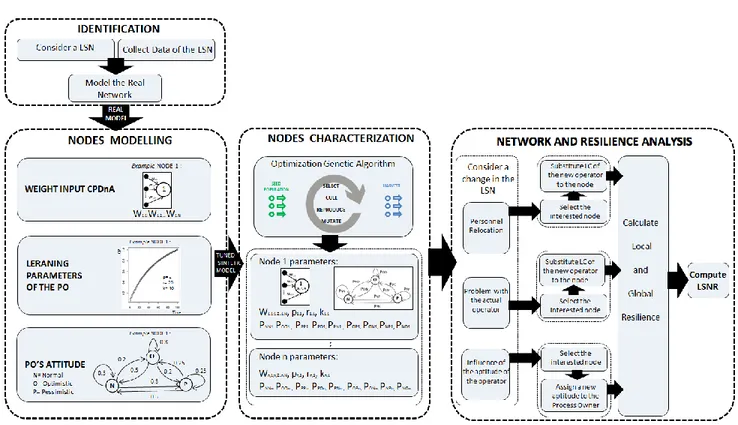
Figure 6. Detailed methodology of Lean structural Network Resilience study. Figure 7 Node and network Resilience calculation.
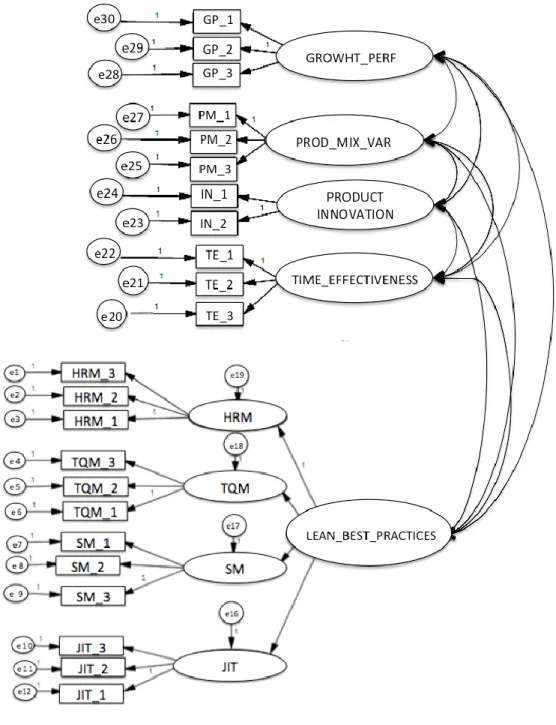
Figure 8 Initial model CFA. Figure 9 Final structural model.
Figure 10 Respondents to Lean Barriers survey. Figure 11 LMI Network.
Figure 12 LSUD Network. Figure 13 LMAD Network.
Figure 14 Organigram of the eleven managers considered as case study. Figure 15 Lean structural network case study.
Figure 16 Node 3 and Node 6 example of characterization
Figure 17 Example of LSNR calculation when the machine associated to node 4 is affected by a problem.
Figure 18 Example of LSNR calculation when the process owner associated to node 4 is substituted by a process owner with a different learning curve (k=50; p=5; r=20).
xii
Figure 19 Trend of KPI associated to CPDnA 14. Local effect of change of aptitude from normal to pessimistic from t= 40.
xiii
List of Tables
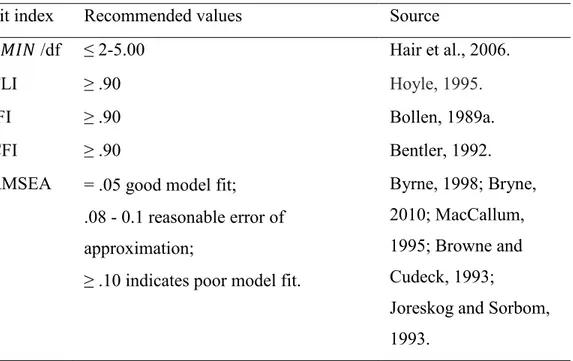
Table 1 Systematic literature review steps. Table 2 Responsiveness observed variables. Table 3 Lean practices classification. Table 4 Assessment of goodness-of-fit. Table 5 Validity and Reliability.
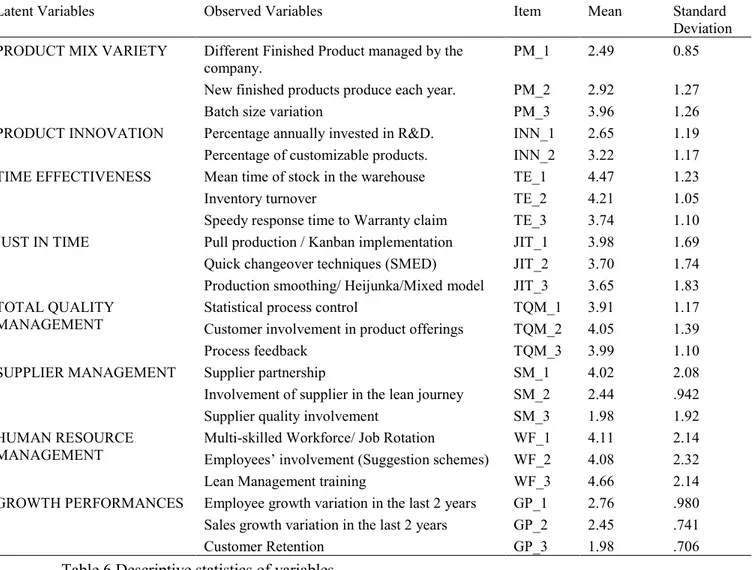
Table 6 Descriptive statistics of variables.
Table 7 Parameter estimates. Standard errors. Critical ratios. Table 8 Results of Structural equation modeling.
Table 9 Effect of control variables. Table 10 Sample distribution.
Table 11 HLP, SLP and descriptive statistics.
Table 12 Lean start-up difficulties (LSUD) and descriptive statistics. Table 13 Lean maintaining difficulties (LMAD) and descriptive statistics. Table 14 LMI model.
Table 15 LSUD model. Table 16 LMAD model.
Table 17 Node centrality for LMI, LSUD, LMA network. Table 18 Node 4 characterization.
Chapter 1.
Introduction
1.1 Project Background
The current landscape in manufacturing leads to an intensified competition, where old methods can no longer reach the same results nor can they respond to the fast changing situation (World Economic Forum, 2015).
Indeed in the last few years, organizations have been forced to respond to a complexity of several factors in a context of ever-changing dynamics and competition on a global scale (Simchi-Levi et al., 2012). New markets are continually emerging in different areas of the world and are making the way to satisfy the need for closeness to customers, which always becomes more complex in terms of product-service requirements. In order to survive in the present world turmoil, companies must seek to improve their processes, systems and technologies to be able to be dynamic and flexible to meet the on-going changes in the market.
Driven by the success performed by Toyota and several other organizations worldwide, a growing number of firms have begun a Lean journey to fulfil market needs and improve their processes (Bevilacqua et al., 2016).
Lean Management (LM) is a multi-faceted socio-technical approach with the aim of reducing or eliminating non-value-added activities throughout a product’s entire value stream, within an organization and along its supply chain network (Bortolotti et al., 2015a; Holweg, 2007; Narasimhan et al., 2006). But, although Toyota has had amazing performance and a number of cases reporting large benefits from lean implementation (Moyano‐ Fuentes and Sacristán‐ Díaz, 2012), a lot of scepticism still remains regarding results that could be really achieved and the possibility to apply Lean approach outside high volume manufacturing.
As this topic is particularly significant in countries like Italy, where SMEs are a dominant portion of the manufacturing industry and mainly compete on large variety and high customization products the first part of this thesis developed a conceptual model for investigating the network of influences among lean practices, operational responsiveness (product mix variety, product innovation and time effectiveness) and company growth performances in Italian companies.
In addition, as attractive as the lean philosophy might initially seem, there are numerous barriers that hinder the adoption of LM and it is quite difficult to implement it correctly and successfully. Indeed LM is a multi-faceted socio-technical approach that requires organizations to strive along several dimensions simultaneously. Thus, the second part of this thesis aims to join recent researches about lean barriers, studying the combined effect of factors influencing the success of LM and human, cultural, economic, strategic and
supply chain integration barriers during the start-up and the sustainment phase of lean projects.
Finally, the complexity associated with the dynamics in organizational processes in the 21st century such as mobility of the workforce, ever-changing product portfolios and their related value stream adjustments are some of the obstacle that Lean Leaders may face when implementing and sustaining Lean in their organizations. Thus, taking an organizational network view, the third part of this work provides both a definition for Resilience as well as a coherent criteria to quantify the Lean Structural Network Resilience (LSNR) to the lean transformation associated with the mentioned changes in the organization.
1.2 Lean practices, operational responsiveness and
company performances in Italy
The first part of this thesis has been carried out with three objectives in mind. The first objective is to establish the theoretical associations between lean best practices and the operational responsiveness of manufacturing companies. Indeed, in a dynamic context, the ability to be reactive to changing market demand and meeting requests rapidly and effectively is a prerogative (Abdolvand et al., 2015; Gligor et al., 2015; Narasimhan et al., 2006).
The second objective regards the analysis of the impact of operational responsiveness latent variables on company performance.
Thirdly, the direct impact of different Lean best practices on company growth performances is studied.
Moreover, we checked if the omission of concept such as sector, company size and market share lead to endogeneity bias.
In order to achieve these objectives, we developed some specific research hypothesis and a survey where LM best practices implementation (supplier management, human resource management, just in time and total quality management practices), operational responsiveness (Product mix variety, Product innovation, and Time effectiveness) and company performances have been considered. Hence, even if this study is limited to the Italian manufacturing firms, it could be representative for all companies that are operating in a context of economic instabilities and market changes. At the European Union level, companies are facing many obstacles due to macroeconomic instability. Europe is facing the so-called “anemic growth”: a slow growth of the labour force and total factor productivity and a slow rate of innovations (Salvatore, 2015). The Italian industrial situation well represents this European condition. In particular, since 2008, the Italian economy has experienced two consecutive recessions, characterised by a decline in exports between 2008 and 2009, and a decline in the domestic demand from 2011 onwards which hit the SMEs harder than the large enterprises (“Enterprise and Industry ITALY 2014 SBA Fact Sheet.,” 2015).
1.3 Lean barriers
Literature reveals numerous barriers hindering the adoption of Lean. Ringen and Holtskog (2013) sustained that of every three Continuous Improvement initiative projects in general, two fail to attain the expected results. In 2006, research conducted in the UK organizations implementing Lean showed that fewer than 10% of the organizations have implemented it successfully (Bhasin and Burcher, 2006). Moreover, the organizations are usually reluctant to even admit that the Lean implementation has failed, not to mention giving an exact reason for the failure.
Hence, due to the many challenges or barriers faced during the lean deployment, recent studies present analyses of research on lean barriers’ identification through literature reviews (Albliwi et al., 2014; Jadhav et al., 2014), surveys (Bhasin, 2012a; Laureani and Antony, 2012) or specific case studies (Dora et al., 2016; Souza and Pidd, 2011).
These studies are definitely a precious contribution to the current knowledge. Indeed, while many studies have delved into lean constructs and tools, far fewer have explored the critical aspects. Some of them are limited to a single case study, and others consider lean barriers differently on country location, industries sector, size of the organization, and context, lacking a complete overview.
Studies proved that the environment context may affect the outcome of lean implementation. Indeed a lot of scepticism still remains regarding results that
could be achieved in environments with high demand variability (Azadegan et al., 2013; Bruce et al., 2004; James‐ Moore and Gibbons, 1997).
Several studies demonstrated that even company size is a factor that affects a successful lean implementation (Achanga et al., 2006; Kull et al., 2014; Yang et al., 2011a). But, company size is just one of the numerous factors that affect the level of lean implementation.
Operational performance differences come up when organizations in different cultural contexts invest in identical practices (Wiengarten et al., 2011). Kull (2014) demonstrated that aside from company size, a nation’s culture moderates the LM’s effect on operational performance. Moreover, in their study they tried to explain why the national culture impacts LM effectiveness. Many scholars tried to formalize the ideal culture for a successful LM implementation (Kull et al., 2014; Wincel and Kull, 2013). A limit of these studies is that they do not examine how facility culture interacts with national culture to influence LM effectiveness.
The search of the reviewed papers illustrated that there is a limitation in the publication of the factors that lead to lean failure. Indeed, although researches have addressed lean barriers from different points of view, they neglected that all these aspects could be inter-correlated and influence each other. Understanding how these factors condition each other will enable managers starting the lean journey in their companies, or managers sustaining the gains, to be aware of aspects that may damage or enhance lean success.
Moreover, implementing a change is hard for many individuals, but sustaining it is even harder. Frequently, after the initial enthusiasm where change occurs,
people will revert back to their old habits where they feel comfortable. Maintaining a sense of urgency and a significant level of interest is difficult over time (Sabri and Shaikh, 2010). Although the sustaining phase is the most difficult phase in any transformation project, there is relatively little research concerning sustaining phases of changes in organizations (Sabri and Shaikh, 2010).
The second part of the thesis addresses the above research gaps, joining all the aspects mentioned and differentiating the initial and the sustaining phases of a lean implementation. Thus, a combined effect of country culture, company environment, lean effectiveness and difficulties in different stages of the lean project will be analysed and discussed in the next chapters.
1.4 Lean structural network resilience
LM is more than redesigning some production processes, knowledge flows between different roles in organization need to be taken into account and analysed (Dombrowski, Mielke, & Engel, 2012). Indeed organizations, as communicating entities, require people to communicate and exchange information. Diez et al. (2015a) proposed a standardized technical formal
communication through an evolution of Deming cycle: (CPD)nA (Check , Plan,
Do n times, Act). They have demonstrated that it brings enormous benefits in value stream performance, in sustaining knowledge creation, by learning faster
and continuously improving. Moreover, using (CPD)nA is a way to represent communication and knowledge interchange by means of the interrelationship between its processes according to its related KPIs.
Focusing the attention on the growing number of organizations that are starting or sustaining a Lean journey, the concept of resilience takes on the meaning of being efficient with stabilized processes, reduced supply chain variability and being resilient with low inventory levels (Martin & Rutherford, 2004; Pal, Torstensson, & Mattila, 2014; Puchkova, Srinivasan, McFarlane, & Thorne, 2015). Several authors recognize that such companies are probably developing a better resilience than very stable groups (Kamalahmadi & Parast, 2016; Pal et al., 2014; Reggiani, Graaff, & Nijkamp, 2002).
Holling (1973) was one of the pioneers to conceptualize resilience ‘as the ability of a system to absorb changes’. Since then, many authors echoed the concept of resilience as a system’s ability to bounce back, that is, its ability to recover quickly and continue to perform its task after occurrence of a disruption event (Ponomarov & Holcomb, 2009). Therefore being resilient and hence capable of surviving, adapting, sustaining the business and responding rapidly to changes in the business environment is becoming a perquisite for today firms (Ates & Bititci, 2011; Sheffi, 2005a). However, regarding the metrics of an organization’s resilience, literature mainly focuses on metrics that take into account KPIs’ trend against their stated objectives, omitting the interconnection between the processes of the value stream (Brunsdon, Seville, & Vargo, 2007; Dalziell & McManus, 2004).
Although literature underlines the important role of people communication, coalition and training as crucial in building a resilient firm (Lengnick-Hall, Beck, & Lengnick-Hall, 2011; McElroy, 1996; Pal et al., 2014), there is a lack of consideration of resilience for lean organizations.
Enterprise’s resilience metrics focusing on networks have been used mainly for analysing supply chain configurations. Therefore, the network’s metrics consider the disruptive event mainly as an interruption of the connection between two nodes, omitting the possibility of a disruption event that primarily affects the node and does not compromise the linkages.
Instead, in this third part of the thesis the interest is to assess the resilience of the company, regarding its intrinsic structure defined by the processes it implements, against two major effects:
- The local instability at process level, represented by unexpected shortages in the KPIs describing the performance of such a process.
- The relocation of process owners, which can be described not as only replacing a specific process owner and having different individual characteristics but also as a different learning curve and different attitude. Hence, through this research we address these literature gaps developing and testing a model able to calculate the resilience of a lean organization taking into account both the organizational topology as well as the attitude and the learning curves of operators.
Results from this study will have a practical implication assisting human resource managers and production managers in predicting and evaluating global and local effects of the personnel relocation and possible reduction in
performance of the workstation in organizations that are facing a Lean Journey.
1.5 Description of Tasks
The organization of this thesis is as follows.
After this introduction, in Chapter 2 a literature review has been carried out to investigate Lean practices implementation and their relationship with operational responsiveness and company performances, the main Lean barriers faced by companies and the concept of resilience and knowledge sharing in Lean organizational networks. The research models used for developing these research topics has been presented in Chapter 3. Chapter 4 reports the results of the statistical analysis carried out. A discussion regarding the results obtained and has been developed in Chapter 5. Finally, some concluding remarks and future development are presented in Chapter 6 and 7.
Chapter 2.
Literature Review
A literature review about the main concept debated in this thesis will be developed in the following sections.
2.1 Literature review of lean practices, operational
responsiveness and firms’ growth performances.
The first phase of our research consisted in defining a theoretical framework supporting the network of influences among lean practices (supplier management, human resource management, just in time and total quality management practices), operational responsiveness (Product mix variety, Product innovation and Time effectiveness) and company growth performances in Italian companies. Through the result of this section we developed a survey analysis and the questionnaire to be submitted to the Italian companies.
To that end, a literature review was conducted in order to identify the main lean practices and the characteristics in order to describe the operational responsiveness and company performance.
A systematic literature search was conducted according to the steps explained in table 1. The analysis of these articles allowed us to define for each main
variable (Responsiveness and Lean best practices) the factors to take into account.
Step Activity Description
Step 1 Database identification for
literature review
Database: Emerald, Metapress, Science Direct, Scopus and Web of Science
Step 2 Keywords definition Keywords: “Lean Practices”,
“Lean Tools”, “Lean
Manufacturing”, “Just in Time
Practices”, “Lean Bundles”,
“Lean Production” and “Lean management”,
“Responsiveness”, “Operational Responsiveness”,
“Manufacturing Flexibility”,
“Firm Performance” and
“Company Performance”
Step 3 - Filter 1. Articles must
contain the keyword search in the title, abstract or keywords;
- Filter 2. Consider only English language articles.
Filters application for ensuring the papers adequacy: 158 papers were identified
Step 4 - Filter 3. Abstracts have
been read for analysing article relevance.
- Filter 4. Remaining full articles should be read for substantive relevance.
Filters application for ensuring the papers relevance: 46 papers were defined as relevant for this literature review study.
2.1.1 Responsiveness
Operational responsiveness means responding immediately to events, changing conditions, and customer actions with a minimum of extra steps or mistakes, so business gets done quickly and effectively (Choi and Krause, 2006).
In literature, several factors have been used to measure the company operational responsiveness. Hallgren and Olhager (2009) consider responsiveness as the simultaneous achievement of flexibility and delivery performance. Analysing a large sample of manufacturing companies, these authors highlighted that delivery and flexibility (i.e. flexibility to change product mix, and flexibility to change volume) are the most important operational responsiveness factors. Danese (2013) used four factors for measuring company and supply chain responsiveness: on-time delivery, fast delivery, flexibility to change product mix, and flexibility to change volume. While some researchers (Mark Stevenson and Martin Spring, 2007; Reichhart and Holweg, 2007) address “delivery flexibility”, other researchers ignore this dimension. Also the concept of product flexibility is not generally accepted. Reichhart and Holweg (2007) define “product flexibility” as the ability both to introduce new products and to make changes to existing products whereas Koste and Malhotra (1999) make a distinction between “new product flexibility” and “product modification flexibility”. Regarding the product innovation Sisodiya et al. (2013)
investigated relationships among these factor and network spillovers, the industry context and responsiveness. Williams et al. (2013) measured responsiveness as external flexibilities rather than internal resource flexibilities. External flexibilities pertain to operating responses, rather than to specific resource characteristics such as labour flexibility or machine flexibility.
Many studies focus on the speed of response aspect in addition to the flexibility in order to reach operational responsiveness (Martin Christopher and Helen Peck, 2004; Matthias Holweg, 2005; Meehan and Dawson, 2002; Towill and Christopher, 2002). Prater et al. (2001) maintain that as the levels of speed and flexibility in a supply chain increase, the level of supply chain responsiveness increases.
In order to provide an analysis that will cover the main aspects of the operational responsiveness, we shift it into 3 impact areas: Product mix variety, Product Innovation and Time effectiveness.
Different reasons led us to select these impact areas. First of all, we had to choose impact categories that could be referred to internal responsiveness of the company and not connected to the company supply chain, since the survey we carried out in this work referred to a single company.
Moreover, these three impact areas have been frequently connected to the implementation of lean practices. Finally these impact areas allowed us to collect quantitative data and not only qualitative opinions (i.e.
using Likert scales) from the companies’ sample. In particular, some observed variables have been connected to the three impact areas according to a literature review. These observed variables are shown in table 2 (see also section 2a of Appendix 1) and explained below.
Product mix variety
Responding to wide ranges of quantities demanded and handling large variety of standard and innovative products are some of the characteristics included in the definition of operational responsiveness (Chopra and Meindl, 2004). Indeed, operational responsiveness is an advanced level of flexibility to meet customer and market requirements. Volume flexibility enables firms to satisfy customer requests by producing the exact amount of product ordered. It enables firms to increase production volume quickly in response to unanticipated needs and to reduce volume quickly to avoid high inventory level (Jack and Raturi, 2002; Zhang et al., 2003). A high batch size variation means that the manufacturing process is affected by uncertainty and variation of the demand and it demonstrates the ability to reconfigure the production system. Moreover, in order to be competitive in today’s increasingly globalized context, having a wide range of new finished products produced each year is particularly relevant for the economy of enterprises (Lewellyn and Bao, 2015).
Product Innovation
Markets today are increasingly volatile and therefore less predictable. So, building innovative products satisfying customer requests is included in the characteristics of operational responsiveness in order to be a competitive and a successful organisation (Chopra and Meindl, 2004; Kisperska-Moron and de Haan, 2011). Investing in R&D processes to create knowledge and generate innovation is particularly relevant for firms competing in today’s increasingly competitive globalized knowledge-based economy (Lewellyn and Bao, 2015). Consequently, R&D investment was considered as one of the key aspects to be evaluated.
Time effectiveness
Meeting short lead time is even one of the key characteristics included in the definition of operational responsiveness (Chopra and Meindl, 2004). Indeed, for some customers, delivery reliability is not enough; delivery speed is also necessary to win the order. The speed of the product processing time and delivery has been recognized as a competitive priority in many studies (Arnas et al., 2013; Devaraj et al., 2004; Wang and Cao, 2008; Ward et al., 1996). So, in order to evaluate the importance that respondents place on time category, the inventory turnover has been evaluated. Moreover, for improving company responsiveness, response time to Warranty claim plays a fundamental role (Evangelos Psomas et al., 2014; Wheeler, 2013).
Main Factor Impact Area Observed
variables Source
Responsiveness Product mix variety
Different Finished Product managed by the company.
(Chopra and Meindl, 2004);
New finished products produce each year.
(Chopra and Meindl, 2004; Lewellyn and Bao, 2015) Batch size
variation
(Chopra and Meindl, 2004);
Product
Innovation Annual percentage invested in R&D.
(Lewellyn and Bao, 2015)
Percentage of customizable products.
(Chopra and Meindl, 2004; Kisperska-Moron and de Haan, 2011).
Time
effectiveness Mean time of stock in the warehouse
(Arnas et al., 2013;
Devaraj et al., 2004; Wang and Cao, 2008; Ward et al., 1996) .
Inventory turnover
(Arnas et al., 2013;
Devaraj et al., 2004; Wang and Cao, 2008; Ward et al., 1996).
Speedy response time to Warranty claim
(Evangelos Psomas et al., 2014; Wheeler, 2013). Table 2 Responsiveness observed variables
2.1.2 Lean practices and bundles of lean practices
LM is an integrated social-technical system comprised of highly inter-related practices that targets waste elimination, overall operational performance improvement, and strategic human resources management.
In order to identify the most important lean practices and bundles, a literature review has been carried out, taking into account not only the manufacturing practices but even the human aspect inside the firm and the supplier collaboration. In literature the lean practices were frequently associated to lean bundles. Different authors performed data reduction techniques to reduce multiple items into a smaller number in order to refer to each of them as a latent
variable or a factor.Sakakibara (1997)describe infrastructure practices (quality
management, workforce management, manufacturing strategy, organizational characteristics, product design) and JIT practices (set-up time reduction, schedule flexibility, maintenance, equipment layout, kanban and JIT supplier relationships). Flynn et al. (1995) studied Just in Time (JIT) and Total Quality Management (TQM) practices and their common infrastructure; similarly, Cua et al. (2001) analysed JIT, TQM and Total Productive Maintenance (TPM) as specific practices, as well as their infrastructure. Other authors such as Koufteros and Vonderembse (1998) and Mackelprang and Nair (2010) did not distinguish between different groups of practices.
Many authors referred to Shah and Ward (2003) classification of lean practices. Shah and Ward (2003), using performance dimensions same as McLachlin (1997), reported that LM is a collection of practices that work together
synergistically to create a streamlined, high quality system that produces finished products at the pace of customer demand with little or no waste. For them, practices commonly associated with LM include procedures for creating JIT flows, HRM and empowerment practices, equipment management and TPM, and various TQM practices. Two major forms of waste can be addressed by JIT through the associated practices: work-in-process inventory and unnecessary delays in flow time. TPM helps to maximize equipment effectiveness throughout its entire life, and TQM is aimed at continuously
improving and sustaining quality products and processes (Cua et al., 2001).The
fourth bundle, HRM, shows the work organization practices in LM. Always Shah and Ward, in a further work (Shah and Ward, 2007a), highlight that their four bundles account for only internally related lean practices and suggest the need for a model of lean that also includes supply chain related practices. According to this suggestion some authors introduced new bundles such as Supplier Management, Customer Management and Strategy Integration. In this context, Doolen et al. (2005), Nordin et al. (2010) and Abdul Wahab et al. (2013) incorporated new impact areas (manufacturing equipment and processes, shop floor management, product design, supplier management, customer management and workforce management) in their survey, with representative and supporting practices and activities associated with each impact area. Their survey provides an instrument to assess both the number and level of implementation of a broad range of lean practices by different organizations. Using Shah and Ward’s (2003) bundles of lean practices as a starting point, Bortolotti et al. (2015a) argued that their four lean bundles actually serve two
different purposes. In particular, they proposed that HRM and TPM bundles are part of a firm’s general fitness, laying the foundation for the more specific capabilities.
It is possible to highlight that in literature some practices changed their classification over time. For instance, the practice “lean management training” has been classified as JIT bundle by Sakakibara et al. (1993), as TQM bundle by Dow et al. (1999), as TPM bundle by McKone and Weiss (1999), while more recently there is an unanimously consensus to classify this practice as HRM (Arnas et al., 2013; Doolen and Hacker, 2005; Nordin et al., 2010; Wahab et al., 2013);
Moreover, some practices modified their classification due to the development of new bundle of lean practices. For instance, the practice “preventive maintenance” has been classified as JIT bundle in the early researches (Koufteros and Vonderembse, 1998; Sakakibara et al., 1993) while in recent works it is grouped as Total Productive Maintenance bundle (Gusman Nawanir et al., 2013).
The literature review, carried out according to the method proposed in section 2.1 (Table 1), provided 47 lean practices and 26 different bundles of lean practices (Table 3).
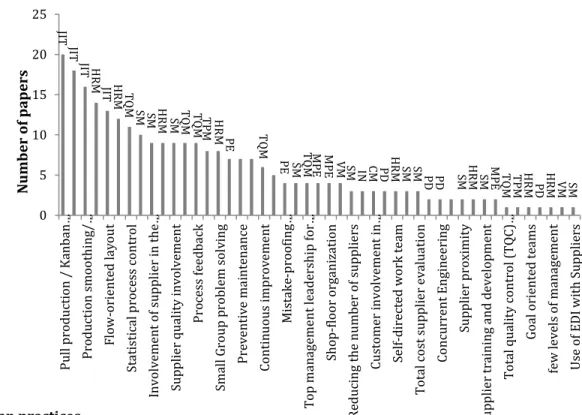
We could not use all these practices and bundles in our questionnaire since the length of the survey could have affected the likelihood of obtaining an incomplete questionnaire from the companies interviewed. In order to reduce such a likelihood, the present research focused only on the most important bundles and practices. Thus, a Pareto analyses was developed on lean bundles
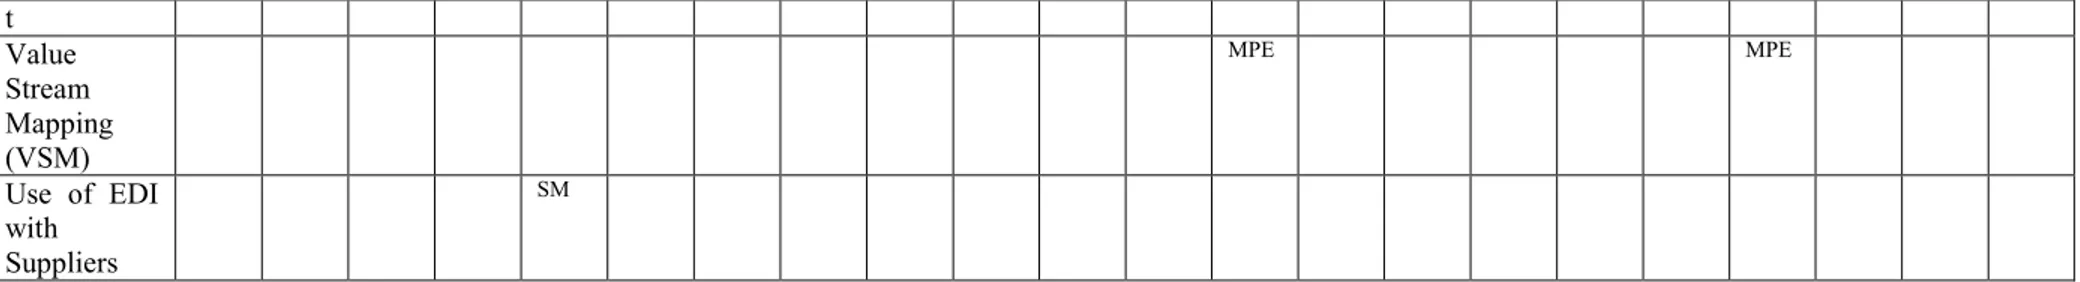
and practices (Figure 1; Figure 2). Results showed in Figure 1 highlight that four bundles are the most used: Just in Time (JIT), Total Quality Management (TQM), Supplier Management (SM) and Human Resource Management (HRM). These four bundles were used as latent variables in the construct model. Moreover, in Figure 2 all practices were linked to a specific bundle according to the frequency that bundle have been used for classifying that practice. For instance, the practice “Quick changeover techniques (SMED)” have been grouped as JIT bundle because eleven out of eighteen authors (62%) used this classification. No bundle has been assigned to the practices that had not a clear classification.
Practices 1 2 3 4 5 6 7 8 9 10 11 12 13 14 15 16 17 18 19 20 21 22
Quick changeover techniques (SMED)
JIT JIT JIT TBC PE JIT JIT JIT JIT MPE PE JIT JIT Setup Setup MPE JIT JIT
Pull
production / Kanban implementat ion
Flow JIT JIT TBC MPC JIT JIT JIT JIT JIT SFM MPC JIT JIT Pull Pull MPE JIT JIT JIT
Total production maintenance
JIT TPM MPE JIT TPM TPM Fitne
ss TPM
Production smoothing/ Heijunka/Mi xed model
JIT JIT MPP TPM JIT JIT SFM MPP JIT JIT UPL Pull MPE JIT JIT JIT
Mistake-proofing/Po ka-Yoke PE MPE PE TQM Total quality control (TQC) implementat ion TQM Standardize d operating procedures TPM Sharing information SM SM SM SM
with suppliers Involvement of supplier in the lean journey SM TBC SM TQM SM SM SM SM SM Reducing the number of suppliers SM SM SM Supplier partnership IN TQM SM TQM SM SM SM SM SM Fitne ss Lean Managemen t training JIT HRM TQM TPM HRM HRM HRM HRM HRM Create a multi-skilled Workforce/ Job Rotation IN HRM TQM TPM IN HRM HRM HRM HRM HRM FR HRM Fitne ss HRM Employers’ involvement (Suggestion schemes) IN TBC HRM IN HRM HRM HRM HRM HRM HRM Fitne ss HRM Goal oriented teams HRM Supplier quality involvement SM TQM SM TQM TQM SM SM SM TQM Customer involvement TQM CM TQM TQM TQM TQM CM CM TQM
in product offerings Top management leadership for quality IN TQM IN TQM Process feedback TQM CM IN TQM TQM TQM CM TQM TQM Flow-oriented layout
Flow JIT PE JIT JIT JIT JIT PE JIT JIT CL Flow JIT
Manufacturi ng-business strategy linkage IN IN SI Small Group problem solving JIT IN HRM HRM HRM FR Fitne ss CI Customer involvement in product design CM CM CM Statistical process control TQM TQM TQM TQM TQM TQM TQM TQM SPC TQM TQM Cycle time reduction PE MPE MPE CI Continuous improvemen TBC TQM TQM HRM MPE Fitne ss
t Shop-floor organization MPE CL HRM MPE Lot size reduction Flow MPP SFM SLP WIF New Product Developmen t: Design For-X PD Group technology (Cellular Manufacturing)
TBC PE JIT MPE PE CL Flow
Preventive maintenance JIT TBC PE JIT PE TPM TPM New Product Developmen t: Parts standardizati on PD PD New Product Developmen t: Variability reduction Flow PD PD Self-directed work team HRM HRM FR
Concurrent Engineering PD PD Work Time flexibility HRM FR few levels of management HRM Supplier involvement in design SM SM SM Supplier proximity SM SM Rewards and recognition HRM HRM Process mapping VM Total cost supplier evaluation SM SM SM Visual Information system MPC TQM VM VM Cleaness and organization /5S IN PE TPM TQM MPE VM Fitne ss Supplier training and developmen SM SM
Table 3 Lean practices classification
(1) Sakakibara et al. (1993); (2) Flynn et al. 1995; (3) Sakakibara et al. (1997); (4) Koufteros et al. (1998); (5) Panizzolo R. (1998); (6) Koufteros and Vonderembse (1998); (7) Dow et al. (1999); (8) McKone and Weiss (1999); (9) Cua et al. 2001; (10) Ahmad et al. (2003); (11) Shah and Ward (2003); (12) Swink et al. (2005); (13) Doolen and Hacker (2005); (14) Nordin et al. (2010); (15) Mackelprang and Nair (2010); (16) Furlan et al. (2011); (17) Nawanir et al. 2012; (18) Hofer et al. (2012); (19) Abdul Wahab et al. (2013); (20) Arnas et al. 2013; (21) Bortolotti et al. (2015a); (22) Netland et al. (2015)
Acronyms: JIT = Just In Time; TQM = Total Quality Management; HRM = Human Resource Management; TBC = Time Based Competition; TPM = Total Productive Maintenance; PE = Process & Equipment; MPE = Manufacturing Process & Equipment; MPC = Manufacturing Planning & Control; SFM = Shop Floor Management; UPL = Uniform Production Level; SM = Supplier Management; IN = Infrastructure; FR = Flexible resources; CM = Customer Management; CL = Cellular Layout; SI = Strategy Integration; CI = Continuous Improvement; SPC = Statistical Process Control; SLP= Small Lot Production; WIF = Work in Flow; PD = Product Design; VM = Visual Management t Value Stream Mapping (VSM) MPE MPE Use of EDI with Suppliers SM
Figure 1 Pareto analysis of lean bundles
Figure 2 Pareto analysis of lean practices 0% 5% 10% 15% 20% JIT TQ M SM HR M M PE PE IN TP M CM TBC PD Fitn es s M PC Fl ow VM FR SFM Pull CL Se tup CI WIF UPL CSP SLP SI % u til izat io n Bundles JIT JIT JIT HR M JIT HR M TQM SM SM HR M SM TQM TQM TPM HR M PE TQM PE SM TQM MPE MPE VM SM IN CM PD HR M SM SM PD PD SM HRM SM MPE TQM TPM HR M PD HR M VM SM 0 5 10 15 20 25 Pu ll prod uct io n / K anba n… Pro du ct io n sm oo th in g/ … Fl ow -ori ente d la you t St at ist ica l p ro ce ss con trol Inv olve m en t of s up pl ie r in th e… Su pp lie r qu al ity in vo lve m ent Pro ce ss fe ed ba ck Sm al l G rou p probl em s ol vin g Pre ve nt iv e m ai nt ena nce C on tin uous im prov em ent Mis ta ke -p roo fin g… T op m an age m ent le ad ers hip for… Sh op -f loo r orga ni za tio n R ed ucin g th e nu m be r of s up pl ie rs Cu st om er inv olve m en t in … Se lf-dire ct ed wor k te am T ot al cost s up pl ie r eva lu at io n Con cu rre nt Engin ee ri ng Su pp lie r proxim it y Su pp lie r tra in in g and d eve lop m ent T ot al qu al it y con trol (T QC)… Go al ori ent ed te am s fe w le ve ls of m ana ge m ent U se of ED I w it h Su pp lie rs N u mber of p ap er s Lean practices
2.1.3 A model of lean practices responsiveness: Theoretical
foundation
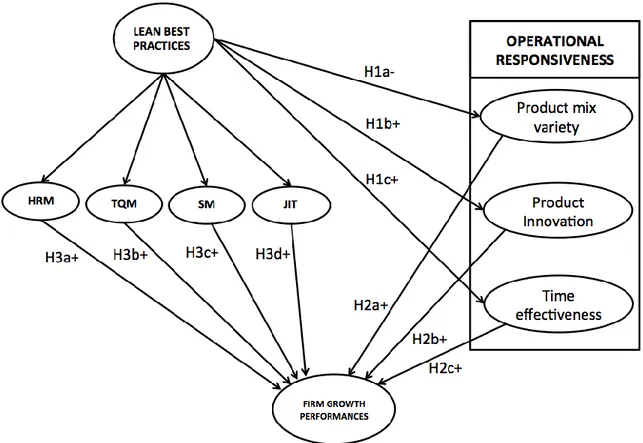
Having reviewed the most relevant literature on LM and operational responsiveness, a research model was then developed with the aim to investigate the possible relationships between the following factors: 1) Lean Practices and bundle of lean practices, 2) Product Mix variety, 3) Product Innovation, 4) Time Effectiveness and 5) company growth performance.
In literature, there are many studies demonstrating that LM implementation has a positive influence on company performance (Bortolotti et al., 2015a, 2015b; Evangelos Psomas et al., 2014; Shah and Ward, 2003). Lean practices can be evaluated as noteworthy, based on the significant returns they generate via operational effectiveness and cost savings (Mackelprang and Nair, 2010). Cost efficiency and time effectiveness are the primary performance outcome associated with leanness (Narasimhan et al., 2006; Rachel Mason‐ Jones et al., 2000; Shah and Ward, 2003; Towill and Christopher, 2002). Indeed, according to Womack et al. (1990), most lean programs focus on reducing waste and non-value adding activities, emphasizing performance improvements in the areas of cost efficiency, conforming quality and productivity, and reducing inventory and throughput time. Instead, the operational responsiveness emphasizes the capacity to respond to a wide ranges of quantities demanded, to meet short lead time, to handle a large variety of products, to build highly innovative products and to meet a very high service level (Chopra and Meindl, 2004 ).
Considering the ever-changing dynamics, competition on a global scale (Simchi-Levi et al., 2012) and the increasing interests of companies in lean practices, it is essential to analyse the relationship between lean best practices implementation and the operational responsiveness. Indeed, the study of Qrunfleh and Tarafdar (2013) analyses the relation of lean and agile supply strategies and the supply chain responsiveness in USA manufacturing firms. The results of this analysis demonstrate that a company that focuses only on waste elimination without considering the deployment of appropriate resources would not achieve benefits in terms of responsiveness (Sufian Qrunfleh and Monideepa Tarafdar, 2013). In that case the supply chain responsiveness has been considered through a unique variable.
In a context of increasing volatility, global competitiveness and sales crisis, it would be essential to define the reason of the discordance between the techniques focus on waste reduction and the operational responsiveness requested by the market.
Hence, through the Italian sample the aim of this thesis is to analyse the reason of this failure relation. The goal is reached splitting the variable responsiveness, as illustrated in section 2.1, into 3 factors (Product Mix variety, Innovation, Time Effectiveness).
Leanness requires elimination of all forms of waste, including time, and allows enhancing manufacturing and management productivity (Narasimhan et al., 2006; Shah and Ward, 2003). Indeed a time-compression strategy allows companies to effectively compete on waste elimination reducing manufacturing
time and inventory (Narasimhan et al., 2006; Ugarte et al., 2016). In consequence, a reduction of the mean time to stock and response time to customer and, a growth in the Inventory turnover is obtained.
Moreover lean practices are useful even for providing support to solve some innovative problems in the business process (such as new product development), in order to fulfill customer expectations (Camacho-Miñano et al., 2013; Johnstone et al., 2011; Yang et al., 2011a). Indeed waste in innovation and in new product development processes can be detected and reduced in the same way as waste in manufacturing, creating enormous potential savings. Reinertsen and Shaeffer (2005) highlight how low-cost, rapid cycles of learning achieved through lean improvements can directly reduce risk aversion and enhance innovation because the cost and consequences of a negative outcome are reduced. Byrne et al. (2007) examined the innovation performance of several firms that had adopted a lean strategy and come across that the most successful companies were those that had deliberately extended lean principles into their innovation agenda and had used it to enable breakthrough innovations and, importantly, change the culture towards one that supported continual innovation.
But if time effectiveness and innovation are commonly associated with lean (Narasimhan et al., 2006; Rachel Mason‐ Jones et al., 2000; Shah and Ward, 2003; Towill and Christopher, 2002) we considered the product mix variety as a possible critical factor in the research model.
Indeed, Just-In-Time practices were firstly developed in Toyota in a high repetitive production system, and for years researchers considered this methodology applicable only in contexts with repetitive manufacturing systems. Moreover in literature the majority of successful lean application came from repetitive contexts, where products are standardized and customer demand is stable and predictable (Jay Jina et al., 1997; Lander and Liker, 2007). Indeed non-repetitive contexts, with demand fluctuations, dynamic takt time and a high product variety inhibit production smoothing and make lean implementation critical (Andreas Reichhart and Matthias Holweg, 2007; Lander and Liker, 2007).
But some authors have denied this view, providing descriptive and anecdotal case studies where Lean practices have been implemented successfully also in non-repetitive contexts (Crute et al., 2003; Lander and Liker, 2007; White and Prybutok, 2001).
Prybutok and White (2001), demonstrated that JIT is applicable in repetitive and non-repetitive companies, even if some techniques are less frequently applied in non-repetitive manufacturing systems, and that performance improvements are more evident in a repetitive environment.
Crute et al. (2003) describe an example of Lean application in the aerospace sector, characterized by low volumes and Make to Order production systems. The authors affirmed that low volumes facilitate the implementation of Lean practices because the production system is naturally closer to the concept of one piece flow, and Make to Order systems follow a pull logic.
But, more recently, Bortolotti et al. (2013) identified a gap in literature, where there is the lack of studies based on a large sample, which analyse Just-In-Time impact on performance at varying degrees of repetitiveness. Data from a sample of 244 plants, analysed using a structural equation modelling (SEM) procedure, demonstrated that demand variability reduces (negatively moderates) the positive effect of Just-In-Time on operational responsiveness.
Therefore, we assume that lean practices implementation has a positive relationship with Innovation and Time effectiveness, but a negative relationship with product mix variety. Hence hypothesis H1a, H1b and H1c have been developed:
H1a: Lean practices implementation has a negative impact on product mix variety.
H1b: Lean practices implementation has a positive impact on product innovation.
H1c: Lean practices implementation has a positive impact on time effectiveness.
Markets today are increasingly volatile and therefore are less predictable. Many authors sustain that to be competitive and successful organisations need to be agile in response to market demand (Kisperska-Moron and de Haan, 2011). A lot of previous research exposed significant evidence related to lean practices and companies performance (Bortolotti et al., 2015a; Evangelos Psomas et al., 2014; Narasimhan et al., 2006; Shah and Ward, 2003). Indeed, the application of LM practices increases the manufacturing productivity by reducing setup
times and work in process inventory improving throughput times, and thus improving market performance (sales and market share variation in the last 3 years) (Tu et al., 2006).
The use of bundles of manufacturing practices (e.g. JIT or TQM) in the manufacturing strategy framework represents both decisions and actions and many empirical articles investigate relationships involving different practices. Konecny and Thun (2011) find that while the adoption of TQM and TPM bundles individually improves plant performance, their conjoint implementation does not provide additional performance benefits. Furlan et al. (2011) detect synergy between JIT and TQM bundles for firms that also implement human resources related lean practices. Bortolotti et al. (2015b) argued that TQM lean practices is indirectly related to cost performance because there is less of a need for inventories to protect the production system against external variance (Khim Ling Sim and Anthony P. Curatola, 1999) and less invested in scrap and rework.
Moreover, involving supplier management lean practices in company strategy improves raw material quality conformance, thus reducing the time dedicated to quality inspections (Romano, 2002) and rework.
LM positively influences even the firm’s financial performance (returns on sales and returns on investments) through improving organizational processes, cost efficiencies (Christopher and Towill, 2000; Fullerton et al., 2003; Rosemary R. Fullerton and William F. Wempe, 2009) and labour and asset productivity (Kinney and Wempe, 2002).
margins increasing customer responsiveness, reducing customer lead time, improving customer value in terms of lower prices and quality products and innovating problem solving in business processes (e.g., new product development, order fulfilment, customer services) (Camacho-Miñano et al., 2013; Shah and Ward, 2003; Yang et al., 2011a; Zhou, 2012).
Thus, having described the firm growth performances through the Employee growth variation in the last 2 years, the Sales growth variation in the last 2 years and the Customer Retention in the last 2 years, we hypothesize a positive relationship between the four impact areas of lean best practices and the company’s growth performance.
H2a: HRM Lean practices positively influence the company’s growth performance.
H2b: TQM Lean practices positively influence the company’s growth performance.
H2c: SM Lean practices positively influence the company’s growth performance.
H2d: JIT Lean practices positively influence the company’s growth performance.
Company performance refers to how well a company achieves its market-oriented and financial goals (Li et al., 2005; Sufian Qrunfleh and Monideepa Tarafdar, 2013; Yamin et al., 1999). Wu et al. (2006) argue that higher levels of capabilities (responsiveness, information exchange, coordination and interfirm activity integration) can potentially improve a firm’s market and financial performance. Furthermore, Birkinshaw et al. (2008) advocate how
“management innovation” can improve the future productivity unlike product or process innovation. Indeed, investing in R&D processes to create knowledge and generate innovation is particularly relevant for firms competing in today’s context of ever-changing dynamics and competition on a global scale (Lewellyn and Bao, 2015).
Moreover, in a study of Inman et al. (2011) they demonstrated how agile manufacturing positively influences the financial performance of a firm. Indeed, using an agile manufacturing business becomes more flexible in terms of product models and configurations by quickly responding to change in customers and the capacity to get new products to market quickly. As sustained by Goodman et al. (1995) and Choi and Krause (2006) responsiveness is an advanced level of flexibility to meet customer and market requirements. Liao et al. (2010) through a structural equation modelling suggest that the higher the flexibility of the firm, the better it is at enabling the focal firm to adapt to changes in the market.
So, in light of the previous consideration we linked responsiveness factors to company growth performance and, in particular, we assume that Product
Innovation, Time effectiveness and product mix variety have a positive effect
respectively on company growth performance. Hence hypothesis 3a, 3b and 3c have been developed:
H3a: The company growth performance is positively influenced by the Product mix variety latent variable.
innovation latent variable.
H3c: The company growth performance is positively influenced by the Time effectiveness latent variable.
The hypothesized research model is shown in Figure 3.
Figure 3 Research model linking lean best practices, operational responsiveness and firm growth performances.
2.2 Lean difficulties review
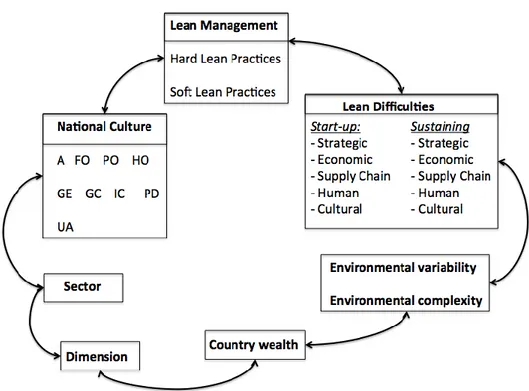
Literate lacks of a synthetic and efficient classification of Lean barriers. Indeed the limited number of articles that face the Lean barriers topic do not classified them in an efficient way. Recently Albliwi et al. (2014) analysed 34 common failure factors for Lean Six Sigma implementation. Bhasin (2012) classified 15 categories of lean difficulties in UK companies like so Jadhav et al. (2014) that identified 24 groups of barriers. Hence, due to the multi-disciplinary aspect that LM involves, barriers in literature have been traced back to 4 categories: Strategic, Economic, Supply Chain integration, Human and Cultural Barriers. To that end, a systematic literature search was conducted according to the steps explained in table 1. Keywords such as: “Lean Difficulties”, “Lean barriers”, “Lean Manufacturing obstacles”, “Just in Time barriers”, “Just in Time difficulties”, “Just in Time obstacles”, “Lean management”, “Lean start-up/ sustaining phase”, “Strategic barriers/ difficulties/ obstacles”, “Economic barriers/ difficulties/ obstacles”, “Supply Chain integration barriers/ difficulties/ obstacles”, “Human barriers/ difficulties/ obstacles”, “Cultural barriers/ difficulties/ obstacles” and “national culture barriers/ difficulties/ obstacles” were used for the step 2 of the structured literature review. At the end of step 4, 40 papers were defined as relevant for this literature review study.
The analysis of these articles allowed us to define for each barrier (strategic, economic, supply chain integration, human and cultural) the factors to take into account. Moreover, we’ll consider lean barriers in the first phase of the LM journey and on the sustaining phase.
2.2.1 Strategic Barriers
The development of a detailed strategic planning is a critical issue for LM. It's unthinkable to implement and sustain big changes without a strategic planning (Jadhav et al., 2014). In the study of Albliwi et al.(2014), a weak link between the continuous improvement projects and the strategic objectives of the organization has been allocated as the fourth critical failure factor. Indeed, an effective roadmap, to start a lean project and to guide its implementation in the successive steps, is fundamental (Bhasin, 2012b; Kwak and Anbari, 2006; Saja Albliwi et al., 2014). In the preparation phase of a lean project, department, division, and processes should be selected and the goals of the project formulated (Pedersen and Huniche, 2011). Lack of awareness about the benefits and the need of lean projects leads managers to set unclear goals and strategic plans for the new improvements (Anand and Kodali, 2009; Saja Albliwi et al., 2014).
Another strategic barrier that may lead to lean failure is the possible incompatibility of lean with the organizational bonus, rewards or incentive system (Upadhye et al., 2010). Poor incentive and rewards systems fail to motivate employees to implement and sustain lean (Jadhav et al., 2014; Upadhye et al., 2010).
Moreover, some authors (Karim and Arif‐Uz‐Zaman, 2013; Saja Albliwi et al., 2014) observed that many firms have failed to obtain any benefits from Lean implementation due to the unclear managers’ understanding of Lean performance and how to measure the performances.
2.2.2 Economic Barriers
Cost and time required for LM programs could be another reason for the low level of LM implementation (Jadhav et al., 2014). A survey conducted by Pinto et al. (2008) in 1,000 large Brazilian organizations showed that the most common reason for quality improvement programs’ failure is a shortage of financial resources, especially for the large investment needed for white-collared and blue-white-collared workers’ training. If there are economic problems in large organizations, these are even more evident in SME (Achanga et al., 2006). Indeed, financial, technical, and human resources are required for an effective and successful LM implementation (Jagdish R. Jadhav, Shankar S. Mantha, and Santosh B. Rane 2014; Eswaramoorthi et al. 2010; Alessandro Laureani and Jiju Antony 2012).
A study made by Chakrabarty and Chuan (2009) in service organizations explains that companies are frequently forced to hire part-time employees due to lack of resources, which makes sustainability of improvement programs much more difficult to achieve. Indeed, it is widely recognized that if starting a lean project requires a considerable financial effort, the sustaining phase is even more critical (Eswaramoorthi et al., 2010; Jadhav et al., 2014; Sabri and Shaikh, 2010; Saja Albliwi et al., 2014).
Moreover, companies often find that lean changes are so significant that it’s necessary to hire outside experts to successfully shift to lean (Jadhav et al., 2014; Tracey and Jamie, 2006). A lean sensei helps managers in the first phase to develop their own lean thinking through practical hands-on exercises on the
shop floor and to monitor the correct lean shifting in the successive phases (Jones, 2014; Womack et al., 1990).
In addition, another financial effort that firms should face in the LM program is the improvement of facility layout and the modernization of plants and equipment. Preventing the executive managers from modifying plant configuration and investing in new necessary machinery will bring about many deteriorating effects, such as high material handling costs, excessive work-in-process inventories and low or unbalanced equipment utilization (Helena Boarin Pinto et al., 2008; Jadhav et al., 2014; Wong and Kuan, 2011).
2.2.3 Supply Chain integration Barriers
Supplier chain integration also plays a vital role in supporting LM (Bortolotti et al., 2016; Chavez et al., 2015; Shah and Ward, 2007a). It is important to establish clear and effective channels for communication upstream (suppliers) and downstream (customers) (Bhasin, 2012b; Chavez et al., 2015; Jiju Antony et al., 2007; Saja Albliwi et al., 2014; Scherrer-Rathje et al., 2009; Worley and Doolen, 2006). Poor information flow with stakeholders is one out of ten reasons for poor lean sustainability identified by Hines et al. (2011). Even the firms’ structure can contribute to creating barriers in communication, as supplier management department may have no or little interaction with the rest of the organization (Cudney and Elrod, 2010; Jadhav et al., 2014). A cooperation between suppliers and manufactures allows companies to reduce inventory level, improve lead time reliability, scheduling flexibility, quality and customer satisfaction (Jadhav et al., 2014; Shah and Ward, 2007a).
Some other factors should be included in the supply chain integration barriers. The distance between the facility and the supplier may impact the level of inventories (Harris et al., 2010). New suppliers and short-standing relationships may be another barrier in implementing and sustaining LM (Comm and Mathaisel, 2000). In the sustaining phase of a lean project, providing material on-time-in-full delivery in the right place and at the right price plays a vital role (Harris et al., 2010; Jadhav et al., 2014; Shah and Ward, 2007a).
Moreover, in order to ensure efficient delivery and pick-ups in the start-up and sustaining phase of a lean project, partnership or closer relations with carriers
2.2.4 Human Barriers
LM is not just about tools and technique, but it is above all about people (Bhasin, 2012b; Jadhav et al., 2014; Wincel, 2013) and changing the workers’ mind-set. Indeed, the Lean Enterprise Institute web surveys (Wroblewski, 2007) stated that backsliding to the old ways of working was the most important factor contributing to the lean failures. Resistance to change is a natural tendency of human beings, and very few people dare to come out of their comfort zone (Eswaramoorthi et al., 2010; Jadhav et al., 2014).
A study made by Sohal and Egglestone (1994) shows that human resistance arises at every company level, including senior managers, middle managers and shop floor personnel. However, in order to successfully start a lean project and to avoid its failure in the successive steps, managers should support the Lean teams (Jadhav et al., 2014; Saja Albliwi et al., 2014). Managers should also be perseverant in supporting changes, contrasting the natural propensity to revert to original practices (Wong and Kuan, 2011). Scherrer-Rathje et al. (2009), by describing in detail two lean implementation projects, stress the importance of management commitment and highlight the necessity of starting project top-down. Indeed, if it is initiated bottom-up, it needs too many resources to achieve goals, and the goals will not be noticed. The lack of senior management commitment and interest in lean also means that employees who take part in the lean changes are not motivated and consider this project as only one out of many projects going on at the same time (Scherrer-Rathje et al., 2009). Moreover, employees’ reluctance to LM projects might depend on fear