D
EPARTMENTB
IOSCIENCES ANDT
ERRITORYP
HD
L
EVELC
OURSEI
NB
IOLOGICALS
CIENCES,
B
IOMEDICAL,
E
NVIRONMENT ANDT
ERRITORY,
C
URRICULUMC
OMPUTER-E
NGINEERING,
C
YCLEXXIX
A novel approach based on the Push Down Automata (PAD) for
the Automated Detection and a Classification of Waveforms in
EEG, especially for Spike and Wave Discharges (SWD)
Coordinator:
Chiar.ma Prof.ssa Stefania Scippa Supervisor:
Chiar.mo Prof. Giovanni Capobianco Co-Supervisor:
Chiar.mo Prof. Richard Ngomba
Candidate: Daniel Durand
PhD level course – Daniel Durand Academic Year 2015/2016 2 Contents 1 Figure Index: ... 4 2 Table Index ... 6 3 Abstract ... 7 4 Introduction ... 8 4.1 EEG ... 8 4.2 Epilepsy ... 11 4.3 Methods ... 13
4.3.1 Fourier- and Wavelet transform ... 13
4.3.2 Multi-layer Perceptron (MLP) ... 17
4.3.3 Non- Deterministic and Deterministic finite automaton (NFA, DFA).. 20
4.3.4 Basic operation and limitation ... 22
4.4 Pushdown Automata (PDA) ... 23
4.5 The advantage ... 26
4.6 The aim of this thesis: ... 27
5 Automated Epileptic Spike and Wave Detection ... 28
6 Methods ... 30
6.1 Critical issues ... 30
6.2 Lexical analysis (scanner) ... 32
6.3 Token ... 34
6.4 Syntax analysis (Parser) ... 35
PhD level course – Daniel Durand Academic Year 2015/2016 3
6.5.1 Definition ... 36
6.5.2 Grammar file definition ... 37
6.5.3 Grammar file example ... 37
6.6 Abstract Syntax Tree (AST) ... 38
6.7 Semantic analysis ... 39
6.8 Code generation ... 40
7 Materials ... 42
7.1 EEG data ... 42
7.2 Software development ... 43
8 System performance evaluation ... 45
9 Results ... 47 10 Discussion ... 52 11 Conclusion ... 53 12 Future Works ... 54 13 Acknowledgements ... 55 14 Appendice ... 56 14.1 Abbreviation ... 56 14.2 Grammar (WFD 160711) ... 59 15 References ... 62
PhD level course – Daniel Durand Academic Year 2015/2016 4
1 Figure Index:
Figure 1: Graphical representation of time-frequency resolution. For the same area of the individual rectangles, this corresponds graphically to the cube-dusting indeterminacy relation, the left diagram has a higher time resolution, the right
diagram shows a better frequency resolution ... 15
Figure 2: Graphic representation of STFT vs. WT ... 17
Figure 3: A sample artificial neuron ... 18
Figure 4: The general MLP structure with tree layers ... 19
Figure 5: Graphical representation of a DEA example ... 21
Figure 6: Sample Transition Table for Spike detection ... 22
Figure 7: A diagram of a pushdown automaton ... 26
Figure 8: A Block diagram showing compiler phases. ... 30
Figure 9: The system-detected event, validated by an expert (TP) ... 31
Figure 10: The system-detected event, disputed by an expert (FP) ... 32
Figure 11: The system-detected non-event, disputed by an expert (FN) ... 32
Figure 12: An example of a Difference of Gaussians ... 33
Figure 13: An example of tokening from prototype software with DoG in red and normalised EEG data represented in blue ... 34
Figure 14: A diagram elaborating the process of parsing ... 36
Figure 15: The hierarchy of an abstract syntax tree (AST) ... 39
Figure 16: An example of abstract syntax tree formation from prototype software 39 Figure 17: Prototype general user interface ... 44
Figure 18: Abstract Syntax Tree (AST) graphic illustration ... 44
PhD level course – Daniel Durand Academic Year 2015/2016 5
Figure 20: Ethosuximide ... 51 Figure 21: (Fig. 4G) The preferential mGlu2/3 receptor antagonist, LY341495, reduce the frequency of spike-waves discharges in the WAG/Rij rat model of absence epilepsy ... 51
PhD level course – Daniel Durand Academic Year 2015/2016 6
2 Table Index
Table 1: SWD count ... 47 Table 2: SWD second ... 47 Table 3: Overlap second ... 48
PhD level course – Daniel Durand Academic Year 2015/2016 7
3 Abstract
A particularly important technique used in medicine is the electroencephalogram (EEG) signal. EEG technique was described by Hans Berger, in 1929, as a "window into the brain" [1]. EEGs are a recording of electrical activity from the mammalian scalp, a fundamental tool in the diagnosis and research of several brain disorders, including those related to epilepsy [2].
However, the analysis of the hours of data generated from EEGs, used to identify events such as epilepsy, sleep etc, is a time-consuming process, as it has to be performed manually by experts. Therefore, to address this issue, several methods of automatic detection have been developed: mimetic, morphologist, template matching, parametric modelling and non-linear features [3].
In an attempt to further streamline this procedure, a new approach was developed- viewing EEG output as a language, treated as a high level computer source code, and by using a compiler to transform the output into a sequence of symbols, the generated wave’s properties could be interpreted by a grammar file to form an abstract syntax tree. Allowing the specific automated identification of event sub-types and enabling the analysis of the contents of an event.
PhD level course – Daniel Durand Academic Year 2015/2016 8
4 Introduction
Within this larger research field, one significant section deals with EEG imaging. Ideally large quantities of EEG signals are recorded and then instantly processed. In our case it concerns data from the Thalamo-cortical network, in order to better understand the action of therapeutics, which are of crucial importance for the treatment of: brain tumours, migraine, ischemia and epilepsy, with the analysis of epileptic EEG data being the main focus for this project.
There has emerged two distinct points for improvement of EEG analysis: firstly, the evaluation of data is done manually, and secondly only the Spike and Wave discharges with clear start and end times are evaluated, whereby the description of the event’s composition is not made, certainly because that would be very strenuous when performed manually.
4.1 EEG
German physiologist and psychiatrist Hans Berger (1873–1941) recorded the first human EEG in 1924. Expanding on work previously conducted on animals by Richard Caton and others, Berger also invented the electroencephalogram (giving the device its name), an invention described "as one of the most surprising, remarkable, and momentous developments in the history of clinical neurology" [46]. His discoveries were first confirmed by British scientists Edgar Douglas Adrian and B. H. C. Matthews in 1934 and further developed by them.
The electrical activity of the brain can be recorded by EEG. The frequency of the rhythmic electrical waves recorded varies from 0.5 Hz to 70 Hz and their amplitude varies from 5 µV to 400 µV, depending on the electrical activity occurring in the
PhD level course – Daniel Durand Academic Year 2015/2016 9
brain. As the activity increases, the EEG frequency gets higher and amplitude gets lower, since the synchrony of neurons is disturbed. As sleep deepens, the synchrony of the neurons gets higher, resulting in a high voltage, low frequency EEG. No cerebral activity can be detected from a patient with complete cerebral death.
The EEG data measured from a recording site directly corresponds to the summation of the activity of different parts of the brain. Since electrodes are secured to the scalp, the activity from deeper nuclear groups, such as the thalamus, cannot be detected. Due partly to the distance from the recording electrode, and partly to the architecture of the thalamic groups that gives rise to closed potential fields [45]. Additionally, it is thought that the action potential time course is too short and the amount of polarized membrane is too small to generate a scalp EEG potential, even for neurons that are close to the skull. Hence EEGs are dominated by the activity of chemical transmitters released at synapses, which cause localized depolarization known as excitatory postsynaptic potential (EPSP) or hyperpolarization referred to as inhibitory postsynaptic potential (IPSP). Postsynaptic potentials (PSP) of the cortical pyramidal neurons are of longer duration and involve more membrane space.
Since the skull is not a good conductor, the instrument used for recording EEGs should have a high amplification gain- the input impedance of this device should also be high. During the recording, the noise due to both the environment and the body should be eliminated. Both analogue and digital EEG devices are commercially available: the resolution of the analogue device output is determined
PhD level course – Daniel Durand Academic Year 2015/2016 10
by the recording paper speed, which is generally 30 mm/sec; the sampling rate of digital devices varies between 150 to 2 kHz.
Routine clinical EEG recording including preparation time, typically takes 20-30 minutes and usually requires recording via scalp electrodes. Routine EEG is typically used in the following clinical circumstances [47]:
to distinguish epileptic seizures from other disease states, such as: psychogenic non-epileptic seizures, syncope (fainting), sub-cortical movement disorders, and migraine variants;
to differentiate "organic" encephalopathy or delirium from primary psychiatric syndromes, such as catatonia;
to prognosticate, in certain instances, in patients with coma; to determine whether to wean anti-epileptic medications; to serve as an adjunct test of brain death.
The study of EEGs and of related Event-related potentials (ERPs) are used extensively in neuroscience, cognitive science, cognitive psychology, neurolinguistics and psychophysiological research [48]. Currently EEG techniques used in research are not adequately standardised for use within the clinic. But in the research of many mental disabilities, such as Auditory Processing Disorder (APD), Attention Deficit Disorder (ADD), or Attention Deficit Hyperactivity Disorder (ADHD), which are becoming more widely understood, EEGs are often used in their research and treatment.
PhD level course – Daniel Durand Academic Year 2015/2016 11
4.2 Epilepsy
Epilepsy characterized by distinctive epileptic seizures; the average probability that a person is afflicted by epilepsy is 1%, in developing countries this average increases. An epileptic seizure is a form of neurological disorder caused by hypersynchronous neuronal electrical activity, creating a temporary disturbance of the brain activity [4]. A practical clinical definition of epilepsy was recently published by The International League Against Epilepsy (ILAE, 14 APR 2014): "Epilepsy is a disease of the brain defined by any of the following conditions: 1) at least two unprovoked (or reflex) seizures occurring >24 h apart; 2) one unprovoked (or reflex) seizure and a probability of further seizures similar to the general recurrence risk (at least 60%) after two unprovoked seizures, occurring over the next 10 years; 3) diagnosis of an epilepsy syndrome [5].".
Characteristic to epileptic symptoms, spikes, are epileptiform discharges events, and consist primarily of a sudden, abnormally high amplitude and a sharp peak. The International Federation of Societies for Electroencephalography and Clinical Neurophysiology (IFSECN) defines them as: "Epileptiform patterns (epileptiform discharge or activity): transients distinguishable from background activity, with a characteristic spiky morphology, typically, but neither exclusively nor invariably, found in interictal EEGs of people with epilepsy [6].".
The diagnosis of epilepsy, in clinical practice, is based on clinical history and physical examination, and it is important to obtain a comprehensive review of the seizure’s semiology. Ictal symptoms, i.e. Symptoms during the seizures are determined by the localization of seizure foci. It is important to evaluate differential
PhD level course – Daniel Durand Academic Year 2015/2016 12
diagnoses such as syncope, arrhythmia, and non-epileptic seizures, since a false diagnosis of epilepsy often occurs. Interictal electroencephalogram (EEG) can give information about the diagnosis of epilepsy.
In humans, typical absences (TAS) are accompanied by a very characteristic pattern of brain activity, so-called spike and wave discharges (SWDs), which can be recorded in the EEG of the patients [44]. During these typical absence incidents, the EEG shows generalized, regular and synchronous SWDs with a frequency of 3 Hz. They usually begin with a slightly higher frequency of 4-5 Hz and gradually decrease to a frequency of 2.5 Hz at the end of the SWDs. The clinical phenotype is the marked change in consciousness, and it can be linked by automatisms when the episode has a suitable length.
Animal models are necessary to investigate and understand basic principles of various diseases. Beyond the necessity of their use, epilepsy models used must be proven valid; this means that various conditions must be met. The model must reflect some of neuropathological changes that occur in the human condition, the seizure model must correctly predict the response of standard drug and experimental treatments and the overt behavior of the animal must mirror those seen in humans with the disease.
Two rat models are leading in the literature: Genetic absence Epilepsy rats from Strasbourg (GAERS) and Wistar Albino Glaxo rats from Rijswijk, both show SWDs in the 7 to 11 Hz frequency range. Both the GAERS and the WAG / Rij rodents meet the criteria that are considered to be valid models of absence epilepsy: the behaviour of the epileptic animal is similar to that of epileptic humans, the
PhD level course – Daniel Durand Academic Year 2015/2016 13
neuropathology is similar, and the response to the first antiepileptic medication is similar. In fact, both types of rats show behavioural disorder and impaired consciousness during the synchronous and bilateral EEG events, the SWDs. The EEG waveforms of the SWDs are strikingly similar to the ictal waveform in human patients, although the frequency of oscillations in rodents is higher than in patients (7-11 Hz in rodents, versus 3 Hz in humans).
4.3 Methods
Visual inspection by an expert of the long EEG signals is a very time intensive process, a possible solution to this is the automatic identification of spikes. However, the identification of Spikes is a complex activity and requires a specific background experience [15][16].
As a result of recent technological advances, in particular computational speed and advances within the field of computer science, there is an increased interest regarding the automation of processes such as SWD analysis.
Methods that are commonly used for spike detection are: mimetic, morphologists, template match, parametric modelling and non-linear features [3][7][9][32].
4.3.1 Fourier- and Wavelet transform
The Fourier transform is a Fourier analysis method that allows continuous, aperiodic signals to be split into a continuous spectrum of frequency. The function that describes this spectrum is called a Fourier transform or spectral function. This integral transformation is named after the mathematician Jean Baptiste Joseph Fourier in 1822 investigated Fourier series in his Théorie analytique de la chaleur.
PhD level course – Daniel Durand Academic Year 2015/2016 14
The Fourier transform has important applications, especially in engineering sciences such as signal processing and physics. Special terms and nomenclatures are also used:
Time domain
If the analysis or representation is performed as a function of time, one speaks of the time domain. If the variable describes a position in space (i.e. in digital image processing), it is also referred to as the local area;
Time signal
A time signal is understood to be the description of the signal sequence as a function of time;
Frequency domain
After the transformation (i.e. Fourier or Laplace transformation) the area image is referred to a frequency domain.
The Discrete Fourier Transform (DFT) is a transformation from the area of Fourier analysis (1). It forms a time-discrete, finite signal, which is periodically continued, on a discrete, periodic frequency spectrum, which is also referred to as an image region. The DFT is of great importance in the digital signal processing for signal analysis. Optimized variants in the form of the Fast Fourier Transform (FFT) and their inverse are used here.
(1)
The short-time Fourier transform (STFT) is a Fourier analysis method to represent the temporal change in the frequency spectrum of a signal. While the Fourier
PhD level course – Daniel Durand Academic Year 2015/2016 15
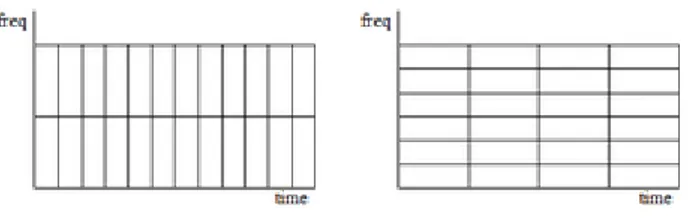
transform does not provide information on the temporal variation of the spectrum, the STFT is also suitable for non-stationary signals whose frequency characteristics change over time (Figure 1). STFT is used, among other things, in measuring instruments such as the spectrum analyzers.
Figure 1: Graphical representation of time-frequency resolution. For the same area of the individual rectangles, this corresponds graphically to the cube-dusting indeterminacy relation, the left diagram has a higher time resolution, the right diagram shows a better frequency resolution
Simply, in the continuous-time case, the function to be transformed is multiplied by a which is non-zero for only a short period of time. The (a one-dimensional function) of the resulting signal is taken as the window and moved along the time axis, resulting in a two-dimensional representation of the signal (2). Mathematically, this is written as:
(2)
where (t) is the window function, commonly a Hann window or Gaussian window centred around zero, and x(t) is the signal to be transformed.
The Wavelet Transformation (WT) is a specific family of linear time-frequency transformations in mathematics and engineering (primary: communications, computer science). The WT is composed of the wavelet analysis, which describes the transition of the time representation into the spectral or wavelet representation,
PhD level course – Daniel Durand Academic Year 2015/2016 16
and the wavelet synthesis, which describes the backtransformation of the wavelet transformed into the time representation (3). In contrast to the sine and cosine functions of the Fourier transformation, the most commonly used wavelets have not only locality in the frequency spectrum, but also in the time domain. In this context, "locality" is to be understood as meaning “small dispersion”. The probability density is the normalized magnitude squared of the function under consideration or its Fourier transforms.
As with the STFT, a window function is applied to the signal to be examined. Instead of moving and modifying the window (as in the case of the STFT), the window is moved and scaled. The scaling also results in a frequency shift as by the modulation, but the duration ("width" in the time domain) of the window is reduced simultaneously with a frequency increase. This results in a better temporal resolution at higher frequencies. At low frequencies, the frequency resolution is improved, but the time resolution becomes worse.
The continuous wavelet transform (CWT) is given by:
(3) Thereby is
(t): the function to be transformed, for example an audio or image signal; : Wavelet function (mother wavelet) which can be selected differently
depending on the application;
b: translation parameter, for scanning the data x (t) in the temporal or spatial dimension;
PhD level course – Daniel Durand Academic Year 2015/2016 17
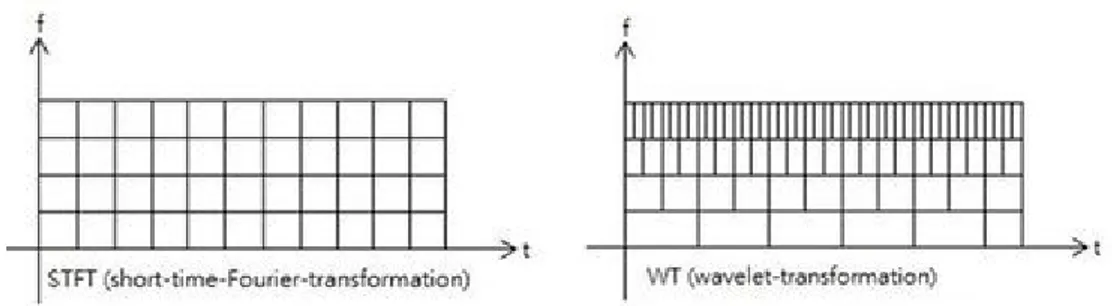
a: Scaling parameter, which scans the data over different frequency ranges. The transformed signal provides information about the time and the frequency. Therefore, wavelet-transformation contains information similar to the STFT, but with additional special properties, which show up at the resolution in time at higher analysis frequencies of the basis function. The difference in time resolution at ascending frequencies for the Fourier transform and the wavelet transformation (WT) is shown below Figure 2.
Figure 2: Graphic representation of STFT vs. WT
All functions, like DFT, FFT, STFT and WT, use a window function- for DFT, FFT, and STFT, the window width is constant. WT has a maximum constant window width, and in this area there is a dynamic temporal resolution.
4.3.2 Multi-layer Perceptron (MLP)
A typical representation of a non-linear detection system is a Multi-layer Perceptron (MLP). In biological neurons, the signal is transmitted from one neuron to another through the synapses via transmitter substances. Which are released increasing or decreasing the electrical potential of the receiving neuron, this
PhD level course – Daniel Durand Academic Year 2015/2016 18
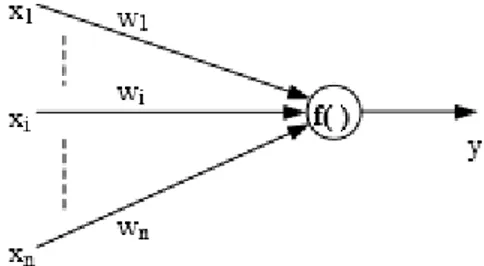
process is known as excitation or inhibition respectively. The inhibition and excitation of synapses can be enhanced by the activities of the neurons. If the potential of the neuron reaches a threshold value, the neuron fires. This plasticity of the synapses is believed to be the neuronal mechanism of learning and memory functions of the brain. The artificial neuron is inspired from the biological neuron. A typical processing element (PE) is depicted in Figure 3.
Figure 3: A sample artificial neuron
An artificial neural network (ANN) is an adaptive, most often non-linear system, that learns to map, from the data, the input to output. Different ANN architectures are formed using the PEs with different connection topologies. Besides the architecture, the learning algorithm is also an important feature distinguishing different kinds of networks. Learning is a process by which the free parameters (i.e., synaptic weights and bias levels) of a neural network are adapted through a continuing process of stimulation by the environment in which the network is surrounded.
MLP is a neural network structure which uses supervised training and is used in this study. MLP is a layered arrangement of PEs in which the output of each layer is connected to the input of the next layer. An MLP has an input layer of source
PhD level course – Daniel Durand Academic Year 2015/2016 19
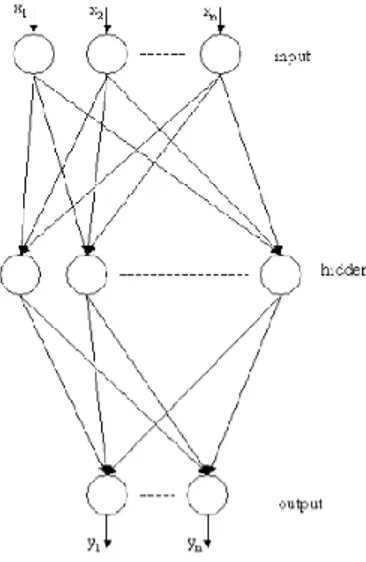
nodes, an output layer of neurons, and one or more layers of hidden neurons, which are so called because they do not have direct connection with the input or output end of the network structure.
Figure 4: The general MLP structure with tree layers
The MLP structure is depicted in Figure 4. Each connection between the neurons is weighted by a scalar, called a connection weight which is adapted during learning. The back-propagation of error algorithms is most widely used for training MLP [47]. In the back-propagation algorithm, the output error is propagated backward through the connections to the previous layers. There are two phases in the training process, feed-forward and back-propagation. In the feed-forward phase, each input sample is presented to the input layer and the output of the network is computed. In the back-propagation phase, the obtained output value is compared with the desired output value and the error is propagated backward through each layer to the input layer. The stop criterion is a fundamental aspect of training. The simple idea of capping the number of iterations or of letting the system train until a predetermined error value is reached.
PhD level course – Daniel Durand Academic Year 2015/2016 20
MLPs must be fast and effective however first they must be trained and at each change the training set can behave differently. It is frequency dependent because the input is a window with fixed length. They function well when identifying well-trained spikes and waves but struggle to recognize SWDs with complicated beginning and end times.
4.3.3 Non- Deterministic and Deterministic finite automaton (NFA, DFA)
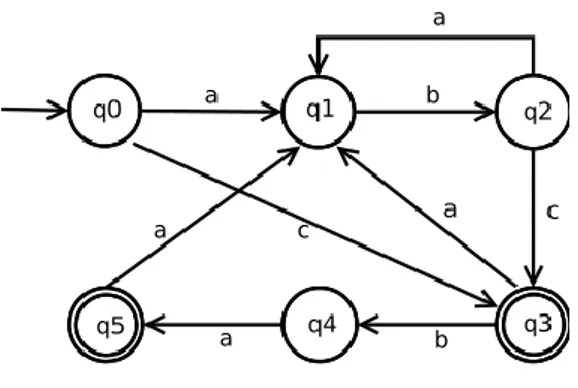
A deterministic finite state machine or deterministic finite automaton (DFA) is a finite automaton that enters a single unique symbol in the form of a character of its input alphabet (the possible inputs) from the state in which it is located to the successive state. It differs from non-deterministic finite automata (NFA), whose state changes do not always have to occur deterministically. A DFA example in shown the figure below (Figure 5).
NFA, DFA, and type-3 grammatics (in the Chomsky hierarchy) are of the same linguistic class; NFAs can be converted into equivalent DFA by means of power set constructions.
The Formal definition for a DFA M is a 5-tuple, (Q, Σ, δ, q0, F), consisting of a finite set of states (Q);
a finite set of input symbols called the alphabet (Σ); a transition function (δ : Q × Σ → Q);
an initial or start state (q0 ∈ Q); a set of accept states (F ⊆ Q).
PhD level course – Daniel Durand Academic Year 2015/2016 21
As we see in the diagram (Figure 5) the initial state is denoted by q0 in the graphical representation, the states Q {q0, q1,q2, q3, q4, q5} are represented by circles, where double circles represent the accented states F { q3, q5}, and the transition function with arrows with the respective word from the Alphabet. The alphabet Σ consists of the elements {a, b, c}.
Figure 5: Graphical representation of a DEA example
As can be seen from the diagram, the state q0 expects the symbol a to change to the state q1 or the symbol c to go to the registered state q3. Each state has its input symbols and points to the new state. This mode of operation is very simple, fast, effective and is therefore also well suited for scanning an EEG signal but can be very complex.
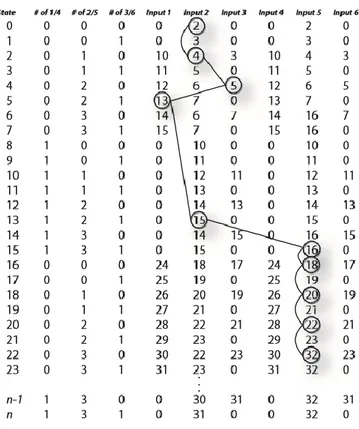
In the diagram (Figure 6), a part of a DFA is designed for the detection of spikes, a table structure consisting of 336 entries [13]. This is a simple DFA model since it manages with 9 symbols. Assuming the symbols are the single sampling points, then we had already, with only 8-Bit scanner resolution, 256 symbols and it can be seen that the resulting DFA is much more complex. In addition, a DFA solution is frequency-dependent because the states increase with the sampling rate.
PhD level course – Daniel Durand Academic Year 2015/2016 22
Figure 6: Sample Transition Table for Spike detection
4.3.4 Basic operation and limitation
All of the above methods are bound to a maximum scanner window width when scanning the EEG data. When scanning, the scanning window overflows, and thus the variation between the scanning result at the point ti and at point ti+1 is very
small. The unique detection of spikes, spikes and waves or SWDs is difficult because the same spike is detected not only once, but over a period of time, the unique time stamp is subsequently difficult to determine.
With the DFA, the situation looks somewhat different. The DFA has no problem with the time window, the transition table simply becomes more complex if the
PhD level course – Daniel Durand Academic Year 2015/2016 23
window width or the sampling rate is bigger, but is bound to the sampling rate and thus transferred to other sampling rates.
In all the methods described, it is not easy or potentially impossible, to assign induvidual spikes, and the SWDs a unique identifier or even a qualitative or quantitative name.
4.4 Pushdown Automata (PDA)
As such, EEG data can be treated as a language, and computer science techniques, for instance compilers, can be used to generate one language as an input and another as an output, enabling the automation of this task.
In computer science, the PDA is used to process the grammar of a compiler. The EEG data can also be viewed as a language, thus applying the rules of a compiler, i.e. a lexer for the token and a parser for the grammar, and to translate the EEG input data into another output sequence of symbols to provide the expert with a better interpretation of the wave.
Within epileptic events, spike waveforms vary greatly and are therefore very hard to identify. It requires an expert, who has the necessary experience, to identify the SWD.
The basic characteristics used to define a SWD or WAG/Rij rats and GAERS: A characteristic train of sharp, asymmetric, large-amplitude spikes, and
slow waves- lasting at least 1s; A minimum of 3 spikes in sequence;
PhD level course – Daniel Durand Academic Year 2015/2016 24
A sharp onset and abrupt offset (The first and last spike of a SWD complex with an amplitude at least 2-fold higher than the basal EEG was accepted as the SWD onset and offset);
An amplitude (100 - 450µV) more than double the preceding background EEG;
A mean duration of 4 - 5s (with an accepted interval of 1 - 30s);
A first negative spike (with an amplitude of 25 - 50µV and a duration of 40ms) and slow positive wave (with a duration of 100 - 150ms);
A second spike (with an amplitude three times that of the amplitude of the first spike, (with a duration of 30 - 90 ms) followed by surface negative wave (with a duration of 150 - 250ms);
A frequency of spike-waves in the SWD complex of 7 - 13Hz; An observation of the clustering of SWDs;
When the time interval between two SWDs was greater than 1s, the discharges shouldbe regarded as a single seizure.
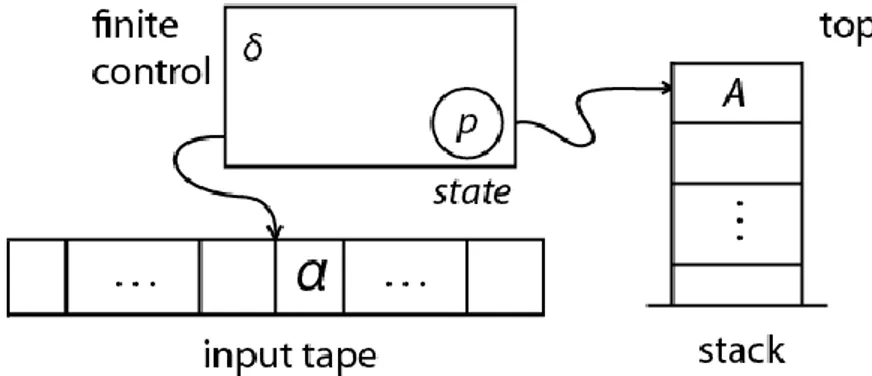
A PDA serves to clarify whether an input (i.e., a word of zero, one or more characters) belongs to a particular formal language (i.e., a set of words). For this purpose, the automaton processes the input word step by step from left to right and can assume a series of states. To begin with, it is in the so-called start state; typically, a character is read from the input in each processing step. Also, in each processing step, the topmost character is read from the bottom character upwards, i.e., removed. Depending on the current state, the input character being read, and the cell character just read, the automaton changes to a new state and replaces
PhD level course – Daniel Durand Academic Year 2015/2016 25
the remote cell character with a new word on the stack. If the entire input has been read and the stack is empty, the input has been recognised as a language by the machine.
In general, however, several deviations from the above explanation are possible: The recognized language can also be defined as the set of words, in the
processing of which the PDA reaches a so-called final state, irrespective of whether the stack is emptied;
A character must not be read from the input in each processing step. If none has been read, the read word is called ε (the empty word);
For some combinations of state, input character (or ε) and end character, the PDA can have the choice between several transitions (i.e. combinations of successive state and end character). In this case, the input is interpreted as being recognized if the end character can be emptied or a final state can be reached.
We use standard formal language notation: Γ* denotes the set of strings over alphabet Γ and ε denotes the empty string.
A PDA is formally defined as a 7-tuple: M = ( Q, Σ, Γ, δ, q0, Z, F ) where
Q is a finite set of states;
Σ is a finite set which is called the input alphabet; Γ is a finite set which is called the stack alphabet;
PhD level course – Daniel Durand Academic Year 2015/2016 26
q0 ∈ Q is the start state;
Z ∈ Γ is the initial stack symbol; F ⊆ Q is the set of accepting states. The Figure 7 shows a formal diagram of a PDA.
Figure 7: A diagram of a pushdown automaton
The PDA recognizes precisely the context-free languages (type-2, in the Chomsky hierarchy). It is thus more flexible than finite automata, such as DFA, which recognize exactly the regular languages (type 3), but less adequately than Turing machines, which exactly identify the recursively selectable languages (type 0).
4.5 The advantage
The advantage of using a PDA is the ability to view the accumulation of data into an abstract syntax tree (AST). The AST is a tree-like structure that depicts the allocation of symbols based on fulfilling defined production rules, as specified in the grammar. Each symbol has properties that are manifested in the application of: Fourier analysis, power, wavelets, linear regression, polynomials, neural networks,
PhD level course – Daniel Durand Academic Year 2015/2016 27
and other methods that highlight different properties of the wave. The fact that during the analysis of a symbol you can browse through the AST, search for specific symbols or the union, which must abide by the constraints stated, to activate a production rule providing greater detail of the individual properties than you can establish through the analysis of a single window of the data stream.
4.6 The aim of this thesis:
The goal is to create a prototype that is based on a grammar to perform a data analysis. The grammar should also be able to be manipulated by a non-computer scientist with minimal training. In the grammar, the rules expressed should be able to define criteria for individual elements, so that a clear identification of these elements or groups of elements is possible. So that the results produced can answer the questions posed by the scientists involved. In addition, the grammar should not be linked to a set data type, so that it can also be repurposed or parts of it can be reused.
PhD level course – Daniel Durand Academic Year 2015/2016 28
5 Automated Epileptic Spike and Wave Detection
In our approach to develop a solution to the problem of the detection of Spikes remains mostly unchanged, the problem is divided into two sub problems [8][11][12][14][17]:
1. Feature extraction; 2. Classification.
The methods used for the detection of Spikes, for analysis, are [3][7][9][10]: mimetic techniques, morphological analysis, template matching algorithms, parametric approaches, independent component analysis, artificial neural network, clustering techniques, data mining and knowledge-based rules.
The methods used for the detection of Spikes, for analysis, are [3][7][9][10]: mimetic techniques, morphological analysis, template matching algorithms, parametric approaches, independent component analysis, artificial neural network, clustering techniques, data mining and knowledge-based rules.
Mimetic techniques are based on the visual interpretation of an EEG Expert based compared values for distinctive attributes of the spike, such as: slope, power, duration, sharpness and shape form [18][37].
Morphological analysis utilises the extraction of intrinsic information from signals to amplify epileptiform patterns such as the statistical behaviour, frequency spectrum and time-frequency components [13][30][31][38].
PhD level course – Daniel Durand Academic Year 2015/2016 29
Template matching algorithms use an averaged set of visually selected spikes from wave sections to create templates that are then compared to the recorded signal [16][39].
Parametric approaches use a local stationarity for noise identification, allowing the separation of spikes from the data due to their deviation from the noise [36][41]. Knowledge-based, clustering techniques, and artificial neural networks have been trained with good and bad datasets, with features selected by the researcher to detect spikes [19][33][34].
Data Mining techniques builds automatic detection models that do not need a clear definition of a spike morphology to detect spikes in a signal [35][40].
PhD level course – Daniel Durand Academic Year 2015/2016 30
6 Methods
A sequence of data, such as that of an EEG signal, can be viewed as a language that has on the lexemes, grammar, semantic and finally translation into another language understandable to the end-user. This way of treating the data corresponds exactly to compilers used in computer science for application programming.
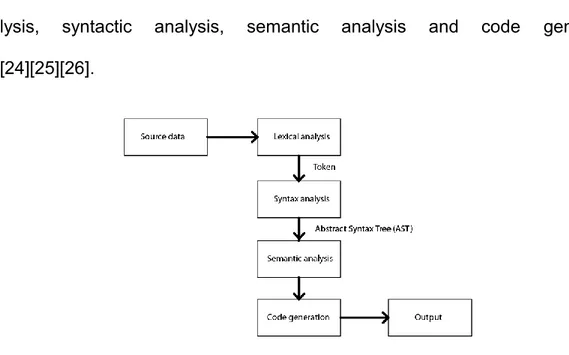
The structure of a compiler is defined by at least 4 stages (Figure 8): lexical analysis, syntactic analysis, semantic analysis and code generation [23][24][25][26].
Figure 8: A Block diagram showing compiler phases.
6.1 Critical issues
It is important that the results obtained are scalable, such that it is possible to refine the method and maintain the highest level of transportability with future work.
PhD level course – Daniel Durand Academic Year 2015/2016 31
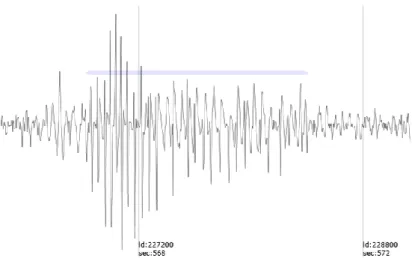
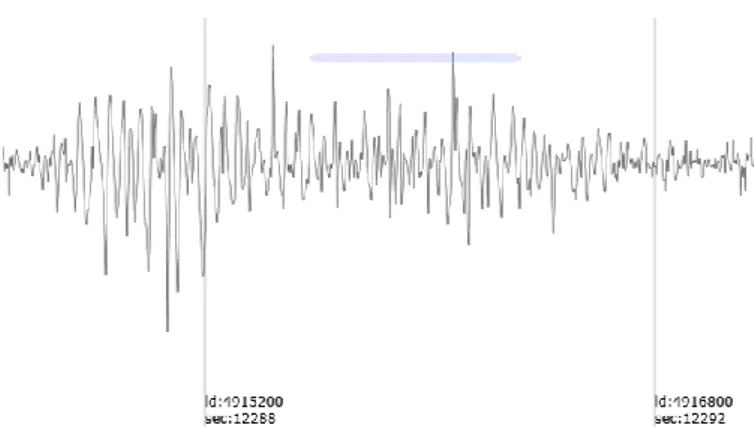
The variation of data within SWDs is large, the images below are examples of a true positive (TP) (Figure9), a false positive (FP) (Figure10) and a false negative (FN) (Figure 11) that illustrate this problem. The line above the wave indicates automatic recognition and shows that TP and FP will differ in the wave pattern while the FN is visually closer to the performance wave as the TP, but not detected!
Another issue we faced, affecting the development of a SWD classifying grammar is the level of noise in EEG data, as it is difficult to separate the signal from noise, due to the low voltages at which EEG signals operate, meaning noise introduces large effects on wave that are unnecessary, this level of noise’s effect makes it very hard to accurately and reliably classify SWD subsets.
PhD level course – Daniel Durand Academic Year 2015/2016 32
Figure 10: The system-detected event, disputed by an expert (FP)
Figure 11: The system-detected non-event, disputed by an expert (FN)
6.2 Lexical analysis (scanner)
Lexical analysis characterizes the lexemes, a block of data that is called a token that represents an atomic unit. The function that defines the token is the difference of Gaussians (DoG) (4) (5) (Figure 12) which invokes a signal, generated by the passage of the sign, from positive to negative and vice versa, to indicate the start of a new token [27][28][29]. With input data, reported in the correct metric, DoG
PhD level course – Daniel Durand Academic Year 2015/2016 33
does not depend on the frequency of the noise on the resolution (Figure 13). The token consists of a list of input data that has different properties such as: power, slope, duration, shape and all the others that can be calculated from the data. Therefore, the token is defined with the following properties: Power (dB), Duration (ms), Shape (FFT) that allow reproduction of the original, normalized wave.
(4) (5)
PhD level course – Daniel Durand Academic Year 2015/2016 34
Figure 13: An example of tokening from prototype software with DoG in red and normalised
EEG data represented in blue
Using the median, the signal is normalized to obtain a stable and homogeneous base line.
The syntactic analysis takes the sequence of tokens generated in the previous phase (lexical analysis) as inputs and performs syntax checking. The syntax check is carried out through a grammar, resulting in the formation of an abstract syntax tree (AST).
6.3 Token
Tokens are the smallest elements using the system, and so are the basis for our analysis. The Token is a set of data in sequence with dynamic recording time, by employing the DoG segmentation feature, which forms the wave and allows the calculation of attributes based on all the data such as Power, Timespan, Slope and Shapename.
PhD level course – Daniel Durand Academic Year 2015/2016 35
The Power attribute is the wave energy expressed in the unit of measure (6) and is calculated as follows:
(6)
The Slope attribute represents the speed of growth for wave millisecond, expressed in degrees (7), and is calculated in the following way:
(7)
The Shapename attribute is the normalized stamp of Fourier analysis (8) represented in a list in the following form:
1 Harmonica = Frequency (Hz), relative amplitude (%), Phase (Degrees °) 2 Harmonica = Frequency (Hz), relative amplitude (%), Phase (Degrees °) ...
(8)
The Shapename describes its form, independent of the energy and the time of the real wave, such that Fourier stamp then is universally comparable.
6.4 Syntax analysis (Parser)
This type of formal grammar, as defined in the Chomsky hierarchy, is type 2 context free; and the parser support, led by the symbols attributes, is a bottom-up type commonly called parser LR(0) [23][24][25][26] (Figure 14). The tokens, provided by the lexical analysis, always have the same form for the parser. The differentiation comes from the context of the token, that is, the values contained in the token list provide additional information to determine how to apply the
PhD level course – Daniel Durand Academic Year 2015/2016 36
grammar [20][21][22]. The Grammar is a text file that contains transformation rules that 'reduce', these grammar rules are applied in a loop, for as long as possible. Once this is no longer possible, the grammar makes a 'shift' to get a new token in the AST stack and reapplies the grammar. The Abstract Syntax Tree (AST) generated by the parsing process is the results of data classification.
Figure 14: A diagram elaborating the process of parsing
6.5 Grammatical
6.5.1 Definition
A grammar is defined as the tuple . It consists of a finite set of nonterminal symbols (N), a finite set of terminal symbols (Σ), a finite set of production rules (P), and a start symbol (S). When applied to the program; Σ represents the tokens that come directly from the EDF files and P represents the set of rules described in the grammar file.
PhD level course – Daniel Durand Academic Year 2015/2016 37
6.5.2 Grammar file definition
For the definition of the grammar there is a simple syntax that is written to a text file which represents Feature extraction.
Keywords are identified by the character ":" that follows immediately after the key name. Currently there are the following keywords: define, power, shapename, timespan, uniontime, slope, slope_abs.
The creation of a grammar is simple and follows the following structure: define: Symbol
optional attribute: [condition] ...
Symbol| Symbol| ...
optional attribute: [condition] ...
optional
Symbol| Symbol| ...
optional attribute: [condition] ...
6.5.3 Grammar file example
For the example below, the keyword define defines a new symbol (define:
spn). Directly after attributes are listed with the conditions that must be met by the new symbol. The directive timespan: [.. 90] indicates that the duration of the symbol or token has as a minor constraint equals 90 ms. The line
PhD level course – Daniel Durand Academic Year 2015/2016 38 p5|p6|p7|p8|p9 indicates the first input symbols split with the "|" optionally, followed by the criteria which must be fulfilled- symbol slope_abs: [70 ..],
timespan: [.. 35]. The next line lists the second symbol set-
n3|n4|n5|n6|n7|n8|n9 that has no criteria to be fulfilled.
define: spn timespan: [ .. 90] p5|p6|p7|p8|p9 slope_abs: [70 ..] timespan: [ .. 35] n3|n4|n5|n6|n7|n8|n9
The grammar used to analyze the data is composed of 49 symbol definitions with a total of 297 rows.
6.6 Abstract Syntax Tree (AST)
An abstract syntax tree (AST) is a visual representation of the abstract syntactic structure of EEG data after evaluation by the grammar file (Figure15) (Figure16). Each node of the tree denotes a symbol construct occurring in the data.
PhD level course – Daniel Durand Academic Year 2015/2016 39
Figure 15: The hierarchy of an abstract syntax tree (AST)
The application is a real-time display of the AST for immediate visual control and analysis of the grammar.
Figure 16: An example of abstract syntax tree formation from prototype software
6.7 Semantic analysis
PhD level course – Daniel Durand Academic Year 2015/2016 40
6.8 Code generation
With the inline directives included in the grammar, symbols are identified that represent the output of the transformation that is transcribed into a comma-separated values (CSV) file. The sequence of the output from the CSV file is as follows: Symbol, Begin, End, Duration. In a second CSV file, the sequence of symbols is elaborated considering Union-time, an apothecary attribute grammar, which allows internal event analysis.
Text file with the Symbol E in output: Sym, Begin, End, Duration E, 656.0525, 658.4100, 2.3575 E, 678.5975, 689.8800, 11.2825 E, 718.1650, 721.6475, 3.4825 E, 726.3100, 729.4850, 3.1750 E, 730.9650, 733.5950, 2.6300 E, 741.4200, 744.9500, 3.5300 E, 753.3450, 756.5350, 3.1900 E, 758.9200, 761.2050, 2.2850 E, 771.0125, 774.2975, 3.2850 E, 794.0550, 797.0700, 3.0150 E, 808.9275, 812.4750, 3.5475 E, 849.7425, 852.0675, 2.3250 E, 927.6050, 929.1125, 1.5075 E, 939.9675, 944.2900, 4.3225
PhD level course – Daniel Durand Academic Year 2015/2016 41
Text file with the Symbol E in output:
Out, ID, Sym1, Sym2, Union-time E, 493752, E, bnp, 135 E, 493752, E, snp, 52.5 E, 493752, E, bnp, 67.5 E, 493752, E, snp, 55 E, 493752, E, SW, 57.5 E, 493752, E, SW, 20 E, 493752, E, SW, 27.5 E, 493752, E, snp, 40 E, 493752, E, snp, 42.5 E, 493752, E, bnp, 77.5 E, 493752, E, SW, 60 E, 493752, E, snp, 0 E, 493752, E, bnp, 55 E, 493752, E, SW, 50 E, 493752, E, snp, 32.5 E, 493752, E, snp, 45
PhD level course – Daniel Durand Academic Year 2015/2016 42
7 Materials
The two main aspects of the materials section concern the EEG data and the software development. The EEG data files are very large and have a special data format, this large file size can give rise to some data processing issues, for the expert and the current computers.
During software development, it was vital to work closely with those knowledgeable of software to ensure the quality of the prototype and that they are experienced in its use.
7.1 EEG data
Seizure waveform data was recorded for 17 hours at a frequency of 400Hz from WAG/RJJ rats, via an electroencephalogram, the drug or placebo was administered at 4 hours, and all data was subsequently stored in a European data file format (.edf).
EDF is a simple file type used to transfer and store multichannel biological data to allow streamlined and universal communication by researchers. Of the files recorded, we analysed two manually and automatically to review the accuracy of the grammar file; the remaining files were only analysed automatically, as manual analysis is very time consuming.
During manual inspection of the files, the expert analysed two datasets, each of 17 hours- checking 6 hours (at 0,1,2,3,6 and,7 hrs) thoroughly in each, and in this 12 hours a total of 207 SWD events were identified. The display window for manual
PhD level course – Daniel Durand Academic Year 2015/2016 43
analysis is approximately 10s in width, which corresponds to 4000 raw data-points on screen at any one time. The total time involved to analyse the control, amounted to about 3 days, as to obtain a level of quality that adequately evaluates the method, a high level of accuracy is required, restricting daily analysis to about 4hrs of data, so to analyse all files manually it would have taken 68 days.
Two compounds were tested for altered spike and wave activity, at different doses, against the vehicle; Baclofen (4mg), an old generation anti-epileptic, which acts as a GABAB receptor agonist, causing muscle relaxation; and Ethosuximide (100mg),
an anticonvulsant drug that is first choice for the treatment of absence seizures and has been shown to decrease the firing of thalamacocortical neurons, though a definite mechanism of therapeutic action remains elusive.
7.2 Software development
The prototype was made in Visual Studio® 2015, and written in the C# language. The software (SW) consists of 2003 lines of code and is divided into three modules: the program, with the user interface; a library for reading European Data Format (EDF); and a library that contains all the mathematical functions. The user interface was developed implementing Windows Presentation Foundation (WPF), the latest technique proposed by Microsoft®.
This prototype interface allows you to view up to 4 tracks with the ability to immediately alter them (Figure 17). The analysis of the grammar takes place constantly, and the AST is represented in a graphical form in the programme window, for instant verification of the grammar during production (Figure 18). Transversely to this, a filewatcher SW automatically updates the AST
PhD level course – Daniel Durand Academic Year 2015/2016 44
representation, further facilitating the use of the software by an expert. This filewatcher is a function of the operating system that observes the file, that contains the definition of grammar, and sends a message to the SW at the point in time that the edited file is saved.
Later, during the design of the SW, a further application of the software was realised that it could be used to monitor the signal in real-time.
Figure 17: Prototype general user interface
PhD level course – Daniel Durand Academic Year 2015/2016 45
8 System performance evaluation
To ascertain the effectiveness of this method of event detection, the parameters of the system must be considered concerning the: artefact, non-seizure, and seizure data subsets, which have been described as follows [17][18][19]:
True positive (TP): A system-detected event, validated by an expert; True negative (TN): A system-detected non-event, validated by an expert; False positive (FP): A system-detected event, disputed by an expert; False negative (FN): A system-detected non-event, disputed by an expert.
Using these data points, system performance can be analysed by measures of:
1. Sensitivity (SEN): The measure of the ability of the system to correctly detect seizure activity;
2. Specificity (SPE): The measure of the ability of the system to detect non-seizure activity;
3. Selectivity (SEL): The measure of the ability of the system to reject false detections of seizures;
PhD level course – Daniel Durand Academic Year 2015/2016 46
4. Average detection rate (ADR): The average of sensitivity and specificity;
5. Balanced Error Rate (BER): The average of the error rate;
6. Accuracy (ACC): A measure of the closeness of a measurement to the true value;
7. Matthews correlation coefficient (MCC): A correlation coefficient between the observed and predicted classifications;
8. Dice's coefficient: A measure that compares the similarity of overlaps.
PhD level course – Daniel Durand Academic Year 2015/2016 47
9 Results
With the development of an alpha prototype version, for the verification of: the feasibility; recognition capabilities of SWD events; and progressive Grammar - which represents the dynamic component of the SWD recognition. Using simple criteria coming from the Tokens such as: Power, Timespan and Slope, the results obtained significance for the Positive predicative value of 96% (SEL), the 92% True positive rate (SEN), and the 6% Balanced Error rate (BER) as reported in the following tables.
The Table 1 shows the number of individual events; accordingly, the number of TN is calculated by TP + FN + 1. This representation does not take into account the time between events nor the size of the events compared to the total data.
SWD count TP FN FP TN SEN SPE SEL ADR BER ACC MCC Rec 1 102 1 5 104 99.0% 95.4% 95.3% 97.2% 2.8% 97.2% 94.4% Rec 2 88 16 3 105 84.6% 97.2% 96.7% 90.9% 9.1% 91.0% 82.7% Rec 1 + 2 190 17 8 208 91.8% 96.3% 96.0% 94.0% 6.0% 94.1% 88.2%
Table 1: SWD count
The Table 2 shows the data in terms of the total time of the events and clearly demonstrates that the values are improved, in particular the SPE value is better because of large files and short events.
SWD second TP FN FP TN SEN SPE SEL ADR BER ACC MCC Rec 1 536.094 5.750 10.493 21058.156 98.9% 100.0% 98.1% 99.4% 0.6% 99.9% 98.5% Rec 2 334.171 42.750 5.860 21223.079 88.7% 100.0% 98.3% 94.3% 5.7% 99.8% 93.2% Rec 1 + 2 870.265 48.500 16.353 42281.235 94.7% 100.0% 98.2% 97.3% 2.7% 99.8% 96.3%
PhD level course – Daniel Durand Academic Year 2015/2016 48
The Table 3 displays the Overlap ratio of events. As indicated by the ratio of the median to the mean when the events are smaller on average this can negatively affect the Overlap value. Despite this the Overlap is 93%.
Overlap second
Sum Automatic Sum Manual Sum Overlap Dice's coefficient Mean Median Rec 1 536.094 572.150 523.238 94.4% 4.580 4.095 Rec 2 334.171 297.500 284.458 90.1% 4.577 4.000 Rec 1 + 2 870.265 869.650 807.696 92.8% 4.251 3.822
Table 3: Overlap second
The results show that the support when used is functional and that the results could only be improved with a more sophisticated grammar. The analysis of an EDF file, composed of 4 recordings totalling approximately 17 hours, with a single recording containing about 24'480'000 data points. A PC with Intel i7 and 8GB of RAM committed about 20-30 minutes to analyse each file, which was strongly dependant on the composition of the grammar.
PhD level course – Daniel Durand Academic Year 2015/2016 49
Because the evaluation of the data is very time-intensive for the expert (taking several weeks), we decided to create a graphical representation of it, so that the expert can assess the quality of evaluation by the prototype.
We have two different agonists: the first is the Baclofen, which is a drug known to increase the SWDs events; and the second drug considered is Ethosuximide (ETX), which acts inversely compared to Baclofen, as it is known to suppress the SWDs.
In addition, there is the neutral, saline solution, that served as a control and as a base line, so that we could represent the effect of the respective agonist. The first 4 hours of data are used for the calculation of a general baseline and also serves by allowing subjects to stabilise in their environment, so that all subjects are brought to a similar resting condition.
By establishing an average value for the occurrence of SWDs per hour during the first 4 hours, and the determination of an average value for the duration of each SWD, the baseline was able to be obtained. At the end of the 4th hour, an agonist, Baclofen or ETX, or the Saline solution was injected, and the SWDs were counted for each hour until the end of the recording.
In the graphs, one for Baclofen (Figure 19) and ETX (Figure 20), Diagram A depicts the number of SWDs per hour, B represents the same data as percentages. In Chart C, we see the average duration of SWDs per hour, and in illustration D the average duration is shown in percent.
PhD level course – Daniel Durand Academic Year 2015/2016 50
The note "WFD 160711" refers to the version of the grammar used to process the data.
The information provided from the interpretation of the generated graphs, by the experts, is extremely pleasing. Since the graphs seemed to clearly correspond with the expected data according to the expert, see the corresponding graphs in the following publications for Baclofen (and below in Figure 21) [42] [43]. One can see the overt positive correlation between the SWD events and Baclofen administration in the first hours, and the reduction of the SWDs with ETX.
It must be noted that the computer science expert did not have any preconception of the expected outcome of these figures. This further supports the functionality and the quality of the output of this prototype.
PhD level course – Daniel Durand Academic Year 2015/2016 51
Figure 20: Ethosuximide
Figure 21: (Fig. 4G) The preferential mGlu2/3 receptor antagonist, LY341495, reduce the frequency of spike-waves discharges in the WAG/Rij rat model of absence epilepsy
PhD level course – Daniel Durand Academic Year 2015/2016 52
10 Discussion
The use of a grammar makes the system extremely flexible for identifying sections of a wave. In this publication we have seen the strategy of a compiler applied to EEG data. It was shown that the AST generated by parsing gave the opportunity to explore the composition of the identified wave. The effectiveness of this method to highlight events, using only a very simple grammar, is remarkable. In this case we have only scratched the surface of the true capacity of this methodology. The application of tokens and symbols allows the use of techniques such as Fourier analysis and others that establish parameters and criteria to further define the grammar. It is not restricted to linear analysis unlike techniques such as Neural Networks, Random Forest and Deep Machine Learning techniques to define strong grammar. Using simple criteria coming from the Tokens such as: Power, Timespan and Slope.
The results obtained for the counting of SWD events attained significance with: a positive predicative value of 96% (SEL); a true negative rate value of 96% (SPE); a true positive rate of 92% (SEN); and a Balanced Error rate (BER) of 6%. The results from the analysis into event time had an increased significance with: a SEN of 95%; a SPE of 100%; a SEL of 98%; and a BER of 2.7%. Dice's coefficient was about 93% indicating a good degree of overlap between the automatic data and the data from the expert. Therefore, with the exploration of the waveforms to better the grammar and the description of noise and it’s effects, see future work, the results can only improve.
PhD level course – Daniel Durand Academic Year 2015/2016 53
11 Conclusion
After the problem concerning the definition of SWD events was detected by the computer scientist, a software prototype was created based on a compiler. The prototype has been tested by experts for its functionality by creating and testing various grammatics. The grammar with the best results was used to analyse all the data sets, and graphs were generated for interpretation by the biological researchers. The graphs met the requirements of the biologists who are very satisfied with the short calculation time of approximately 3 hours (allowing for additional time for the production of graphs). In addition, 12 hours of data were evaluated manually by the expert and then statistically evaluated. The results are not disappointing with a sensitivity (SEN) of 92%; and a specificity (SPE) and selectivity (SEL) of 96% the bottom-up approach developed is promising, and while it requires further development it is already shortening analysis time for researchers.
PhD level course – Daniel Durand Academic Year 2015/2016 54
12 Future Works
In future studies, clustering analysis may be performed on tokens to define symbols that represent similar trends, such that it can create a more accurate grammar classifying the true signal patterns extracted from the background noise, to resolve the problems discussed by the critical issues. These symbols are the descriptors of Spike and Waves events and give an insight into an event’s composition. The system does not exclude techniques used previously, also, modern relevant techniques such Random Forest and Deep Machine learning can potentially be integrated, using basis of the Token to further explore these techniques.
PhD level course – Daniel Durand Academic Year 2015/2016 55
13 Acknowledgements
I would like to send my thanks to:
The University of Molise, Italy, especially: Prof. Gabriella Stefania Scippa, the PhD program coordinator; and Prof. Giovanni Capobianco (School of Computer Science), for providing guidance over the project’s duration with his experience, especially in mathematics;
The Mediterranean Neurological Institute IRCCS Neuromed, particularly, Dr. Slavianka Moyanova for the professional introduction into SWD recognition;
The University of Lincoln, United Kingdom, for the warm hospitality during my period abroad, and specifically to: Dr. Richard Ngomba (School of Pharmacy) and Dr. Tryphon Lambrou (School of Computer Science) for their support and patience during the various phases of my project. Also Rory McNeil (Student of the School of Pharmacy) for the support, exchanges, and testing of the prototype.
I would also like to give special thanks to my wife, Mary, and my daughter, Claudia, who supported me consistently throughout my project.
PhD level course – Daniel Durand Academic Year 2015/2016 56
14 Appendice
14.1 Abbreviation
ACC Accuracy
ADD Attention Deficit Disorder
ADHD Attention Deficit Hyperactivity Disorder ADR Average detection rate
ANN Artificial Neural Network APD Auditory Processing Disorder AST Abstract Syntax Tree
BER Balanced Error Rate
CSV Comma-Separated Values
CWT Continuous Wavelet Transformation DFA Deterministic Finite Automaton DFT Discrete Fourier Transformation DoG Difference of Gaussians
EDF European Data Format
EPSP Excitatory postsynaptic potential ERP Event-related potentials
PhD level course – Daniel Durand Academic Year 2015/2016 57
ETX Ethosuximide
FFT Fast Fourier Transformation FN False Negative
FP False Positive
GAERS Genetic absence Epilepsy rats from Strasbourg IFSECN International Federation of Societies for
Electroencephalography and Clinical Neurophysiology IPSP Inhibitory postsynaptic potential
MCC Matthews correlation coefficient MLP Multi-layer Perceptron
NFA Non-deterministic Finite Automaton PDA Pushdown Automata
PE Processing Element PSP Postsynaptic potentials SEL Selectivity
SEN Sensitivity SPE Specificity
PhD level course – Daniel Durand Academic Year 2015/2016 58
SWD Spike and Wave Discharges TAS Typical absences
TN True Negative TP True Positive
WPF Windows Presentation Foundation WT Wavelet Transformation
PhD level course – Daniel Durand Academic Year 2015/2016 59 14.2 Grammar (WFD 160711) // SWD grammar define: n9 power: [50 ..] shapename: 0, ,180 Token define: n8 power: [47 ..] shapename: 0, ,180 Token define: n7 power: [44 ..] shapename: 0, ,180 Token define: n6 power: [41 ..] shapename: 0, ,180 Token define: n5 power: [38 ..] shapename: 0, ,180 Token define: n4 power: [35 ..] shapename: 0, ,180 Token define: n3 power: [32 ..] shapename: 0, ,180 Token define: n2 power: [29 ..] shapename: 0, ,180 Token define: n1 power: [26 ..] shapename: 0, ,180 Token define: n0 shapename: 0, ,180 Token define: p9 power: [50 ..] shapename: 0, ,0 Token define: p8 power: [47 ..] shapename: 0, ,0 Token define: p7 power: [44 ..] shapename: 0, ,0 Token define: p6 power: [41 ..] shapename: 0, ,0 Token define: p5 power: [38 ..] shapename: 0, ,0 Token define: p4 power: [35 ..] shapename: 0, ,0 Token define: p3 power: [32 ..] shapename: 0, ,0 Token define: p2 power: [29 ..] shapename: 0, ,0 Token define: p1 power: [26 ..] shapename: 0, ,0 Token define: p0 shapename: 0, ,0 Token // Spike's define: snp timespan: [ .. 90] n5|n6|n7|n8|n9 slope_abs: [70 ..] timespan: [ .. 35] p3|p4|p5|p6|p7|p8|p9 define: spn timespan: [ .. 90] p5|p6|p7|p8|p9 slope_abs: [70 ..] timespan: [ .. 35] n3|n4|n5|n6|n7|n8|n9 define: snn
PhD level course – Daniel Durand Academic Year 2015/2016 60 timespan: [ .. 90] n6|n7|n8|n9 slope_abs: [70 ..] timespan: [ .. 35] n2|n3|n4|n5|n6|n7|n8|n9 define: spp timespan: [ .. 90] p5|p6|p7|p8|p9 slope_abs: [70 ..] timespan: [ .. 35] p2|p3|p4|p5|p6|p7|p8|p9
// Spikes & Waves define: sw2n timespan: [70 .. 200] n5|n6|n7|n8|n9 timespan: [ .. 35] p0|p1|p2|p3|p4 timespan: [60 ..] define: sw2p timespan: [70 .. 200] p5|p6|p7|p8|p9 timespan: [ .. 35] n0|n1|n2|n3|n4 timespan: [60 ..] define: sw1pn timespan: [70 .. 200] snp p0|p1|p2|p3|p4 timespan: [ .. 60] n0|n1|n2|n3 timespan: [ .. 60] define: sw1np timespan: [70 .. 200] snp n0|n1|n2|n3|n4|n5 timespan: [ .. 60] p0|p1|p2|p3|p4 timespan: [ .. 80] define: sw1nn timespan: [70 .. 200] snp n0|n1|n2|n3|n4 timespan: [ .. 60] n0|n1|n2|n3|n4|n5 timespan: [ .. 60] define: sw1pp timespan: [70 .. 200] snp p0|p1|p2|p3|p4 timespan: [ .. 60] p0|p1|p2|p3|p4|p5 timespan: [ .. 60] define: sw3np timespan: [70 .. 200] snn n0|n1|n2|n3|n4 timespan: [ .. 60] p0|p1|p2|p3|p4|p5 timespan: [ .. 70] define: bnp n5|n6|n7|n8|n9 p2|p1|p3|p4|p5|p6|p7|p8|p9 slope_abs: [..75] define: bpn p5|p6|p7|p8|p9 n2|n3|n4|n5|n6|n7|n8|n9 slope_abs: [..75] // Level 2 define: SW1 sw1pn|sw1np|sw1nn|sw1pp|sw2p|sw2n define: SW2 sw2p|sw2n define: SW3 sw3np define: SW SW1|SW2|SW3 define: E0t timeunion: 50 SW SW define: E0 timeunion: 150 E0t SW define: E0 timeunion: 350 E0 SW|snp|snn|spn|spp|bnp|bpn define: E0 timeunion: 250 SW|snp|snn|spn|spp|bnp|bpn E0 define: E0 timeunion: 500 E0 E0