The Long-Term Evolution
of the Suburbs of Milan
L U C A M O C A R E L L I University of Milano-Bicocca
1. The growing vitality of the Corpi santi from 18th century onwards. This paper deals with the long-term socio-economic evolution of the suburbs of Milan, one of the most dynamic European cities, and highlights the cause and effect of the most significant changes that have taken place since medieval times.
The advance of the form and structure of the city may be considered as an almost organic process, with the pattern of urban expansion being determined by long term factors. Milan, in fact, has developed radially and throughout the early modern era was composed of three distinct zones: a ‘hypercentre’ within the ‘cer-chia dei navigli’; a second ‘belt’ between the ‘navigli’ and the 16thcentury Spanish walls; and an area outside the walls, the so-called Corpi santi.
Most of the city, in terms of people and property, was to be found in the 264 hectares inside the ‘cerchia dei navigli’. At the beginning of the 19th century, this area was home to three quarters of the buildings and two thirds of the inhabitants of Milan. There were 560 or so hectares between the ‘cerchia’ and the ‘bastioni’, the Spanish walls built between 1548 and 1560. These walls created a clear separation between the city and the suburbs for the first time. This expanse featured numer-ous green areas adjacent to built-up areas which were situated mainly around the radial highways leading to the six main gateways of the city1.
Finally, outside the walls there was the Corpi santi, an area of around 63 square kilometres within «a ring of about two miles» around the city (see fig. 1). Here quite densely populated clusters of dwellings coexisted alongside more scattered homes of an obviously rural nature. These stand-alone homes included dozens of farms and the majority of them belonged to either the landed aristocracy of the city, monasteries or charities. This outlying territory was inevitably an arena of contact between different economic realities and its diverse regulations enabled it to per-form a range of functions (Carozzi 1976, 256-260).
Its demographic dynamics, which contrast sharply with those of the inner walled city, bear witness to its growing vitality (see tab. 1). The population of the walled city increased by a mere 4-5% between 1715 and 1816. Its rate of growth intensified between 1816 and 1911 but remained below 100%. The population of the outer district, however, already grown 50% during the early Austrian era and the French era, and exploded between 1816 and 1911, increasing almost twenty-six-fold. This marked expansion of Milan outside the Spanish walls is interesting because it is in no way depended on congestion in the area within the walls. Indeed, Carlo Cattaneo noted that «anyone believing that the city expanded outside
because of a lack of space inside would be committing a serious error» (Cattaneo 1956, 430). Even at the end of the 19th century there remained numerous empty building lots inside the Spanish walls (Denti, Mauri 2000, 106-107).
Nor can the phenomenal growth of the suburbs be attributed solely to a natur-al increase in population or to the presence of a different demographic rate from that of the city. The determining factor was the power of attraction exerted on flows of migrant workers which meant that the population living outside the Spanish walls, when measured in respect of density as well as numbers, quickly overtook that living inside the city. At the beginning of the 20thcentury the average
popula-Fig. 1. The Corpi santi (coloured) and the city (at the center, in light) in 1873
tion density of the built-up area of Milan was, in fact, 563 inhabitants per hectare within the ‘cerchia dei navigli’, 472 inhabitants per hectare in the area between the ‘navigli’ and the ‘bastioni’, and 622 inhabitants per hectare outside the walls (Belski, Montruccoli 2002, 83).
2. Corpi santi’s institutional and fiscal advantages. The extraordinary demo-graphic ‘performance’ of the Corpi santi may be primarily attributable to the spe-cific institutional and fiscal systems implemented in the outer ring after its econo-my underwent radical changes during the 19thcentury. In particular, the centuries-old condition of autonomy, above all regarding taxes, enjoyed by this outer district appears to have been decisive. It was largely unaffected by the introduction of the Fig. 2. Empty spaces and green inside the city walls (1760)
Source: Cognè (2009, 108).
particle with garden (719)
particle with vegetable garden (146) particle with meadow (3)
Theresian Cadastre, which brought only minor changes to the suburb’s privileged
tax arrangement.
This law of July 24 1802 reinforced the existing independence of the Corpi santi by making it a first class autonomous municipality. For the first time, Milan was deprived of the fiscal contribution of the entire provincial territory, and with that went its traditional supremacy over the surrounding countryside. Naturally enough, this did not go down well with the city administrators and they immediately sug-gested incorporating the Corpi santi into the city. A decree of February 8 1808 allowed for the incorporation of all communities within «a four mile circuit» into the city, with the result that not only the Corpi santi but also 35 other communities became part of Milan (Mocarelli 2006, 287-290).
As was pointed out at the time, the motive for adding this district to Milan was fiscal and taxing the suburbs was judged legitimate since their proximity to the city gave them numerous advantages. In effect, the inhabitants of the Corpi santi not only succeeded in getting higher wages and higher prices for their products, but they also had the benefit «of the city surgeons, hospitals, and schools, help in the case of fire […] more effective police surveillance and in short all the advantages of the city although being able to return to their homes each evening»2.
When the Austrians returned, however, a new territorial division came into force. It proposed to separate the Corpi santi from the city once again, and to bestow on the area the customary names used to refer to the six city districts. The intention of the distant Austrian government was clearly to reduce the importance of Milan by introducing a rival system of self-administration. However many peo-ple were cognizant of the link between self-administration of the Corpi santi, a more favourable tax system, a lower cost of living, and the greater growth of the suburb compared to that of the city. Consequently, they opposed the plans for aggregation proposed by the city. The representatives of the Corpi santi, in fact, ran Tab. 1. The population of Milan (1715-1911)
Year Total Population Milan within the Spanish Walls Milan outside the Walls
1715 123.595 110.595 13.000 1750 123.618 110.118 13.500 1768 124.681 112.892 11.789 1785 129.758 118.148 11.610 1796 133.869 114.469 19.400 1816 139.453 121.600 17.853 1861 269.297 196.109 73.188 1871 291.802 199.009 92.793 1881 357.000 214.004 142.996 1901 539.596 245.568 294.028 1911 698.775 234.782 464.047
Source: for the data 1715-1796 Mocarelli (2001, 203); for the year 1816 Della Peruta (1987, 19); for the other data Comune di Milano (1975, 21).
an intense media campaign against the proposal of aggregation through publica-tions and brochures, and even went so far as to create newspapers to support their cause. In particular, they stressed the fact that «the suburb of a big city has its own particular way of being and its own vitality» which it is only able to use to full effect when «it is freely allowed to follow its own laws and ways […] given that this move-ment is essentially external and peripheral it languishes and becomes sad at the thought of being taken in again as part of the city». It further suggested that the real reason behind the plan for combination was not so much the lack of space within the walls, but rather «the financial straits» the municipality of Milan found itself in, straits which led it to endeavor to spread the burden of funding the growing city «as widely as possible among those around»3.
Despite this opposition, by the 1870s the determined expansion of Milan could no longer tolerate the autonomy of the Corpi santi. It became an insurmountable Fig. 3. Milan in 1865 (note the railway lines outside the wall)
obstacle to effective planning of the territorial development of the city because a growing number of essential services – from railway stations to cemeteries to gas-ometers – lay outside the municipal territory of Milan and were subject to another administration. Then, in 1873, the provincial capital succeeded in forcing through aggregation on the back of a decree that allowed for the union of two municipali-ties without the need for mutual consent (Ranzini 1972, 27-28). The end of the Corpi santi’s autonomy did not, however, immediately affect its privileged fiscal sit-uation as an outer district, and a dual tax system, favouring the suburbs, remained in place until the revolts of 1898 (Punzo 1977, 124-126). Without doubt, this pro-longed condition of privilege played an important part in influencing a more marked demographic growth in the outer district as it meant a lower cost of living compared to that of the walled city, thus strengthening the suburban belt’s power of attraction.
3. Living in the Corpi santi: the real estate boom of the 19thcentury. The 18th cen-tury land registers already show a large number of dwellings to rent in the Corpi santi, especially in the areas of Porta Comasina and Porta Ticinese, where a census revealed that some individuals were owners of dozens of housing units4. These were houses that were often divided internally so that single rooms could be let out. Single rooms were in great demand, particularly among that very considerable mobile part of the population of Milan consisting of thousands of individuals who migrated seasonally to the city to find work as porters, brick-layers, cobblers, and labourers5.
The attraction of lower rents in the Corpi santi area, even in the face of gener-ally inferior living standards, only increased during the next century. Pietro Puricelli reflected on this situation in 1859, noting eloquently that it was the great difference in house prices inside either side of the walls that induced «the poor manufacturer to hide away outside the city in unsanitary environments, obliged to travel the distance between home and work place four times a day with loss of time and energy» (Puricelli 1859). In such circumstances real estate transactions in the Corpi santi offered an excellent investment, as can clearly be seen by the numerous speculative purchases made in the two most popular and most populated suburban areas, namely Porta Garibaldi and Porta Ticinese, where over 22.000 people in all lived in 18546.
Two examples from Porta Garibaldi illustrate the phenomenon. Between 1846 and 1847, Luigi Maderno in place of a small house with two pertiche of land, erect-ed a building with six storeys, 42 living rooms spread over three floors and several garrets. Around the same time, Girolamo Bertani had extended his tenement from 19 to 39 rooms7. There is similar evidence from Porta Ticinese, where 125 house improvements were declared in the same period. Some of these were of extensive proportions, such as the conversion by Giuseppina Faccioli of a property with 2 shops and 5 rooms into a three storey building with four shops and 25 rooms on three floors, or the addition of two storeys and 29 rooms to a building by Francesco Gatti8.
The building fever in the Corpi santi spread to other areas where population pressure was less pronounced than in Porta Ticinese and Porta Garibaldi. In the suburbs of Porta Venezia, between 1843 and 1846, Giorgio Gorla had not only enlarged one house he owned, doubling it in size, but had also built a new one with 55 rooms9. In this case, it must have been the high market values one could succeed in asking and securing that induced people to invest in real estate in the area. In fact, revenue from a first class unit of real estate was estimated as 40 lire, similar to that in the Corpi santi area of Porta Nuova, and greater than the 30 lire in the Corpi santi areas of Porta Magenta and Porta Romana.
Higher values, in the order of 45 and 42 lire, were recorded only in Porta Garibaldi and Porta Ticinese and, as already mentioned, this was due not so much to the quality of housing, which was rather poor, but more to demographic pres-sure10. Porta Garibaldi, with 1.470 inhabitants per square kilometer in 1854, was the most densely populated area. The 582 people per square kilometer that placed the suburbs of Porta Ticinese in an intermediate position were actually the result of very unbalanced settlement, since the majority of the population was concentrated in the neighborhood of San Gottardo, where the density greatly exceeded 1.000 inhabitants per square kilometer11. Rents increased by 15-25% in Porta Ticinese between 1828 and 1848, compared to what cadastral estimators deemed to be a 12% rise in the other Milanese Corpi santi12.
But this was just the beginning, and in the following decades the building fever in the Corpi santi was to reach previously inconceivable levels, featuring the con-struction of numerous «huge buildings to be rented out as one or two rooms sepa-rately». In the period 1871-1881 alone, when 64 new buildings were constructed within the city walls, almost 500 went up in the outer belt, most of which contained small apartments. These apartments housed people who found themselves forced to leave the walled city because of untenable high rents, alongside folk moving in from the countryside (Allocchio 1884, 41-43 and 84-88). Thus, the outer suburbs increasingly gravitated towards the city centre and commuting became more com-mon. Simultaneously, in the Corpi santi incidences of speculation on building lots reached alarming levels and caused serious problems for «the economy, hygiene and morality of habits» (La popolazione milanese 1883, 27).
4. The economy of Corpi santi: from agriculture to industry. The Corpi santi was experiencing not only dynamic demographic change but also had to come to grips with radical economic change as its traditional dependence on agriculture faded and was replaced by important industrial plants.
The outer ring had for centuries been an important area of food supply to the walled city, thanks to the advantage that proximity conferred in terms of reduced transportation costs. Ever since medieval times, the outskirts, and in particular the southern portion, had been an area of large farms producing food for the local mar-ket. These farms were usually run by abbeys, monasteries, nobles, and holy places, which, at the beginning of the eighteenth century, were still among the largest landowners in all six census divisions (see tab. 2). The Corpi santi was an area
where the land market was quite buoyant. In the twenty years between the land reg-istry survey initiated by Charles VI and the one completed by his daughter, Maria Theresa, about 12.000 pertiche of land changed hands, meaning almost 13% of the land surveyed13. One of the more noteworthy developments during this period was that, alongside land transfer among people of the same class, there was also a con-spicuous transfer of land from people of noble stock to non nobles, probably as a result of the inability to repay loans taken to address particular family situations. For example, over twenty years Giacomo and Annibale Simonetta sold off virtual-ly all their assets in the Corpi santi, giving up over 1.550 pertiche of land, about 102 hectares, for a value of more than the 20.000 scudi of the evaluation14.
On the other hand, goods produced in the Corpi santi were easy to place because their proximity to the city greatly increased their value. This had had already been highlighted when the estimators of the Teresian cadastre attributed to land in the outer ring almost double the value of comparable land located further from the city and in less accessible places15. In effect, the lands outside the city walls, even with predictable differences amongst them, generally reached rather high values, with an average price per pertica of between 15,8 scudi in Porta Ticinese and 24,2 in Porta Romana. It was no coincidence that Porta Romana was also the area which recorded the greatest volume of trading.
Similar differences are reflected in the varying degrees of development of agri-cultural areas in the outer ring. In the area south of Milan the agriagri-cultural scene was Tab. 2. The greatest landowners in the Corpi santi (1728)
Corpi santi Most important Land’s pieces Surface Value
landowners (pertiche) (scudi d’estimo)
Abbazia di Malnoè 56 2.459 42.839
Porta Orientale Conte Giulio Visconti 22 1.179 22.059
Carlo Maria Toscano 16 1.177 26.874
Conte Giuseppe Simonetta 49 679 11.378
Porta Comasina Fabbrica del Duomo 19 615 9.762
Fratelli Lonati 15 509 7.541
Duca Serbelloni 27 870 13.979
Porta Nuova Marchese Pozzobonelli 20 660 14.607
Conte Carlo Annoni 11 264 4.880
Abbazia di San Vittore 113 4.380 66.903
Porta Vercellina Conte Angelo Crivelli 32 1.697 36.304
Marchese Giorgio Clerici 31 1.660 31.759
Abbazia del Gratosoglio 55 3.273 46.531
Porta Ticinese Luogo Pio di Santa Corona 82 2.383 43.558
Monastero Santa Maria Vetere 31 1.850 28.845
Conte Federico San Secondo 10 916 16.171
Porta Romana Capitolo di San Nazaro 10 620 15.340
Marchese Pietro Goldoni 3 525 11.327
advanced and commercialized with a widespread range of rents to be paid in cash for both large pieces of land and more modest tracts also16. In contrast, it was still common in the northern area of Milan for a part of the rent to be paid in kind and solutions of mixed rent were also still in place in some cases17. Agricultural and con-tractual arrangements in the northern portion of the Corpi santi, in contrast to the southern part of the city, were conditioned by the lack of irrigation and the greater spread of the cultivation of mulberry trees18. This difference was to become more marked between the eighteenth and nineteenth centuries because of the enormous increase in the number of mulberry trees surveyed in the outer ring area, which in the space of 100 years went from 5.507 to almost 40.000. Over 33.000 of these trees were located in the northern Porta Garibaldi and Porta Magenta areas of the Corpi santi19.
The presence of agricultural structures such as those just highlighted stimulated growth in the Corpi santi in the early modern age. This was concentrated in the south, especially around the suburbs of Porta Ticinese. A census taken at the end of the eighteenth century indicated that a third of the population of the outer ring lived in Porta Ticinese20. This was due to the fact that Porta Ticinese, along with Porta Romana, was the most developed agricultural area in the Corpi santi, and enjoyed a supply of water power. Since medieval times, this asset had advantaged the area as an important centre of various manufacturing activities21.
A survey of 1714 – however biased22– recorded the presence of an important group of industrial plants outside the city walls, and this was corroborated in subsequent censuses (see tab. 3). Such findings, apart from confirming the importance of the Corpi santi in this regard, clearly show just how prominent the Corpi santi areas of Porta Ticinese and Porta Ludovica were. In 1726 there were already thirty-one mills, eight felt mills and four furnaces in the area. This Fig. 4. Villa Simonetta in the surroundings of Porta Comasina
Source: Marc’Antonio Dal Re, Ville di delizia o siano palagi camparecci nello Stato di Milano, Milano 1727 (Lauterbach 1996, 139).
amounted to two thirds of the industrial plants registered in that census. There were also eleven taverns and eighteen laundries23. Furthermore, several textile activities were installed around the city. In 1764 Domenico Venini had established a workshop for the bleaching of cloth in the Corpi santi of San Babila. In 1770 his workshop employed 37 workers (Greppi 1881, 85). There was a significant nucleus of linen weaving workshops present, reaching a count of around one hundred looms in 1781, half of which were to be found in the densely populated town of San Gottardo24.
However, it was during the nineteenth century, and especially in the second half of that century, that this manufacturing industry gained prominence in respect of the overall industrial growth of the Milanese area. It was accompanied, as we have seen, by an unprecedented demographic expansion of the Corpi santi. In fact, starting from 1840, when most of the manufacturing was still located within the walled city25, the situation rapidly changed. Carlo Cattaneo noted that in the early 1860s only a small part of the population of the outer ring was actually involved in agriculture, and that the majority relied on «the big carts, navigation, the railways, the big workshops of metals, of machinery, of porcelain, of gas, of oils, tallow candles, fertilizers, chemicals and on trading in cheese, cattle, grain, wines, lime, bricks, stone, building timber and firewood, peat and other fossil fuels» (Cattaneo 1956, 419).
Ann 1872 census counted 14.115 workers scattered among a multitude of small firms in the industries within the walled city. Conversely, there were only 6.641 industrial workers in the Corpi santi, but they were employed in larger plants (Bigatti 2000, 178). The land register data for the period give a quasi-photographic picture of the growth of industries in the outer district and record the presence of a great variety of factories concentrated mainly in two areas: one in the north, in the Corpi santi of Porta Nuova and Porta Venezia; the other in the south, in the Corpi santi of Porta Ticinese. 1879 the appearance of the Corpi santi area of Porta Nuova was already deeply marked by the presence of industry. In addition to the central station, with the sheds and workshops of the Alta Italia railway company, there were factories for the manufacture of cloth, paper and soap, together with foundries, lime kilns, machinery factories (Elvetica) and workshops26. For its part, Porta Venezia featured the Badoni foundries, Alta Italia and Grugnola, flanked by several Tab. 3. Installations in the Corpi santi according to eighteenth century land registry surveys Kind of plant 1726 1751 1 water wheel 2 w.w. 3 w.w. 4 w.w. 5 w.w. 6 w.w.
Mills 47 35 6 20 6 2 1
Clothmaking plants 9 11 1 5 4 1
Oil presses 1 5
Furnaces 5 1
Total 62 52 7 25 10 2 1 1
brick kilns and metallurgical factories27. On the opposite side of the city the presence of canals and several waterfalls guaranteed the continued existence of an important production centre. In fact, a census around the mid-nineteenth century had recorded the presence there of ten paper mills, five brick kilns and twenty-five mills28.
The following decades brought further growth in the shape of several tanneries, silk spinning factories, the gasometer, the Candiani cotton mill, the Richard ceramics factory and the Binda paper mill29. Elsewhere in the Corpi santi the presence of industry was less pronounced, but still worthy of note. In the suburbs of Porta Comasina there were button factories, mills, engineering works, the Benedetto Grondona works for the construction of railway carriages, and the Ermenegildo Castiglioni steam silk mill30. In the Corpi santi of Porta Magenta there were spinning machines, brick kilns and a textile printing works31, while in the Corpi santi of Porta Romana there were flour mills, in line with tradition, and a cotton spinning mill32.
Later on the presence of industry in the previous Corpi santi increased further, particularly where larger industrial plants were concerned, given that available spaces within the walled city were rapidly disappearing and were increasingly cost-ly. Illustrative of the changing scale of operations is the fact that in 1911, there were only 324 factories with over 25 employees within the city walls, but 678 in the outer belt33. The development paths of the new industrial sites were largely dictated by the construction of the railways, which from the 1840s onwards effectively re-chart-ed the map of industrial locations. It was the lowland cities which providre-chart-ed the greatest ease of logistical access to this revolutionary new means of transport. In the case of Milan, too, industries were no longer established randomly over the territo-ry but gathered around railway lines and stations. This is well illustrated by the guidelines to city expansion which were issued after the creation of two railway sta-tions, one built outside Porta Nuova between 1857 and 1864, and of the other built in Porta Genoa in 1865. Their position outside the walled city further facilitated the means of production and exchange that had developed in the suburban area and consolidated the predominance of the two zones of industrial expansion (Bigatti 2000, 188-193).
The first of these two zones was situated in the southern sector of the outer ring where a dense conglomeration of industries was soon established in proximity to the station and along the Naviglio Grande. These included the large firms of Riva and Richard Ginori alongside furnaces and paint factories. The Binda paper facto-ry was clearly visible along the Naviglio Pavese and the OM firm was adjacent to the railway station of Porta Romana. The second zone lay in the northern sector of the Corpi santi. This sector was to become the area of greatest development, not only because the Gotthard railway line was inaugurated there in the 1880s, but because a variety of factors worked in favour of this part of the city: these included the lower cost of farmland compared to that of the well-watered area to the south of Milan, the opportunity to construct vast plants more easily thanks to the greater depth of the water-bearing stratum, and the presence of several urban tramways.
The overall result was the consolidation within the city of three paths of develop-ment, quickly leading to the redrawing of the map of industrial Milan. The first, with a north-east setting, saw the growth on the outskirts of the city, and towards Sesto San Giovanni, of a great concentration of iron and steel works and mechanical industries centered on the plants of Breda (1904) and Falck (1906) and flanked by companies working on the technological frontier such as Pirelli and Ercole Marelli.
The second axis of development, along the north-west line in the direction of Gallarate and Varese, is where the mechanical-textile industry, particularly the cot-ton industry, predominated. The third line, north towards the Bovisa and Dergano, became the most important settlement area for the developing chemical industry, home to, among others, the Montecatini factory.
5. New changes in the 20th century. It was precisely in this phase at turn of the century that the foundations were laid for greater industrial and demographic growth in the outer ring to the north of the city. This process was reinforced imme-diately after the first world war when the Milanese railway lines were reorganized with the construction of a new central station. The functional balance between the centre and the outlying hamlets reached a definite crisis point because the rate of development outside the city impacted drastically on the level of the population living within the Spanish walls. Between 1901 and 1911 the proportion of the Fig. 5. Villa Simonetta, 1891
population living within the walls dropped from 45,5% to 33,6% of the total. And, while speculation on the value of property in the central areas assumed aspects which gave cause for serious concern, in the outer belt the population grew by nearly 170.000, thanks to exceptionally large flows of migrants to Milan, more than two thirds of whom did not come from the provinces.
This resulted in a dramatic increase in the built-up areas outside the Spanish walls, which more than doubled in the period between 1901 and 1911, and the deterioration of living conditions, with more than three people per room compared to two per room in the inner ring. It was also inevitable that the already considerable imbalance in revenues between the walled city and the outer ring should grow. In 1911 the average revenue within the canal ring was more than 80.000 lire, with a peak of 128.093 lire in the first district of zone one, while that of the suburbs did not reach even 7.000 lire, with a low point of 2.937 lire (Buzzi Donato 1969, 11-17). Within the ex-Corpi santi, the powerful industrial growth, geographically biased towards the northern area of the city, was also readily seen in the difference in density of population. If in 1861 no large differences in population per hectare were detectable, with the one exception of Porta Comasina, by 1921 the situation was quite different, with far more significant differences in favour of the northern part of the city (see table 4).
A new era was beginning in which the final demolition of the bastions removed the last physical evidence of a barrier or dichotomy between the inner and outer zones, or even the existence of two separate zones. Milan, on its way to becoming a metropolis, and having overcome the turbulence of the earlier stages of its growth to absorb the Corpi santi, was now ready to swallow up even towns that only a few decades earlier had been peaceful country oases. This is what occurred in 1923, when no fewer than twelve towns became part of the city (Affori, Baggio, Chiaravalle, Crescenzago, Gorla, Greco, Lambrate, Musocco, Niguarda, Precotto, Trenno, Vigentino). This involved around 105.000 inhabitants altogether (Buzzi Donato 1969, 74-83).
So, in the period between the two wars, the north of the city became clearly defined. It was an increasingly urbanised and industrial area (eight of the twelve towns absorbed in 1923 were in the north) and stood in distinct contrast to the southern zone, where the traditional agricultural activity was reinforced rather than replaced and where the settlement pattern was much more haphazard. At the same Tab. 4. Demographic density in the previous Corpi santi in the years 1861 and 1921
Corpi santi Density per he. 1861 Density per he. 1921
Porta orientale 5 123
Porta Romana 6 103
Porta Ticinese 8 43
Porta Vercellina 4 19
Porta Comasina 23 193
time, the nature of the centre was also undergoing radical change. The Milanese population had surpassed 1,2 million inhabitants on the eve of the Second World War, and yet again reached outwards, beyond the Spanish walls34. This thrust towards the external districts was intensified in the years of the ‘economic miracle’ which, thanks mainly to the contribution of flows of migrant workers, propelled the Milanese population figures towards the peak of 1,7 million registered at the begin-ning of the 1970s (see tab. 5).
Table 5 clearly shows the demographic collapse in the old town, which suffered the irreversible process of becoming part of the services sector and fell prey to the concurrent growth of the city outside the walls. While almost a third of the Milanese were still living within the Spanish walls in 1931, by 1967 this figure had fallen to lit-tle more than 8%. The changes in the old town were also brought about by serious war damage and the subsequent rapid emergence into the resulting gaps of many enterprises which were of a speculative nature. And while the face of the old town was changing irrevocably, construction work quickly took off in many outlying dis-tricts. The concentration in these parts of the city of most of the immigrant workers who had come to Milan in search of fortune, sometimes led to grave social problems. The growth of the Milanese suburbs, which was chaotic but nowhere near as dramatic as that taking place in Rome, was also due to the fact that civil servants, especially those of Milan City Hall, preferred the outlying areas for their public housing projects because of the lower costs of acquiring land. This preference also benefitted private owners of the areas landlocked by or bordering on the new neighborhoods that were being created since the city council shouldered the expense of substantial urbanisation charges, consequently increasing the value of the surrounding land too (Mocarelli 2011a, 521-525).
The result was the rapid growth of the more decentralized part of Milan, that contained between the outer ring and the municipal boundaries, where the number of inhabitants jumped from 350.000 in 1931 to 1,05 million in 1967. In proportional terms, the increase was from 35% of the city population to 62%. In some districts, such as San Siro-Lorenteggio, the population multiplied eightfold between 1931 and 196735.
However, the tremendous growth of that period had no effect on Milan’s increas-ingly clear vocation for the services sector. Testament to this was the absence, com-Tab. 5. The Population of Milan (1911-1967)
Year Total population Milan inside the spanish walls Milan outside the walls
1911 698.775 234.782 464.047 1921 834.618 255.440 579.178 1931 992.036 225.453 766.583 1951 1.276.521 193.903 1.082.618 1961 1.582.534 159.908 1.422.626 1967 1.678.944 136.918 1.542.026
pared to Turin for instance, of working-class neighborhoods. This was highlighted in an article by Nello Finocchiaro in 1957 which sparked off a lively debate36.
From the early 1970s Milan underwent further radical demographic, economic and social changes, starting with a steady decrease in its population. As the third millennium opened Milan’s population even returned to the figures of the second post-war period. There were actually 400.000 fewer inhabitants than in in 1973, when the population peaked at 1.743.451. This reduction was largely due to the transfer of a large number of the inhabitants out towards the border towns where there was a better standard of living and housing was less expensive (Comune di Milano 1985, 27-30).
The demographic plunge would have been even greater were it not for the renewed presence of migrant workers. On this occasion, though, they were foreign citizens, especially immigrants from non-EU countries, but their arrival helped towards a slight recovery from the low-point of 2002, when Milan’s population numbered only 1.247.052. Slow growth took the number of residents up to 1.306.561 by the end of 2009, and came with a change in the make-up of the citi-zenship of the population. In fact, around 220.000 (16%) of Milan’s current popu-lation are foreign-born37.
This profound change in demographics and ethnic diversity has been accompa-nied by an even more significant change on the socio-professional front. This was Fig. 6. Piazza Prealpi zone before the building boom of the 1950s and 1960s
the result of the overwhelming transformation of the local economy into a service provider and the rapid reduction in the number of industrial workers from 392.325 in 1971 to 120.561 in 200138. This revolution was speedy and, apart from affecting its inhabitants, changed the organic structure of the city. In fact, the rapid deindus-trialization process, while terminating tens of thousands of blue collar jobs, led to the redesignation of around seven million square metres of land previously occu-pied by industries of all sizes. It impacted on large firms like Pirelli and Breda in the north area of Milan, and Redaelli-Montedison at Rogoredo, the Binda paper factory, as well as other companies which were smaller but had also been incorpo-rated into the urban fabric (Mocarelli 2011b, 69-71).
The Milan of today is, therefore, radically different from the city of thirty years ago, and not just as far as population and economic structures are concerned. Milan has led the way in the deindustrialization of the Lombardy region, and together with the increase in the availability of motorized transport, this has led to the phenomena of the dispersion and relocation within the territory of both jobs and families. The result has been greatly increased congestion in the urban area. It has upset Milan’s tra-ditional radial centric settlement pattern, which is no longer able to support the load of over 300.000 automobiles entering the city daily (La città di mezzo 2008, 41).
At the same time, the local economy appears to be struggling with a laborious process of re-adaptation and redefinition that sees the activities of local expertise – from exhibition systems to design, from fashion to the media and communications – engaged in tough competition with more dynamic territorial and urban systems. What is more, the work carried out on the approximately five million square metres of ex-industrial areas involved in programs of land recovery and redevelopment have favored housing projects rather than productive activities, particularly those new activities that in the last two decades had established themselves only patchily, Fig. 7. Revitalization plan regarding the area of the ex-paper factory Binda alongside the Naviglio
Pavese.
like leopard spots, in the urban fabric. If, on the one hand, therefore, the econom-ic changes taking place in the city have not been adequately addressed, on the other hand it should be noted that the definite predominance of residential areas is the result of a very real race for home ownership, made possible by the steady increase in incomes. The percentage of home owners in Milan compared to those in rented accommodation has gone from 8% in 1951, to 35% in 1981, to 69% today39. As a consequence of these processes the suburbs are once more changing appearance and seem to be affected by a growing gap between increasingly degraded areas, mostly where the recently arrived immigrants from non-EU countries have settled, and areas where construction on the reclaimed ex-industrial lands has seen the flowering of lofts and luxury homes.
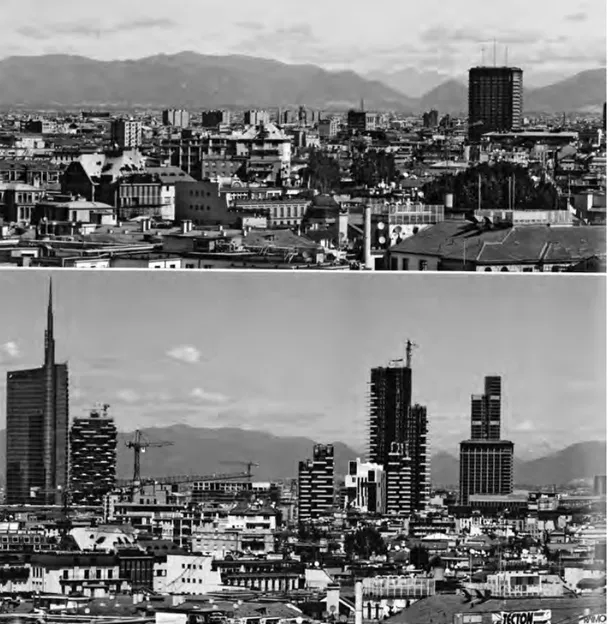
Fig. 8. View of Milan from the Dome, 15 august 2005 and 31 july 2013.
1Compare Faron (1997, 9-12), for the
calculat-ed surface area and layout of the city, with Pillepich (2001, 23-24) for the amount of buildings and population.
2Quoted from Counsellor Gallino speaking at
the meeting of the State Council on January 28 1806, ASMI-1, c. 1372.
3See their memorial of the early 1870s (ASMI-3,
c. 54).
4 From the brotherhood of the Santissima
Trinità in Porta Comasina, holder of 29 cadas-tral lots of houses, with a revenue of 1.499 lire, to Count Vezzoli in Porta Orientale, with 18 lots and 1.257 lire, from the Pecchio brothers in Porta Vercellina, with 17 lots and 632 lire, to the Santissima Trinità school in Porta Ticinese, with 10 lots and 1.302 lire (ASMI-2, c. 2891).
5 Porta Comasina, especially the market
gar-deners’ quarter, was «favoured by the brick-layers and farm labourers who came to work among us for only eight months of the year, returning to the farms for the harvests». Here, too, it was only from the mid nineteenth centu-ry onwards that «the population, having become stable, made it a centre of successful industry» (Romussi 1889, 77-78).
6 According to «Nozione generale dei Corpi
Santi di Porta Comasina con Porta Tenaglia», compiled 31 August 1854 by the census dele-gates Piccardi and Maderna (ASMI-2, c.8603), there were 10.958 inhabitants, while in October 1855 there were 11.879 in those of Porta Ticinese (cf. the documents relative to the preliminary survey, ASMI-2, c. 8614).
7 Their declarations, made between May and
June 1854, are in ASMI-2, c. 8604.
8The 125 reports, 51 concerning the suburb of
San Gottardo, 51 the alzaie (towpaths) of nav-igli, 17 Barona and 6 Ronchetto delle Rane, are in ASMI-2, c. 8615.
9 See the documentation relevant to the
improvements carried out by the owners between 1828 and 1854, and the report on the preliminary survey, made on June 19 1854 (ASMI-2, c. 8608).
10 Regarding the estimated revenue from
dwellings, with reference to 1854, we return to the reports of the preliminary surveys, all in ASMI-2, dated May 20 for Porta Romana (c. 8612); June 19 for Porta Venezia (c. 8608); July 28 for Porta Nuova (c. 8607); August 31 for Porta Garibaldi (c. 8603); October 31 for Porta Magenta (c. 8610) and October 1855 for Porta Ticinese (c. 8614).
11The density of residents in the other Corpi
santi went from 305 inhabitants per sq. km in
Porta Magenta to 1.003 in Porta Romana, with 518 in Porta Venezia and 603 in Porta Nuova. These figures, referring to 1854, are my own calculations, based on population data sup-plied by the above-mentioned reports from the preliminary surveys and taking into account the surface area highlighted in the «Quinternetto per la revisione della calcolazione della superfi-cie dei numeri di mappa del suddetto com-mune» (Quinternetto for revision of the calcu-lation of the surface areas of the map numbers of the above-mentioned commune) (ASMI-2, c. 8614).
12 See the above-mentioned official records of
the preliminary surveys. Between 1848 and 1854 the rents of houses in Porta Ticinese went down 5% because of the damage suffered in the rebellion of 1848 and as a consequence of the building of the railway between Vigevano and Mortara, which had downsized commer-cial activity by reducing the passage of carts and wagons through the San Gottardo district (cf. the above-mentioned report of the prelimi-nary survey of October 1855).
13Again there are significant differences among
the various parts of the outer belt, going from around 8% in Porta Ticinese and Porta Nuova, demonstrating a certain stability in property, up to 17% in Porta Comasina, and 24,5% in Porta Romana. In the Corpi Santi of Porta Romana around 1.798 pertiche out of 7.325 have changed hands, while in Porta Comasina the figure is about 1.950 pertiche out of 11.376. This was taken from the «sommarioni» (sum-maries) which compare the Charles VI version with that of Maria Teresia (ASMI-2, c. 2891).
14The overall total was 1.573 pertiche, 682 of
which were ceded to non-nobles, as can be seen in ASMI-2, c. 2891.
15According to the «Voto ragionato sull’unione
dei Corpi Santi della città di Milano esposto al Consiglio legislativo dal consigliere Carlo Verri» (Argument in favour of the integration of the Corpi santi of the city of Milan present-ed to the Legislative Council by Counsellor Carlo Verri) (ASMI-1, c. 1372), a good workable farm near Milan was worth 17 scudi a pertica, compared to 7-8 scudi for a similar piece of land in a less favourable position.
16So that, in comparison with tenants such as
Federico Vaiano, who rented 1.404 pertiche for 9.920 lire, there were people who paid 110 lire a year for only 8 pertiche and 3 rooms. This was the case of Carlo Antonio Gnocco’s tenant Ambrogio Pioltino, while his brother, Stefano, rented 4 pertiche from the curate of the church
of San Rocco, for 40 lire a year (cf. the declara-tions made by the tenants to census officials on March 20 1724; ASMI-2, c. 3337).
17It seems that what very many of the tenants
in this area had in common was a continual state of being in debt to their landlords, although this did not prevent them from stay-ing there, sometimes even for decades. A cer-tain Melchiorre Allievi managed to run up a debt of 9.000 lire over a period of 40 years, another such case was Antonio Radaelli, whose debt amounted to 3.500 lire over 10 years (ASMI-2, c. 3337).
18According to the census of Carlo VI, most of
the trees were in the Corpi Santi of Porta Comasina, Porta Orientale and Porta Vercellina, where there were respectively 1.531, 1.407 and 1.331. That is over 4.200 trees out of 5.507 (ASMI-2, c. 2258).
19In 1828 there were 39.663 trees in the Corpi
santi, increasing to around 47.000 at the begin-ning of the 1880s, concentrated mainly in the areas of Porta Magenta and Porta Garibaldi, where they numbered respectively 24.454 and 14.739, as against the 20.847 and 12.961 in 1828 (see the «Quaderni dei gelsi» – the quaderni (registry) of the mulberry trees – compiled towards the end of the 1870s, in ASMI-2, cc. 8603, 8607, 8608, 8610, 8612, 8614).
20In 1798 they would have housed 6.257 of the
approx. 17.700 inhabitants attributed to the Corpi Santi (cf. the lists made by the parish priests in the sixth year of the Republic at the request of the census office, in ASMI-1, c. 261).
21The other centere of manufacturing linked to
the presence of the canals was located in the northern part of the city and depended on the Martesana. In this area, however, it was not until later that they made use of the difference of water levels for milling and industry, partic-ularly inside the city walls (Rota 1932, 50).
22 According to surveys entrusted to the old
people in the various districts in 1714, and which have come down to us, regarding the area of the Corpi Santi of Porta Ticinese and Porta Orientale, in the area of San Gottardo outside the walls alone, there were 18 laun-dries, 12 mills, 8 taverns, 3 furnaces, 2 mills for the making of felt, as well as 126 shops (cf. report made by senior citizen Giuseppe Reina dated January 31 1714, in ASMI-1, c. 142).
23This pre-eminence is also shown in the
suc-cessive Theresian cadastral survey, which states that the most important group of installations was to be found in Porta Ticinese (see the sur-vey carried out on March 27 1752 and others,
by the collegiate engineer Cesare Quarantini, in ASMI-2, c. 1848). A later survey in 1797, in ASCMI-1, c.139, shows instead the presence in the Corpi Santi of 16 mills and 3 «folle» (for the making of felt), but this should be taken as biased.
24According to that year’s survey (ASMI-4, c. 4),
there were 278 looms within the walls, whilst in the Corpi santi there were 97, half of which were in the San Gottardo district.
25 Employees within the city walls numbered
11,897, whilst in the Corpi Santi there were only 12 large factories, and half of the workers recorded there were working in the Cavalli cot-ton-printing plant (Bigatti 2000, 181-182).
26 See «Identificazione dei fabbricati urbani»
(Identification of urban buildings), compiled August 21 1879 (ASMI-2, c. 8607).
27All built after 1854 (see «Identificazione dei
fabbricati urbani» of September 10 1879, ASMI-2, c. 8608).
28Data from «Anno 1855, Provincia di Milano.
Distretto primo di Milano. Comune censuario di Porta Ticinese con Porta Lodovica» (Year 1855, Province of Milan. First district of Milan. Census municipality of Porta Ticinese with Porta Lodovica). Private notes of evaluating engineer Angelo Fraschi (ASMI-2, c. 8614).
29 See «Identificazione dei fabbricati urbani»,
in 1880 (ASMI-2, c. 8614). Of particular impor-tance were the installations of Carlo Binda on one side – 3 paper-mills, including a large one, situated at the “conca fallata” – and on the other side the Richard ceramics works, which included a large factory at San Cristoforo, with 136 rooms and an earth-grinding mill.
30 Cf. the list of buildings in 1856 (ASMI-2, c.
8606), with the «Identificazione dei fabbricati urbani» of 1880 (ASMI-2, c. 8603). An example of a long tradition of activity here is the plant for silk-reeeling, because already in the mid 18th
century the Corpi santi of Porta Comasina had a mill with 31 stoves producing Piedmontese silk, the property of Carlo Piatti (see recorded in the cadastral survey of 1751, ASMI-2, c. 1848).
31See «Identificazione dei fabbricati urbani» of
February 12 1880 (ASMI-2, c. 8610). It is inter-esting to note that among the three brick-kilns there was one with 8 openings, constructed in accordance with the latest criteria by Evers Bra-mati & Co. after 1854.
32There were four flour-mills in addition to the
cotton-mill of Gabriele Ferrario (see «Identifi-cazione dei fabbricati urbani» dated February 16 1880 (ASMI-2, c. 8612).
the productive units with fewer than 10 workers and 44% of those with from 10 to 25 employees, but only 30% of those with more than 25 employees, by now concentrated in the outer ring (my calculations based on the data supplied by Bigatti 2000, 184 using the preparatory work for the compiling of the 1911 industrial census).
34While in the centre numerous building
pro-jects, such as bank head offices and the new Stock exchange, were carried out, reinforcing the city’s tertiary vocation, the number of inhab-itants there continued to decrease, as clearly shown in table 5.
35 In this area the population increased from
18.283 inhabitants in 1931 to 161.387 in 1967 (Buzzi Donato, 93).
36 Finocchiaro (1957). Numerous publications
from those years have insisted that the tertiary status of Milan was due not to its loss of impor-tance as a centre of production, but rather to the structural transformation which industry itself was undergoing with the increasing importance of non-manual workers (Aquarone 1961, 199 onwards).
37 These figures and other information on
Milan during the last ten years are from La città
di mezzo 2008.
38Regarding this, compare Martini (2002,
131-145) with Comune di Milano (2003, 195-204).
39 Milan has been moving progressively closer
to the national average, particularly since the Seventies, seeing that home ownership in Italy increased from 59% in 1980 to 70% in 2002 (Pozzo 2003, 8).
Archival References
ASMI Milan, State Archive
ASCMI Milan, Historical Municipal Archive ASMI-1: ASMI, Censo, parte moderna. ASMI-2: ASMI, Catasto.
ASMI-3: ASMI, Comune.
ASMI-4: ASMI, Commercio, parte antica. ASCMI-1: ASCMI, Località milanesi.
Bibliography
S. Allocchio 1884, La nuova Milano, Hoepli, Milano.
A. Aquarone 1961, Grandi città e aree
metropo-litane in Italia, Zanichelli, Bologna.
M.P. Belski, S. Montruccoli 2002, Milano da
posta per cavalli a città regione, Marna,
Lecco.
G. Bigatti 2000, La città operosa. Milano
nell’Ottocento, Angeli, Milano.
A. Buzzi Donato 1969, Note sullo sviluppo di
Milano negli ultimi cento anni, Servizio
stati-stica del Comune di Milano, Milano (Quaderni di documentazione e di studio, I). C. Carozzi 1976, Milano, in Storia d’Italia, vol.
VI, Atlante, Einaudi, Torino, 244-261. C. Cattaneo 1956, Sui dazj suburbani di Milano,
in Id., Scritti economici, a cura di A.
Bertolino, Le Monnier, Firenze, vol. III, 418-439.
La città di mezzo 2008, La città di mezzo, una
ricerca di Assimpredil-Ance a cura di M. Abis, A. Airoldi, G. Goggi, G. Lisciandra, «Dedalo», 7, 25-104.
A. Cogné 2009, Distribuzione della proprietà a
Milano a metà Settecento: la realizzazione di un GIS a partire dal catasto teresiano (1758), in G. Alfani, M. Barbot (a cura di), Ricchezza, valore, proprietà in età preindu-striale. 1400-1850, Marsilio, Venezia,
101-125.
Comune di Milano 1975, Struttura demografica
e residenziale di Milano nei dati dell’XI Censimento generale della popolazione,
Servizio statistica del Comune di Milano, Milano (Quaderni di documentazione e di studio, V).
Comune di Milano 1985, La transizione
demo-grafica e sociale degli anni Settanta. Dal cen-simento del 1971 al cencen-simento del 1981,
Servizio statistica del Comune di Milano, Milano (Quaderni di documentazione e studio, 12).
Comune di Milano 2003, 2002-2003 Milano
statistica, Comune di Milano. Settore
stati-stica, Milano.
F. Dal Co 2013, Milano al tempo della caduta
del saggio di profitto, «Casabella», n. 831,
LXXVII, 2, 6-11.
F. Della Peruta 1987, Milano lavoro e fabbrica,
1815-1914, Angeli, Milano.
G. Denti, A. Mauri 2000, Milano. L’ambiente, il
territorio, la città, Alinea Editrice, Firenze.
O. Faron 1997, La ville des destins croisés.
Recherches sur la société milanaise du XIXe
siècle, École française de Rome, Rome.
N. Finocchiaro 1957, La città operaia, «Il Mondo», IX, 15, 9 aprile, 1-2.
E. Greppi 1881, Saggio sulle condizioni
econo-miche del Milanese verso il 1780, «Annali di
Statistica», s. II, vol. 19, 57-131.
I. Lauterbach 1996, The Gardens of the
Milanese villeggiatura in the Mid-Sixteenth Century, in J.D. Hunt (edited by), The ital-ian garden. Art, design and culture,
Cambridge University Press, Cambridge, 127-159.
M. Martini 2002, I mutamenti strutturali del
sistema produttivo a Milano e alla Bicocca,
in La nascita di una università nuova:
Milano-Bicocca. Dal lavoro di fabbrica alla fabbrica del sapere, Skira, Ginevra-Milano,
131-145.
L. Mocarelli 2001, Una realtà produttiva urbana
nel secolo dei lumi. Milano città atelier,
Cooperativa libraria universitaria bres-ciana, Brescia.
L. Mocarelli 2006, I Corpi santi di Milano tra
XVIII e XIX secolo: trasformazioni istituzio-nali e assetti economici, «Società e Storia»,
n. 112, XXIX, 2, 285-295.
L. Mocarelli 2011a, La ricostruzione edilizia a
Milano tra intervento pubblico e privato (1945-1953), in A. Cova, G. Fumi (a cura
di), L’intervento dello Stato nell’economia
italiana. Continuità e cambiamenti (1922-1956), Angeli, Milano, 515-546.
L. Mocarelli 2011b, Le aree dismesse milanesi o
della cancellazione del patrimonio industria-le: il caso della Bicocca, in «Patrimonio
indu-striale, 5, 69-75.
A. Pillepich 2001, Milan capital napoléonienne
1800-1814, Lettrage, Paris.
La popolazione milanese 1883, La popolazione milanese. Relazione della Giunta Provinciale per la statistica, Comune di Milano, Milano.
A.M. Pozzo 2003, I numeri della casa, Federcasa, Roma.
M. Punzo 1977, Il problema dell’allargamento
della cinta daziaria a Milano (1860-1898): un contrasto tra «destra» e «sinistra», in
«Amministrare», 1-2, 117-149.
P. Puricelli 1859, Un bisogno ed un voto, «Gazzetta ufficiale di Milano», 21 gennaio. C. Ranzini 1972, 1873: Milano si espande,
Comune di Milano, Milano.
C. Romussi 1889, Milano che sfugge, Meravigli, Milano (last edition 2003, Libreria milane-se, Milano).
C.M. Rota 1932, Memorie storiche di Greco
Summary The Long-Term Evolution of the Suburbs of Milan
The paper deals with the economic and demographic evolution of the suburbs of Milan in the long run (18thto 20thcenturies). The starting point is the early modern period when, outside the walls
of Milan, slowly has grown a reality, the so called Corpi santi, with its institutional, demographic and economic specificity. In the second half of the 19thcentury the Corpi santi were absorbed by
the city and progressively lost their agricultural predominance, becoming a key area for the indus-trial espansion of Milan, especially on north western and south eastern sides. In the 20thcentury
the growth of Milan encompassed other suburbs, that previous were still autonomous, and then, after the second world war, the suburbs were interested by an extraordinary growth thanks to the migration flows towards Milan in the decades of the Italian economic miracle. In this period the suburbs have changed once again, with the predominance of dwelling places, while industrial set-tlements lost rapidly their importance. At present days the situation seems rich of contradictions since in the suburbs coexist degraded settlements, like parisienne banlieu, and luxury dwelling places built on disused industrial area.
Riassunto L’evoluzione delle periferie di Milano nel lungo periodo
Il contributo indaga l’evoluzione socio-economica della periferia milanese tra età moderna e con-temporanea. L’analisi prende le mosse dal XVIII secolo quando, al di fuori delle mura cittadine, ha iniziato a crescere una realtà, i Corpi santi, con proprie prerogative e specificità demografiche, economiche e istituzionali. Nella seconda metà del XIX secolo i Corpi santi hanno perso la loro autonomia e sono stati uniti alla città perdendo al tempo stesso la loro tradizionale vocazione agri-cola e diventando un’importante area di insediamenti industriali soprattutto nelle porzioni nord-occidentali e sud-orientali. Nel XX secolo l’espansione di Milano è proseguita, assorbendo altri comuni sino a quel momento autonomi, facendo registrare una straordinaria espansione delle peri-ferie nei decenni del miracolo economico in seguito ai rilevantissimi flussi migratori diretti verso la città. In questo periodo si è assistito al progressivo prevalere degli insediamenti abitativi mentre le aree industriali hanno perso terreno sempre più terreno fin ad arrivare alla situazione odierna che appare ricca di contraddizioni perché nelle periferie milanesi convivono quartieri degradati al pari delle banlieue parigine e insediamenti di lusso costruiti sulle aree industriali dismesse.
Parole chiave
Milano; Periferie; Secoli XVIII-XX; Storia economica e sociale; Aree industriali dismesse.
Keywords