LEVELS, SPATIAL DIFFUSION AND TEMPORAL EVOLUTION OF PERSISTENT
ORGANIC POLLUTANTS IN THE AMBIENT AIR OF TARANTO
Esposito V1*, Maffei A1, Bruno D1, Gigante L1, Ficocelli S1, Mantovan M1, Rosito V1, Giua R2, Assennato G2
1ARPA Puglia - Dipartimento di Taranto, Via Anfiteatro 8, 74100 Taranto, Italy 2ARPA Puglia, C.so Trieste, 70126 Bari
Introduction
The Taranto area (Southern Italy) hosts several industrial facilities including thermal/combustion processes1 with remarkably high raw materials and high energy demand and known potential sources of PCDD/Fs and PCBs release to air, land, and water.2 These facilities include a large integrated steel plant, a medium-sized oil refinery, a large cement-works, two power plants, and three waste incinerators as well as a large naval base with military shipyards. Taranto is a relatively large southern Italian city, the capital of the Province of Taranto and an important commercial port, with a population of over two-hundred thousand inhabitants.
The magnitude of the environmental pressure on the Taranto area is known to some extent, in particular for what concerns urban air quality,3 emissions to air,4 releases to water.56
The present paper presents the results of a four-year study aimed at assessing the levels, spatial diffusion and temporal evolution of PCDD/Fs, PCBs and PAHs congener concentrations in the ambient air of Taranto.
Materials and methods
Sampling: Sampling was performed according to Method EN 15549 using 47mm diameter quartz filter membranes (Whatman Grade QMA) and a FAI SWAM 5a Monitor low-volume sampler working at 2.3 m3/h in compliance with EN 1234-1. A number of daily PM10 samples corresponding to about 33% of samples collected over one month were randomly selected and pooled to form a single monthly sample.
Analyses: Extraction was performed by Pressurized Fluid Extraction according to method EPA 3545a while clean-up of extract was performed using a Power-Prep system (Fluid Management System, Waltham, Massachusetts). Isotope-dilution mass-spectrometry determinations were carried out according to Method EPA 1613 for PCDD/Fs, Method EPA 1668 for dioxin-like PCBs (dl-PCBs) and EN 15549 for PAHs on a DFS High Resolution GC/MS system (Thermo Fisher, Bremen, Germany). For each batch of six samples a laboratory blank and a control sample were analysed. PCDD/Fs were separated by high resolution gas chromatography (HRGC) on a DB-5 MS capillary column (60 m x 0.25 mm, 0.25 µm film thickness, J&W Scientific, California) and determined by high resolution mass spectrometry (HRMS), at a resolution of 10000 operating with electron ionisation (EI) at 45 eV in the selected ion monitoring (SIM) mode. PAHs and dl-PCBs were separated by HRGC on a DB-5 MS capillary column (30 m x 0.25 mm, 0.25 µm film thickness, J&W Scientific, California) and determined by HRMS, in the same operating conditions used for PCDD/Fs.
Toxic equivalent (TEQ) values were calculated using NATO Toxic Equivalency Factors (I-TEFs) for compliance with Italian regulations for emissions to air. I-TEQs were expressed as lower bound concentrations. Toxic equivalent values for PCBs were calculated using the World Health Organization Toxic Equivalency Factors (WHO-TEFs 1998). WHO-TEQs were expressed as lower bound concentrations.
Results and discussion
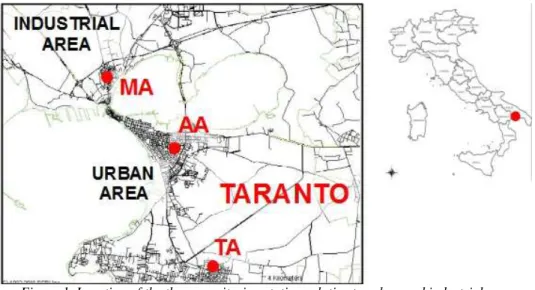
The location of the three monitoring stations MA (urban-industrial), AA (Urban), and TA (urban-background) is shown in Figure 1 while results in terms of annual averages are shown in Table 1.
Figure 1. Location of the three monitoring station relative to urban and industrial area
station year BaP PCB tot PCB-DL PCDD/F
ng/m3 fg/m3 fg WHO-TE/m3 fg I-TE/m3 MA 2008 1,15 57271 3,77 44,83 Urban-industrial 2009 1,39 34724 1,49 39,51 2010 1,82 47279 1,63 25,56 2011 1,13 29143 1,41 23,59 2012 0,76 24964 0,74 24,59 2013 0,17 6369 0,31 11,59 AA 2008 0,44 47100 1,61 14,80 urban 2009 0,39 16938 0,87 21,94 2010 0,30 9602 0,51 12,32 2011 0,31 14617 0,59 18,11 2012 0,24 10396 0,65 15,89 2013 0,16 8269 0,17 10,27 TA 2008 0,39 38333 1,55 30,40 Urban-background 2009 0,38 25503 0,86 24,40 2010 0,31 14074 0,59 13,39 2011 0,32 13771 0,63 21,19 2012 0,23 13520 0,35 18,45 2013 0,23 6513 0,19 6,43
Table 1. POPs annual averages. BaP = Benzo(a)pyrene, PCB-DL = dioxin-like PCBs, PCB tot = sum mono- to deca-CB.
During four consecutive years (2008-2011) BaP annual average for MA station were above the EU air quality standard set at 1 ng/m3 on a yearly basis, before decreasing to 0,76 and 0,17 ng/m3 for years 2012-2013. No air quality standard exists for the concentration of PCDD/Fs and PCBs in particulate matter since direct inhalation exposures constitute a small proportion of the daily intake that is predominantly (95%) represented by food consumption.
A detailed view of the monthly concentrations is presented in Figure 2 were concentrations are shown as moving averages (basis 12) to emphasize the temporal variations. It is shown how POPs levels have decreased over time, mostly for PCDD/Fs and PCBs, following enforcement of emission reduction by local Authorities.7
Figure 2. POPs annual moving averages (trend) for sites MA, AA, TA. Data are updated monthly. Evidence of proximity to pollution sources is gained for the MA monitoring station given both the less pronounced seasonality, compared to AA and TA, and the contrasting trend of different pollutant groups, where PCDD/F show a general steady decrease while PAHs reached the maximum concentrations in 2010 for just one monitoring station (MA urban-industrial).
Industrial sources appear to be a major contributor to PAH pollution for MA compared to civil sources like traffic or domestic heating observed for AA and TA. In fact, while experiencing the impact of a comparable amount of road traffic, the MA station, where civil and industrial sources mix, has markedly different temporal evolution compared to AA and TA.
References: References:
1 Esposito V, Maffei A, Castellano G, Conversano M, Martinelli W, Assennato G. (2010); Organohalogen compounds 72: 736
2 Fiedler H. (1996); Chemosphere 32(1): 55
3 Amodio M, Caselli M., de Gennaro G., Tutino, M. 2009, Particulate PAHs in two urban areas of Southern Italy: Impact of the sources, meteorological and background conditions on air quality, Environmental Research, 109, 7, 812
4 Cangialosi F., Intini G., Liberti L., Notarnicola M., Stellacci P. 2008, Health risk assessment of air emissions from a municipal solid waste incineration plant – A case study, Waste Management, 28, 5, 885.
5 Buccolieri A., Buccolieri G., Cardellicchio N., Dell'Atti A., Di Leo A., Maci A. 2006, Heavy metals in marine sediments of Taranto Gulf (Ionian Sea, Southern Italy), Marine Chemistry, 99, 1-4, 227.
6 Cardellicchio N., Buccolieri A., Giandomenico S., Lopez L., Pizzulli F., Spada L. 2007, Organic pollutants (PAHs, PCBs) in sediments from the Mar Piccolo in Taranto (Ionian Sea, Southern Italy), Marine Pollution Bullettin, 55, 10-12, 451.
7 Esposito V, Maffei A, Bruno D, Gigante L, Ficocelli S, Capoccia C, Spartera M, Giua R, Blonda M, Assennato G 2013, Pops Emissions From A Large Sinter Plant In Southern Italy Over A Five-Years Period Following Enforcement Of New Legislation; Organohalogen Compunds, 75:857
20090 2010 2011 2012 2013 2014 0,5 1 1,5 2 2,5 Benzo(a)pirene trend
Site 1 (MA, urban-industrial) Site 2 (AA, urban) Site 3 (TA, urban-background)
Ba P n g /m 3 20090 2010 2011 2012 2013 2014 10 20 30 40 50 60 PCDD/F trend
Site 1 (MA, urban-industrial) Site 2 (AA, urban)
B a P n g /m 3 20090 2010 2011 2012 2013 2014 0,5 1 1,5 2 2,5 3 3,5 4 Dioxin-like PCB trend
Site 1 (MA, urban-industrial) Site 2 (AA, urban) Site 3 (TA, urban-background)
B a P n g /m 3