List of contents
1. INTRODUCTION ... 3
2. FACILITY DESCRIPTION ... 5
THE TEST SECTION VESSEL S100 ... 5
HEATERS ... 7 THERMOCOUPLES ... 8 DRAINING LINE ... 8 S200 STORAGE TANK ... 8 3. EXPERIMENTAL TEST-MATRIX ... 10 4. CFD MODEL ... 12 5. PRE-TEST ANALYSIS ... 13 6. CONCLUSIONS ... 17 7. REFERENCES ... 18
1. INTRODUCTION
The HLM facility SOLIDX (SOLIDification eXperiment) was designed to collect the first experimental data on Lead freezing for the GEN-IV nuclear systems.
The facility contains Lead as working fluid, and typically will operate close to the freezing temperature of 330 °C to study the freezing/melting phenomena from a thermo-fluid dynamic point of view.
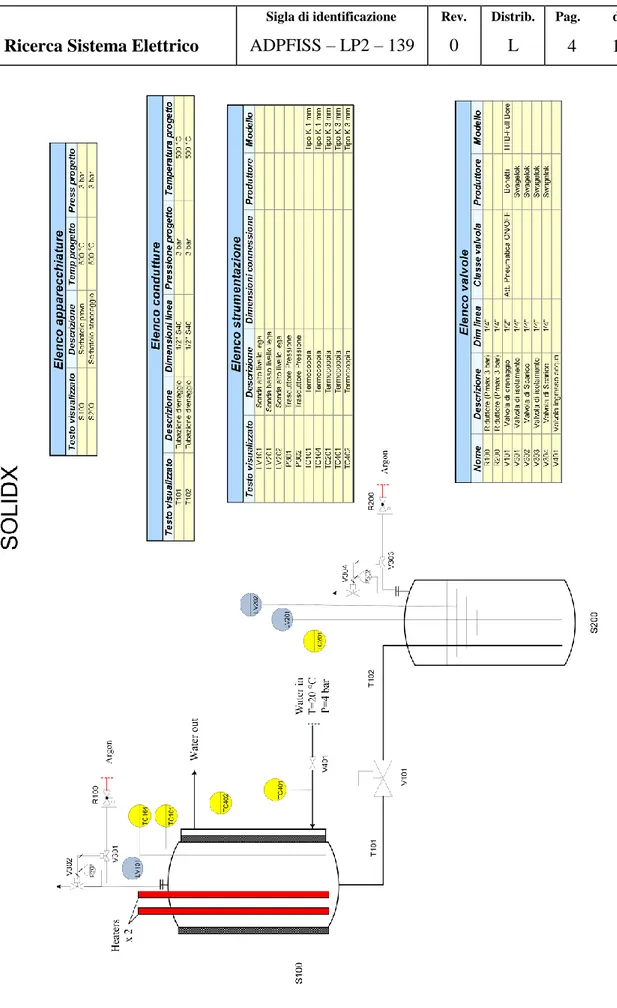
The SOLIDX facility conceptual design was carried out according to the P&ID shown in
Figure 1. The main components and systems of the facility are:
1) The experimental vessel S100 with all the instrumentation (main process to be investigated);
2) The fill and drain system: a. Fill & drain line b. V101 valve
c. The storage tank S200
3) The auxiliary gas system to ensure a proper cover gas and to perform fill&drain operation
4) The water line to cool S100 and to ensure the thermal equilibrium in the experiment
The facility will be installed and operated at the ENEA Brasimone R.C..
The facility was procured and it will be installed at the ENEA Brasimone R.C.. In order to have a reasonable experimental test matrix a numerical model of the whole primary vessel was made and a pre-test analysis was carried out to provide correct conditions for freezing.
The SOLIDX facility is made by two small vessels S100 and S200 with a fill&drain line and a valve. The whole facility is manufactured with austenitic steel AISI304.
2. FACILITY DESCRIPTION
THE TEST SECTION VESSEL S100
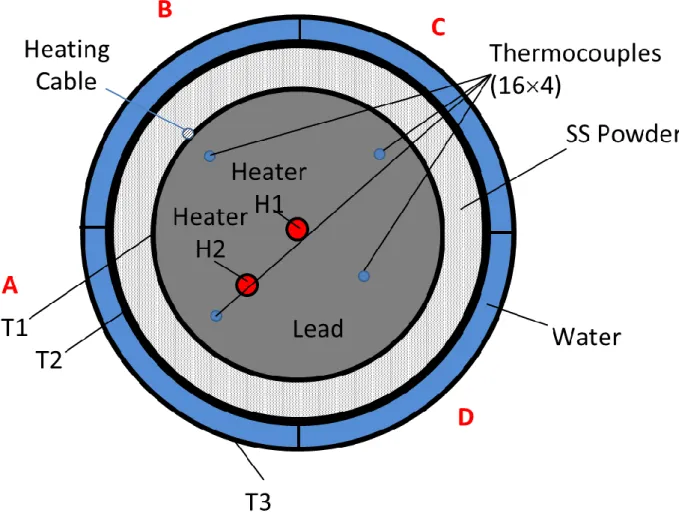
The test vessel S100 is the test section of the facility. S100 where Lead will be frozen during the experimental tests. A transversal top-view section of S100 is reported in Errore. L'origine riferimento non è stata trovata..
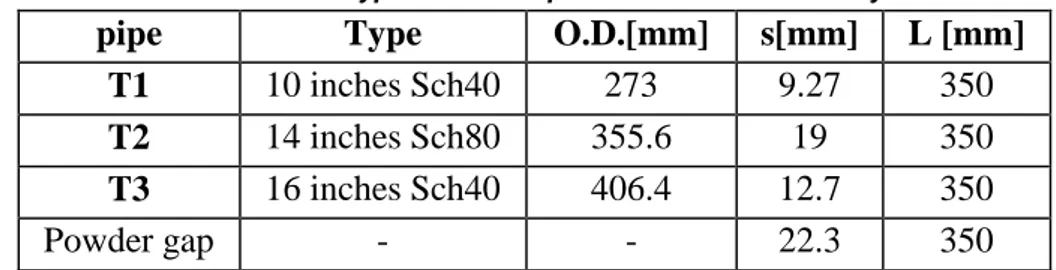
The test section is made of three concentric commercial pipes T1, T2, T3 described in Table 1. The dimension of the pipes, and in particular the thickness of the powder gap was designed by a proper thermo-fluid dynamic analysis by using powder conductivity data coming from the TxP experiment (Rozzia et al., 2015).
The total height of the pipes is 350 mm, with a liquid lead level at 290 mm from the bottom. A 10 inches flange ANSIB16.5 WN 330 lb will close the test section. In the blind flange lots of penetrations are manufactured to located the heating elements and the instrumentation. The facility can dismounted and re-assembled in order to operate for maintenance and upgrade.
Table 1 Tube types to be adopted in the SOLIDX facility.
pipe Type O.D.[mm] s[mm] L [mm]
T1 10 inches Sch40 273 9.27 350
T2 14 inches Sch80 355.6 19 350
T3 16 inches Sch40 406.4 12.7 350
Powder gap - - 22.3 350
The pipe T1 will contain the liquid lead for the tests, while the gap between T1 and T2 (22 mm) will be filled with stainless steel powder to control heat transfer. The gap between T2 and T3 is divided in 4 sectors and it will be filled with flowing water to cool the system. The 4 sectors are named A, B, C, D as shown in the figure. This system will ensure the possibility of asymmetric cooling; keeping into account that one of the heaters is also asymmetric, several different kind of experiments can be carried out.
The gap dimensions and the system thermo-fluid dynamic process was designed by conjugate heat transfer CFD simulations, while the thermal properties of the SS powder are derived by the experimental campaign in the TXP facility. A 1 kW heating cable will be located in T1 external wall to heat up the facility during the pre-heating.
A draining line will connect the test section S100 to the drain vessel S200. The design parameters of S100 are the following:
Design temperature: 500 °C Operating temperature: 400 °C
Working fluid: Lead Design pressure: 1,50 bar Operating pressure: 1,45 bar Cover gas: Argon
Cover gas overpressure: 50 mbar Total volume: 20 liters
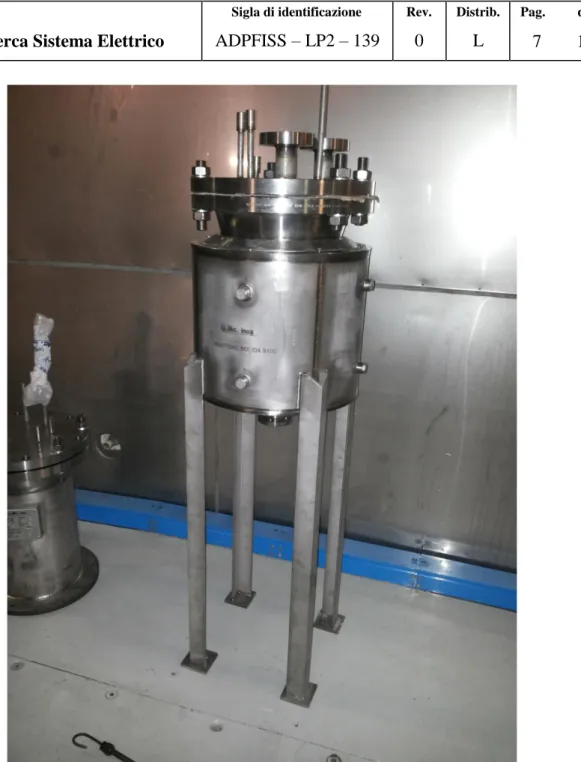
A picture of the test section vessel S100 is reported in Figure 3.
Figure 3 Picture of the SOLIDX test section vessel S100.
HEATERS
The heaters to be inserted in the test section S100 are of great importance for the experiment.
The heating elements will be placed in the following positions: Element H1 in symmetric central position;
Element H2 in asymmetric position at the middle of the radius, i.e. 63 mm from the center in the sector A;
The heating elements features are reported in Table 2. Swagelok connectors will ensure the
sealing in the cover gas.
The asymmetry of H2 element allow a flow stabilization due to the strong asymmetric buoyant force and will avoid flow and temperature oscillations. The power of the heating
elements was decided after some CFD calculations reported in Section 4. Practically with H2 at full power, lead is completely liquid; first solidification phenomena starts for powers below 2000 W.
Table 2 Electric and geometrical features of the heaters.
Active length 250 mm
Power 2500 W
Diameter 20 mm
THERMOCOUPLES
The thermocouples will be 1 mm OD of ‘K’ type and will be placed along 4 tubes at 16 different vertical levels from the bottom of S100, see Errore. L'origine riferimento non è stata trovata.. The radial position of the 4 support tubes is ¾ of the radius (95.4 mm) and ½ of the radius (63.6 mm) from the center.
DRAINING LINE
The draining line is manufactured with AISI304 1/2" S40 pipes with a manual valve. The line has the following design data:
Design temperature: 500 °C Working temperature: 400 °C Working fluid: Lead
Design pressure: 3 bar Working pressure: 1,5 bar
S200 STORAGE TANK
The storage tank S200 is closed by a blind flange with to allocate all the instrumentation and in-out gas line
S200 was designed according to the following data:
Design temperature: 500 °C Operating temperature: 400 °C Working fluid: Lead
Design pressure: 3 bar Operating pressure: 2 bar Cover gas: Argon
Cover gas gauge overpressure: 100 mbarg-2 barg Total volume: 20 liters
3. EXPERIMENTAL TEST-MATRIX
The specific design of the facility allows asymmetric tests for the presence of the Heater H2 and the chance to cool separately the four sectors. From a preliminary heat transfer analysis, it is clear that the heat transfer in the facility is dominated by the thermal resistance of the powder in the gap with a typical time constant of 30 min. Therefore the exact flow rate of the cooling water is not important provided that the flow rate is sufficiently high. From a modelling point of view, the heat transfer condition on the water side can be represented by a constant heat transfer coefficient with a water temperature of 20°C.
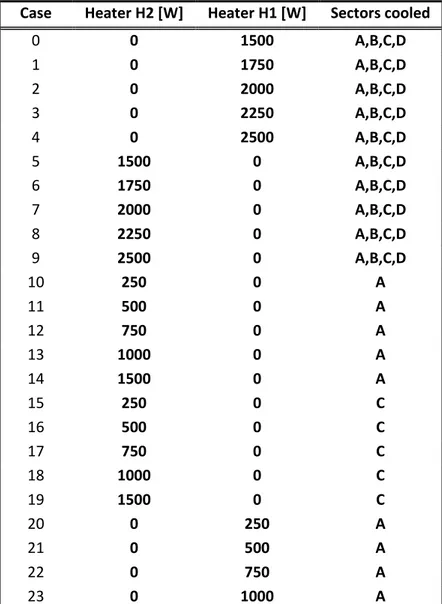
A first experimental test matrix was designed in order to explore the behavior of the facility and to collect the first series of data. The test matrix is reported in Table 3. The asymmetric configurations are more investigated in order to provide a clear direction to the buoyant flow path.
Table 3 Experimental test matrix for the first series of tests
Case Heater H2 [W] Heater H1 [W] Sectors cooled
0 0 1500 A,B,C,D 1 0 1750 A,B,C,D 2 0 2000 A,B,C,D 3 0 2250 A,B,C,D 4 0 2500 A,B,C,D 5 1500 0 A,B,C,D 6 1750 0 A,B,C,D 7 2000 0 A,B,C,D 8 2250 0 A,B,C,D 9 2500 0 A,B,C,D 10 250 0 A 11 500 0 A 12 750 0 A 13 1000 0 A 14 1500 0 A 15 250 0 C 16 500 0 C 17 750 0 C 18 1000 0 C 19 1500 0 C 20 0 250 A 21 0 500 A 22 0 750 A 23 0 1000 A
After an appropriate analysis of the experimental data set of this first test series, a second test matrix will be designed in different conditions.
4. CFD MODEL
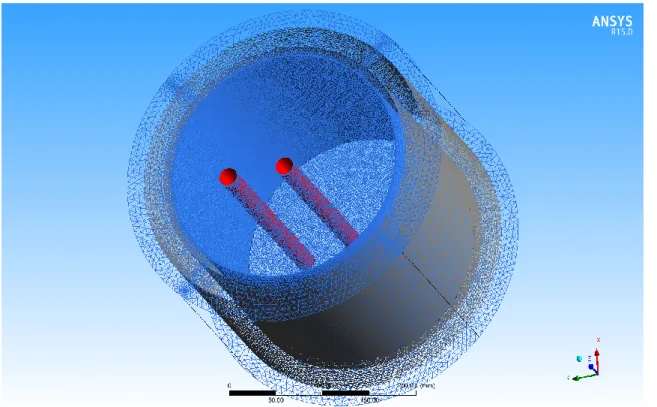
For the pre-test analysis a proper CFD model of the test section vessel S100 was carried out. An illustrative picture of the model is represented in Figure 4. The 2 pipes T1, T2 and the powder gap were correctly described and a 360° model was built in order to capture 3-D effects and to allow the simulation of asymmetric conditions. The electric rods are represented in red, while a free-slip condition was imposed at the lead free surface. On the cylindrical and bottom walls a no-slip condition was imposed. On the cylindrical external wall of the T2 pipe, the water flow condition was simulated by a constant heat transfer coefficient with a water temperature of 20 °C. The computational mesh adopts tetrahedral elements and inflation on the no-slip walls and on the heaters walls with the full resolution of the viscous sub-layer. The total number of nodes is 3.5 MNodes, 16.8 Melem.
The flow is governed by buoyancy and conduction in the solid structure is fully kept into account. The k-epsilon model was adopted for all the simulations.
To keep into account of the solidification a drag source term in the momentum equation is added in the form Su CTu for each velocity component. The coefficient CT is set to 105
below the solidification temperature. The drag force is sufficient to inhibit fluid motion in the solidified regions and the solidification front is so described.
5. PRE-TEST ANALYSIS
The pre-test analysis of few cases was performed to assess that the experimental conditions were fixed correctly.
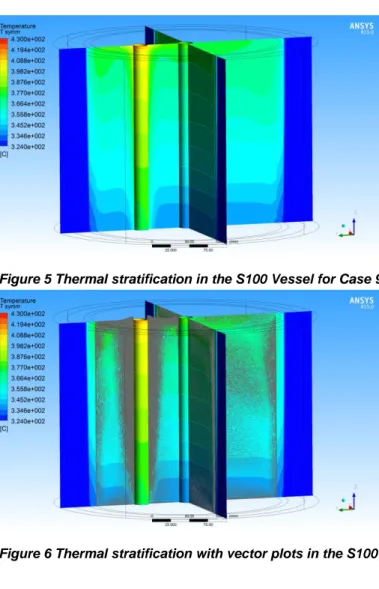
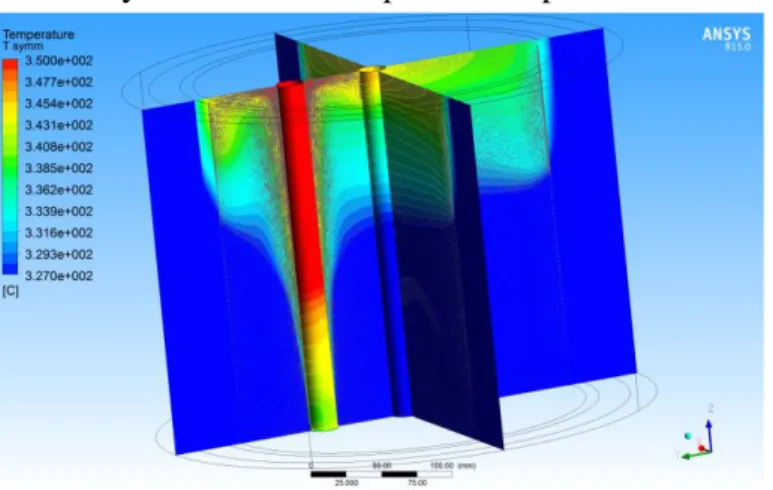
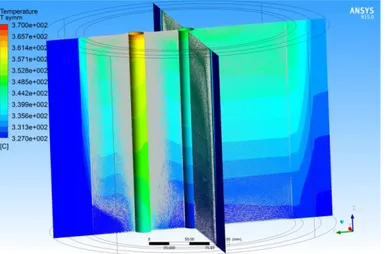
First of all, Case 9 of Table 3 was simulated with full power (2500 W) on the asymmetric positioned heating rod H2 and all the sectors cooled. The computational model converged very well with residuals below 10-6 for all quantities. At regime, a buoyant flow is established with a vertical thermal stratification, see Figure 5 and Figure 6. The heat produced by the rod is transported through the solid structures and the gap and kept by the flowing water. This is visible in Figure 7 where the temperature distribution in the solid structures and the powder gap is reported.
Figure 5 Thermal stratification in the S100 Vessel for Case 9.
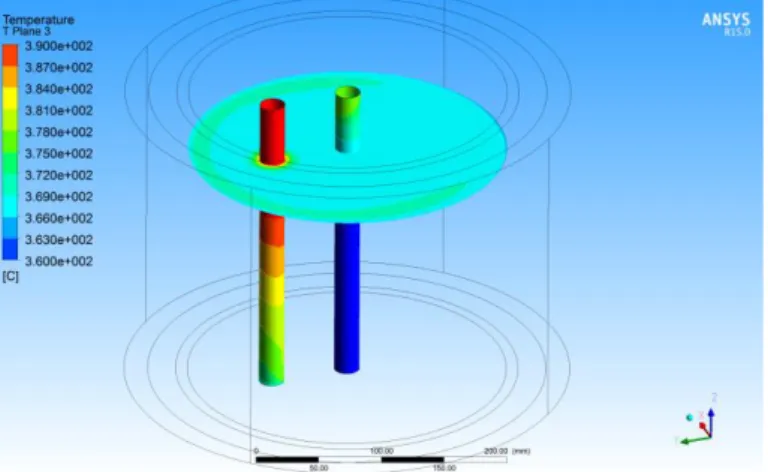
Figure 7 Temperature distribution in the solid structures for Case 9.
Figure 8 shows the vertical velocity contours in two different horizontal planes with ascending flow around the heated rod and descending flow along the vessel walls.
Figure 8 Vertical velocity contours in two different horizontal planes.
Figure 9 shows the temperature distribution in the heating rods and in an horizontal plane. The thermal stratification is also visible in heating rods temperature contours.
From this simulation, it can be deduced that for Case 9 (2500 W, H1, all sectors cooled) lead remains completely liquid and a vertical stratification occurs. Solidification will occur by decreasing power in Cases 8, 7, 6, 5 and the solid part will be in bottom part of the vessel. The solidification front will be positioned at a higher level going from case 8 to 5.
In case 7, the power in H2 is reduced to 2000 W and the heat is removed by all the sectors as in case 9. The result in terms of temperature distribution with superimposed vector plot is shown in Figure 10. There is a convective cell localized in the upper part of the vessel with a thermal stratification that is basically vertical. The half bottom part of the vessel is solidified with temperatures below 327 °C, apart from a small region around the heating rod. The flow rise up along the heated rod and goes down along the vessel walls in the upper part. The flow field is symmetric with respect to the plane of the rods as visible in Figure 11.
Figure 10 Thermal stratification with vector plots in the S100 Vessel for Case 7.
Figure 11 Vertical velocity contours in horizontal planes for case 7.
As example, case 13 with asymmetric heating (1000 W in H2) and cooling (sector A) was investigated by numerical analysis. Figure 12 shoes the thermal stratification with superimposed vector plots in some diameter planes. The solidification front is clearly visible on the bottom side of sector A where the fluid is cooled. In the other sectors, due to the mixing, solidification does not occur in these conditions. By reducing power below 1000 W in cases 12, 11, 10 the solidification front will extend to all the sectors.
To have an idea of the complex flow occurring in the asymmetric cases, Figure 13 shows the 3D streamlines in the cavity.
Figure 12 Thermal stratification with vector plots in the S100 Vessel for Case 13.
6. CONCLUSIONS
The test matrix and the numerical pre-test analysis in the SOLIDX facility is presented. The facility SOLIDX was commissioned to start investigation on the solidification of heavy liquid metals. The facility was procured and it will be installed at the ENEA Brasimone R.C.. In order to have a reasonable experimental test matrix a numerical model of the whole primary vessel was made and a pre-test analysis was carried out to provide correct conditions for freezing. The presence of 2 different heating rods, one of them in asymmetric position, and 4 sectors for cooling allow to investigate a wide range of situations. A test matrix was provided and it includes several combinations of symmetric/asymmetric heating and cooling conditions.
The numerical CFD model of the main vessel S100 was presented. The numerical model can compute and evaluate all the situations including solidification phenomena through proper drag forces.
Results showed that with 2500 W in the asymmetric rod H2 and the four sectors for cooling, the lead is completely liquid. By decreasing power to 2000 W a vertical stratification with solidification appear in the bottom half of the vessel.
As example, an asymmetric cooling test is also simulated.
With these basis, experimental tests can be done and results can be compared with post-test CFD analysis.
7. REFERENCES
D. Rozzia, G. Fasano, I. Di Piazza, M. Tarantino, , “Experimental Investigation on Powder Conductivity for the Application to Double Wall Heat Exchanger (NACIE-UP)”, Journal of Nuclear Engineering and Design, vol.283, pp. 100-113, 2015.