Potential use of reservoirs for mitigating saline
intrusion in the coastal areas of Red river delta
Nguyễn Thị Hiền; Roberto Ranzi
Department of Civil, Environmental, ArchitecturalEngineering and Mathematics University of Brescia, Brescia, Italy [email protected]; [email protected]
Vũ Minh Cát
Department of Marine and Coastal Engineering Thuy Loi University
Hanoi, Vietnam [email protected] Abstract—The river flow in Red river delta though is very
abundant during the high season is well faced with high potential of seawater intrusion in downstream areas due to huge water demand from upstream and invading seawater, also resulting from sea level rise. The operation of many reservoirs upstream has great effects on river regime and salinity dynamics at the downstream. The paper presents preliminary scenarios in utilizing reservoir operation to mitigate salt concentration and enhance the irrigation plan throughout the years. The increases of water release in the dry season from Hoa Binh reservoir have improved noticeably salinity downstream in most of the river networks. The thresholds of salinity were also indicated in order to support decision makings for reservoirs operation.
Keywords—reservoir; saltwater intrusion; water demand;
I. INTRODUCTION
The Red river delta is considered as the second largest river system in Vietnam with high density of habitat in the Northern part.
The river is formed from three upstream tributaries: Lo river, Thao river and Da river and six downstream tributaries including Hoang Long river, Day river (lead to Cua Day estuary), Ninh Co river (Ninh Co estuary), Red river (Ba Lat estuary), Tra Ly river (Tra Ly estuary) together with Luoc and Duong river that connected to Thai Binh river system.
The water demand for all socio-economic activities is getting higher as a result of dense population and development
plan. In which, most of the activities in the areas are dominated by agriculture and the dramatic growth of population recently, the pressure on water resources has also increased. Additionally, the hydraulic structures such as dikes and river embankments, groundwater exploitation coupled with high subsidence rate in the area and sea level rise lead to great vulnerability to saltwater intrusion. According to the salinity survey of Vietnam Academy for Water Resources from Dec, 2006 to May, 2007: “Salinity measurement in Red river delta”, at 22th km of Tra Ly river the highest salinity is 6.52‰, the highest mean is 3.44‰ and the lowest peak is 1.52‰ in December, 2007 when reservoirs store water. In January, the highest salinity at 22th km in Red river is 8.64‰, the highest is 6.51‰ and the average is 1.86‰.
Hence, it is paramount to utilize the reservoirs from upstream to reallocate water in order to increase water level downstream and mitigating hazard of salinity intrusion into river in critical seasons.
With the whole picture of the Red river delta, the works by [3] considered surface water effects toward salinity phenomenon. Simplified 1D MIKE 11 was adopted to simulate hydrodynamic regime and salinity in the whole river system. The calibration was done when water extraction system is operated to supply winter – spring crop in 2003. The observed data showed a high level of salinity during low season from January to March and minimum values in the high flow season. The results demonstrated the serious problem of salinity during the dry season as it could be found around dozens of kilometers from the river mouth such as 16.2 km on Thai Binh river, 15 This research is supported by University of Brescia, Brescia, Italy
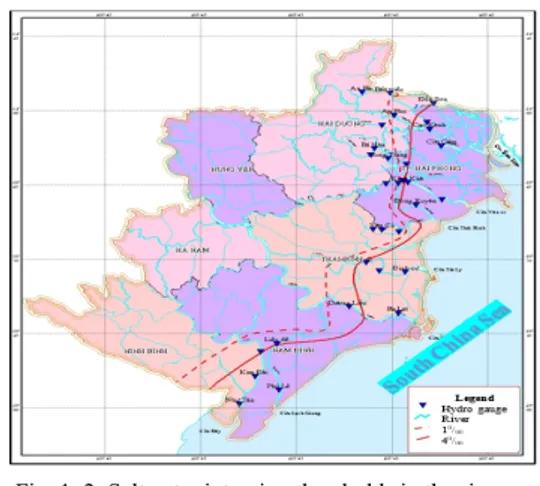
Fig. 1. 1. The research areas
km on Day river or 16.5 km on Tra Ly river. Study salinity in Red river [9] evaluate salinity in the main streams of Red river delta. The flow and the salinity intrusion model for a river network has been modified to use as numerical model in the study which is strictly suitable to the well mixed estuaries. Tidal effects and characteristics were assessed by harmonic analysis of downstream conditions with appropriate accuracy. The results revealed that during the spring tide 10‰ of salinity concentration could be observed almost alongside the Ninh Co river while during the ebb tide it could move back upon Lieu De station. Besides, during the moderate tide the intrusion distance is longer in the spring tide rather than the flood tide. Day river, on the other hand experiences less salinity expansion compared to other branches.
Serving the purpose of salinity mitigation upon these facts, a couple of different water released scenarios from upstream reservoirs and tidal fluctuation along with downstream water demand were developed to evaluate saltwater intrusion problem in the red river delta. In which, different scenarios of the water release from reservoir is generated according to water demand in the river basin. Then, the research simulates and evaluates current and future river hydrodynamics through MIKE 11 modules. Salt concentration is simulated in module advection – dispersion include data at Ba Lat (Red river), Duong Lieu (Red river), Ngu Thon (Tra Ly), Phuc Khe (Tra Ly), Dong Quy (Tra Ly), Phu Le (Ninh Co), Nhu Tan (Day), Van Cu (Hoa), An Phu (Kinh Mon) and Ba Nha (Gua).
II. RESEARCH METHODOLOGY
The river hydrodynamics and salinity were simulated using MIKE 11 to evaluate impacts of reservoirs and barrages on saltwater intrusion.
MIKE 11 developed by DHI Water and Environment is a professional engineering software package for the simulation of flow, water quality and sediment transport at the estuary, river, irrigation system, canals and other water body. This is a user-friendly, fully dynamic and one dimensional tool for detailed analysis, design, management and operation of both simple and complex river and channel systems. With its flexibility, speed and user friendly environment, MIKE 11 provides a complete and effective design environment for engineering and water resources, water quality management and planning application.
A. Model governing equations
The hydrodynamic model (HD) is a core part of MIKE 11 and is supported for most other modules such as hydrological forecast, water quality and coherent and non coherent sediment transport modules. Structures combined in MIKE 11 included barrages, sluices, pumping stations, reservoirs, bridges and regulated structures.
In MIKE 11, hydrodynamic module is governed by Saint – Venant equations to compute discharge, water level along the river in space and time. The Saint – Venant equations includes mass and momentum balance equations as below
q
t
A
x
Q
=
∂
∂
+
∂
∂
(1) 0 2 = + ∂ ∂ + ∂ ∂ + ∂ ∂ R C V V x V V g t V g x h
α
β
(2) B. Data collection
The river flow and water level, salinity at different locations are collected along the river basin in order to select the possible boundary conditions and testing stations for hydrodynamics and advection – dispersion modeling.
In addition, the river morphology is described through cross section information from around 30 tributaries including: Da, Lo, Gam, Chay, Thao, Thao – Red river, Pho Day, Red river, Day, Hoang Long, Dao, Ninh Co, Luoc, Hoa, Tra Ly, Cau, Thuong, Luc Nam, Thai Binh, Kinh Thay, Kinh Mon, Van Uc, Gua, Mia, Moi, Lai Vu, Lach Tray, Cam and Da Bach.
The reservoirs operation and characteristics along the river system considered are Lai Chau, Son La, Hoa Binh, Thac Ba, Tuyen Quang. This information is needed while evaluating the effects of upstream regulation in view of saltwater intrusion.
C. Modeling setup
The model takes into account Red and Thai Binh river system as aforementioned in which:
Upstream conditions: discharge including Hoa Binh (Da river), Yen Bai (Thao river), Thac Ba (Chay river), Ham Yen (Lo river), Chiem Hoa (Gam river), Phu Cuong (Ca Lo river), Thac Huong (Cau river), Cau Son (Thuong river), Chu (Luc Nam river), Ba Tha (Day).
Downstream conditions: water level and salinity at Do Nghi (Da Bach river), Cua Cam (Cam river), Lach Tray (Lach Tray river), Van Uc (Van Uc river), Thai Binh (Thai Binh river), Tra Ly (Tra Ly river), Ba Lat (Red river), Ninh Co (Ninh Co river), Cua Day (Day river).
Testing stations for model performance: Phu Tho, Viet Tri, Son Tay, Thuong Cat, Ha Noi, Hung Yen, Nam Dinh, Pha Lai, Cat Khe, Cao Kenh, Trieu Duong, Quyet Chien, Truc huong, Trung Trang. All the pumping stations for socio-economic activities as well as other structures are included in the model.
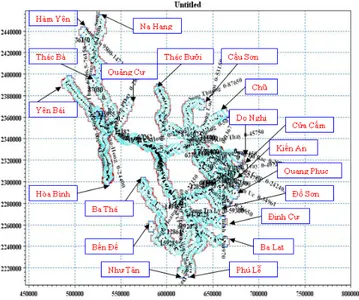
Fig. 2. 1. Red – Thai Binh river network using MIKE 11 model The model is calibrated and validated at different period of time. Data series in the period 1st January to 31st March, 2000 is
used for calibration to identify the set of the model parameters. Then, according to available observed data, a set of hydrological data in the dry season, 2001 from 1/1/2001 to 31/3/2001 are used to verify the hydrodynamic model.
The criteria for model performance is Nash – Sutcliffe Efficiency index NSE:
NSE = 1 -
(
)
(
−
)
−
2 2,
,
,
Xo
i
Xo
i
Xs
i
Xo
(3)In which X0,i: observed data; Xs,i: computed data
Xo
: average value of observed dataModel Calibration
The model is first calibrated with a first set of hydrodynamic (stage and discharge) and salinity data.
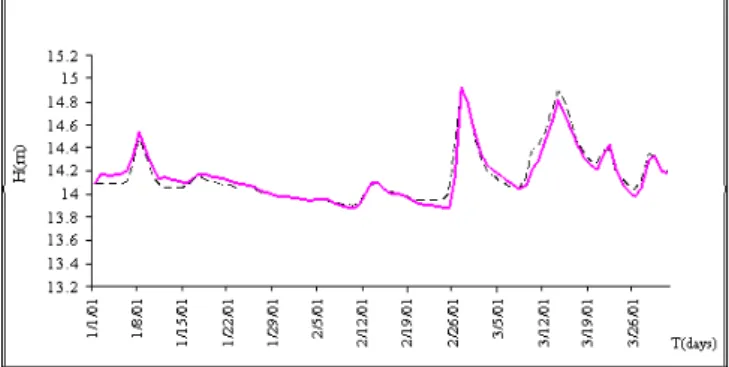
Fig. 2. 2. Observed and calculated water level at Phu Tho station (Thao river)
Fig. 2. 3. Observed and calculated water level at Ha Noi station (Red river) The results show that discharge graph at Hanoi and Phu Tho has a good fit with observed data as NSE = 81.8% and 96.8%. Similarly, NSE is about 82.5% with the water level and 88.4% with discharge at Son Tay station. Hung Yen (on Red river) and Quyet Chien station (Tra Ly river) shows a good performance of model with NSE=87.1% and 99.6% on water level. Especially, at Truc Phuong station on Ninh Co river, NSE could reach 99.3% or at Nam Dinh station on Dao river is 99.6%.
Model Validation
The set of hydrodynamic module parameters after calibration then was used to validate for another period of time in 2001 from 1/1/2001 to 31/3/2001.The results have proved good fit at different testing station e.g at Phu Tho station NSE = 84.8% for water level, Son Tay station with 83.5% and 92.9% for water level and discharge, respectively.
Similar results were found at other remaining stations on the river systems. The calibration procedure is then finding the best set of parameters for the advection and dispersion module in order to simulate salinity dynamics throughout the years. In this work, NSE index was also used to define model performance. The general results are shown in the following table and figures.
TABLE I. 1. Computed and observed salinity at some testing station on the river system in calibration step. (Comp*: computed salinity, Obs*: observed salinity)
As can be seen, NSE values are quite good at around more than 85% for most of the stations in both calibration and validation step. The graph comparison between observed and computed values at some station show a good fit. It indicates that the model parameters of both hydrodynamics and salinity concentration modules can be applied to simulate and evaluate the salinity distribution throughout different time and space domains.
D. Computed scenarios and discusion
Due to the rainfall and runoff regimes in the river basin, the flow is lower in the dry winter season and vice versa is higher in the flood summer and autumn season. Meanwhile, the water demands, especially for agriculture in Red river are always high in January to March, the driest period. The water storage of reservoirs upstream, operated for the purposes of power, flood protection and downstream activities mainly irrigation [6], [7], sometimes conflict with the amount of available water during dry season. Those factors have led to higher probability and unexpected seawater intrusion as well as water scarcity downstream. Hence, some scenarios are preliminary investigated to address the water needs in the river system during the dry season. The discharge released from Hoa Binh reservoir will be increased up to 20% and 30% (S1 and S2) along with two design discharge from four upstream stations (Chiem Hoa and Ham Yen on the Lo river, Yen Bai – Thao river, Chu – Thai Binh river) together with real downstream tidal range. Those simulations were based on the baseline year 2004 to analyze the upstream effects toward salinity problem on the river basin
No. Observed Station River Comp* Calibration Obs* NSE
1 Ba Lat Red 18.0 17.6 87.0
2 Duong Lieu Red 0.5 0.8 84.0
3 Ngu Thon Tra ly 10.0 12.0 86.5
4 Phuc Khe Tra ly 7.8 9.0 85.8
5 Dong Quy Tra ly 0.04 0.03 85.3
6 Phu Le Ninh Co 15.0 14.8 87.6
7 Nhu Tan Day 10.12 9.0 86.8
8 Van Cu Hoa 0.09 0.07 85.6
9 An Phu Kinh Mon 0.02 0.03 85.2
10 Ba Nha Gua 0.16 0.3 86.1
Fig. 2.5. Observed and calculated water level at Phu Tho
Fig. 2. 6. Observed and calculated salinity at Dinh Cu station
Fig. 2. 5. Calculated and observed salinity at Duong Lieu station
Fig. 2. 8. Water levels at different scenarios at Son Tay
TABLE I. 2. Water level and discharge of 2 scenarios at Son Tay Parameters Scenarios S1 S2 Hmax 6.22 5.93 Hmin 6.1 5.75 Have 6.15 5.81 Qmax 1476 1337 Qmin 1416 1258 Qave 1441 1278
TABLE I. 3. Water level and discharge of 2 scenarios at Ha Noi
Parameters Scenarios S1 S2 Hmax 3.21 2.92 Hmin 3.01 2.76 Have 3.14 2.86 Qmax 1203 1093 Qmin 1162 1022 Qave 1180 1041
TABLE I. 4. Water level and discharge of scenarios at Hung Yen
Parameters Scenarios S1 S2 Hmax 1.67 1.64 Hmin 0.92 0.83 Have 1.24 1.17 Qmax 1081 978 Qmin 808 659 Qave 1018 892
In which: Hmax, Qmax: Maximum water level and discharge
Hmin, Qmin: Minimum water level and discharge
Have, Qave: Mean value of water level and discharge
In general, when increasing water released from reservoirs by 20% in comparison with normal case, water level just downstream of reservoirs to Hanoi is increased, with rising values up to 30cm at Hanoi and higher at location in the upper parts. Downstream of Hung Yen, where tides and backwater affect significantly the water level, water depth does not change much when increasing water released from reservoirs.
Consequently, saltwater intrusion in the river was then evaluated for the same dry period from 17/01/2004 – 28/01/2004 by increasing the discharge from Hoa Binh up to 20% to 30%.
Table I.5 and following figures show the maximum salinity results in the river system according to different scenarios. The benefit resulting from an increased water release from reservoirs can be appreciated.
TABLE I. 5. Maximum salinity intrusion (‰) in the research areas
Distance to the sea (km) Red river 34.5 31.7 16.5 11 3 0 Q 20% 0.97 2.17 8.13 12.5 20.9 25 Q 30% 0.45 1.1 5.78 10.8 20.4 25 Tra Ly river Km 36 27 18 14 4 0 Q 20% 0.49 2.14 6.15 9.2 18.6 25 Q 30% 0.23 0.66 3.29 6.6 17.4 25
Thai Binh river
Km 27.9 24.8 20 15 5 0 Q 20% 2 3.29 6.06 8.52 16.23 25 Q 30% 1.2 2.19 5.02 7.95 16.4 25 Van Uc river Km 43.5 34.8 28.6 20.6 8.6 0 Q 20% 1.14 2.4 4.27 7.68 16.27 25 Q 30% 0.59 1.53 3.21 6.95 15.72 25
Fig. 2. 6. Water levels at different scenarios at Hung Yen
Fig. 2. 8. Maximum salinity averaged cross section along Tra Ly river Fig. 2. 7. Maximum salinity averaged cross section along Red river
As from the results, the salinity decreases gradually with higher water discharge from the reservoir in all the rivers at a distance of more than 15km from the estuaries. A salinity decrease of about 2-4‰ can be reached up to 5km from the estuary. However, there is very less changes of salinity close to the river mouths (less than around 3km). Saltwater intrusion higher than 1‰ occurs at very long distance at Van Uc river and Red river even with 30% increase of discharge release. These values are very paramount while considering time and locations for irrigation season and water drinking at the downstream.
III. CONCLUSIONS
Red river and Thai Binh river hydrodynamic regimes were proved to be well simulated and evaluated using MIKE 11 model. Salinity has been shown to be dominant in the river in the dry season with tidal effects and uncontrollable water consumption from downstream for irrigation, sanitation or industry. Yearly total volume water tends slightly to decrease, but uneven distribution between flood and dry season becomes stronger.
The operation of upstream reservoirs so far has been mitigating the amount of salinity at the certain periods of time and rivers. By increasing discharge from Hoa Binh reservoir to 20% and 30% in the dry season salt concentration as a result, decrease in all the rivers, especially Red and Tra Ly rier. Hence, in principle it is possible to operate those upstream reservoirs accordingly to the downstream demands in order to enhance seawater intrusion problem and develop irrigation plan for the river system. The compromise with other objectives, as flood protection and hydropower generation needs to be investigated as well.
It is still difficult to assess accurately saltwater intrusion due to the limited data on salinity concentration. Nevertheless, the model is showing realistic results and salinity dynamics over one dimension. Further improvements would include the
vertical profile and its impacts throughout different time and space also in view of the interaction with the groundwater. Therefore, the extended model in both 2D-3D together with tidal effects should be considered in further research.
ACKNOWLEDGEMENT
The authors would like to express the support of the University of Brescia and in data collection PhD scholarship and mobility funding.
REFERENCES
[1] Carrera, J., Hidalgo, J. J., Slooten, L. J., & Vázquez-Suñé, E. (2010). ‘Computational and coneptual issues in the calibration of seawater intrusion model’. Hydrogeology Journal, 18(1), 131–145. https://doi.org/10.1007/s10040-009-0524-1.
[2] Loáiciga et al. (2012), ‘Sea Water Intrusion by Sea-Level Rise: Scenarios for the 21st Century’, Ground Water, 37–47.
[3] On, Tran Viet, Nguyen Cao Don, Nguyen Minh Hang, and Thi Van Le Khoa. 2014. “Hydrodynamic flw and salinity intrusion in the red river delta, Vietnam,” no. 1: 1–6.
[4] Nguyen, D. H. (n.d.). Numerical Modeling of Saline Intrusion in the Red River Delta , Vietnam
[5] Thi, Y., Nguyen, B., Kamoshita, A., & Hai, V. T. (2016). Salinity intrusion and rice production in Red River Delta under changing climate conditions. Paddy and Water Environment, 15(1), 37–48. https://doi.org/10.1007/s10333-016-0526-2
[6] Sanford, W. E., & Pope, J. P. (2010). ‘Current challenges using models to forecast seawater intrusion: lessons from the Eastern Shore of Virginia, USA’. Hydrogeology Journal, 18(1), 73–93. https://doi.org/10.1007/s10040-009-0513-4
[7] Ngo, L.L., Madsen, H., Rosbjerg, D., Pedersen, C.B., (2008). ‘Implementation and comparison of reservoir operation strategies for the Hoa Binh reservoir’, Vietnam using the Mike 11 model, Water Resources Management, 22 (4), pp. 457-472.
[8] Castelletti, A., Pianosi, F., Quach, X., Soncini-Sessa, R. (2011). ‘Assessing water reservoirs management and development in northern Vietnam’, Hydrology and Earth System Sciences, 16 (1), pp. 189-199. [9] Vu Thanh Ca; Suphat Vongvisessomjai; Takashi Asaeda. (1994). Study