ori ginal research
A Distinct Genetic Cluster in Cultivated Chickpea
as Revealed by Genome-wide Marker Discovery
and Genotyping
Stefano Pavan,* Concetta Lotti, Angelo R. Marcotrigiano, Rosa Mazzeo,
Nicoletta Bardaro, Valentina Bracuto, Francesca Ricciardi, Francesca Taranto,
Nunzio D’Agostino, Adalgisa Schiavulli, Claudio De Giovanni,
Cinzia Montemurro, Gabriella Sonnante, and Luigi Ricciardi
Abstract
The accurate description of plant biodiversity is of utmost impor-tance to efficiently address efforts in conservation genetics and breeding. Herein, we report the successful application of a geno-typing-by-sequencing (GBS) approach in chickpea (Cicer
arieti-num L.), resulting in the characterization of a cultivated germplasm
collection with 3187 high-quality single nucleotide polymorphism (SNP) markers. Genetic structure inference, principal component analysis, and hierarchical clustering all indicated the identification of a genetic cluster corresponding to black-seeded genotypes tra-ditionally cultivated in Southern Italy. Remarkably, this cluster was clearly distinct at both genetic and phenotypic levels from germ-plasm groups reflecting commercial chickpea classification into
desi and kabuli seed types. Fixation index estimates for individual
polymorphisms pointed out loci and genomic regions that might be of significance for the diversification of agronomic and com-mercial traits. Overall, our findings provide information on genetic relationships within cultivated chickpea and highlight a gene pool of great interest for the scientific community and chickpea breed-ing, which is limited by the low genetic diversity available in the primary gene pool.
T
he grainlegume chickpea is an important dietarysource of proteins and essential amino acids and helps to maintain soil fertility through symbiotic N fixation. Together with wild species of the genus Cicer, chickpea originates from the Fertile Crescent. Its domes-tication dates back to the “Neolithic Revolution”, which took place in the Near East about ten thousand years ago (Abbo et al., 2007). By the Bronze Age, chickpea
Published in Plant Genome
Volume 10. doi: 10.3835/plantgenome2016.11.0115 © Crop Science Society of America
5585 Guilford Rd., Madison, WI 53711 USA
This is an open access article distributed under the CC BY-NC-ND license (http://creativecommons.org/licenses/by-nc-nd/4.0/).
S. Pavan, A. R. Marcotrigiano, R. Mazzeo, N. Bardaro, V. Bracuto, F. Taranto, A. Schiavulli, C. De Giovanni, C. Montemurro, and L. Ricciardi, Dep. of Soil, Plant and Food Science, Univ. of Bari Aldo Moro, Via Amendola 165/A, 70126 Bari, Italy; C. Lotti and F. Ricciardi, Dep. of Agriculture, Food and Environmental Science, Univ. of Foggia, Via Napoli 25, 71100 Foggia, Italy; N. D’Agostino, Consiglio per la Ricerca in Agricoltura e l’Analisi dell’Economia Agra-ria, Centro di Ricerca per l’Orticoltura, via Cavalleggeri 25, 84098 Pontecagnano Faiano, Italy; G. Sonnante, Inst. of Biosciences and Bioresources, Italian National Council of Research, Via Amendola 165/A, 70126 Bari, Italy. Received 1 Aug. 2016. Accepted 23 Jan. 2017. *Corresponding author ([email protected]).
Abbreviations: FST, pairwise fixation index; GBS, genotyping-by-sequencing; K, number of hypothetical subpopulations; LD, linkage disequilibrium; PCA, principal component analysis; SNP, single nucleotide polymorphism; SVS, SNP & Variation Suite. Core Ideas
• Genotyping-by-sequencing analysis in cultivated chickpea generated 3187 high-quality single nucleotide polymorphisms.
• Analysis of genetic diversity supports the identification of three subpopulations.
• Accessions traditionally grown in Italy form a clearly distinct genetic cluster.
• We identified genomic regions putatively resulting from directional selection.
• Our findings are of interest for chickpea conservation genetics and breeding.
cultivation had spread throughout the Mediterranean Basin, Central Asia, and Africa. To date, chickpea is the second most abundantly grown food legume in the world. India is the world leader in chickpea production, followed by Pakistan and Turkey. Other major producers are Ethiopia and Mexico (Mansfeld, 2008).
Despite its economic importance and the availability of several cultivars, the world average yield of chickpea (0.96 t ha1, FAOSTAT 2014) is far below the potential
yield of about 5 t ha1. This gap is mainly attributable
to poor resistance to biotic and abiotic stresses (Amin and Melkamu, 2014). Breeding efforts to increase chick-pea yield are frustrated by the limited genetic diversity available within cultivated germplasm. This is thought to be the result of four evolutionary bottlenecks, caused by the narrow eco-geographic distribution of the wild progenitor (Cicer reticulatum Ladiz.), the founder effect associated with domestication, the selection of genotypes adapted to spring sowing, and the replacement of local landraces (Abbo et al., 2003).
The study of DNA diversity is of great importance for addressing conservation programs contrasting the erosion of cultivated gene pools and to guide the use of germplasm in breeding. In chickpea, the first stud-ies on genetic diversity were, in most cases, based on simple sequence repeat molecular markers (Nayak et al., 2010). More recently, with the advent of next-generation sequencing technologies and the complete sequencing of the chickpea genome (Jain et al., 2013; Varshney et al., 2013), single nucleotide polymorphism (SNP) mark-ers have been widely used, as they are present in a large number and merge excellent genetic attributes (Kujur et al., 2013). At present, the genotyping-by-sequencing (GBS) assay is considered one of the most convenient approaches for simultaneous large-scale SNP discovery and genotyping (Elshire et al., 2011).
Previous studies partitioned the diversity of culti-vated chickpea in two gene pools, broadly reflecting the occurrence of two main commercial seed types: desi (small and dark-colored) and kabuli (large and cream-colored) (Upadhyaya et al., 2008; Bajaj et al., 2015a). A third, uncommon type of chickpea has a centuries-long tradition of cultivation in the region of Apulia in the southeast of Italy. It is called black chickpea (cece nero, in Italian) and was recently reported to be darker and bigger than common desi types (Mohammadi, 2015). Similarly to other traditional landraces, Apulian black chickpea is being replaced by modern cultivars and is thus at risk of genetic erosion.
In this study, we used a GBS approach to describe chickpea biodiversity. For the first time, the Apulian black chickpea was included in a study on genetic diver-sity and it is reported to form a clearly distinct genetic and phenotypic cluster of great interest for the scientific community and for breeding.
Materials and Methods
Plant Material
Details on the germplasm characterized in this study are provided in Supplementary Table S1. A set of 29 desi and 28 kabuli chickpea accessions were selected from the
ex situ collections of the USDA-ARS, the Department
of Plant, Soil and Food Science of the University of Bari (Italy), and the Institute of Biosciences and Bioresources of the Italian National Research Council. Accessions were mainly selected for their origin, to represent the geographic distribution of chickpea global cultivation, and included black-seeded accessions. A set of 25 Apu-lian chickpea accessions, now included in the Depart-ment of Plant, Soil and Food Science of the University of Bari repository, was collected by means of missions performed throughout the Apulian territory.
Genotyping-by-sequencing, Genotyping,
and SNP Validation
Genomic DNA was isolated from young leaf samples using the DNeasy Plant Mini Kit (Qiagen). An ApeKI GBS library was prepared as described by Elshire et al. (2011) and sequenced using the Illumina HiSeq 2500 device (Illumina Inc., San Diego, CA). The FASTQ files used to generate the VCF file are available at the National Cen-ter for Biotechnology Information Short Read Archive (http://www.ncbi.nlm.nih.gov/sra/, accessed 10 Apr. 2017) database under the accession number SRX1706615. Master tags (i.e., collapsed unique sequence tags) were aligned to the reference chickpea 1.0 genome (Varshney et al., 2013) by the Burrows–Wheeler Aligner tool (ver-sion 0.7.8-r455) with default settings. Single nucleotide polymorphism calling implemented within the TASSEL-GBS pipeline (Glaubitz et al., 2014) was used to generate a VCF file. Biallelic SNPs were filtered for minimum depth of five reads, a minor allele frequency higher than 1%, a call rate higher than 90%, and an inbreeding coef-ficient higher than 0.8 using TASSEL (version 5.2.20) (Bradbury et al., 2007). A threshold of 15% was set to remove accessions with missing data. Vcf-annotate from VCFtools (version 0.1.13) (Danecek et al. 2011) and the
Cicer arietinum gene annotation (ftp://climb.genomics.
cn/pub/10.5524/100001_101000/100076/Cicer_arieti-num_GA_v1.0.gene.gff, accessed 10 Apr. 2017) allowed the mapping of SNPs on genic or intergenic regions. The VCFtools package also served to derive the percentage of homozygous or heterozygous loci and the distribution of SNP substitution types. To validate the polymorphisms detected with the GBS assay, amplicons harboring seven randomly selected SNP loci were obtained from the three accessions ‘Califfo’ (kabuli), ‘W610046’ (desi), and ‘MG29’ (Apulian) by means of the primers reported in Supple-mentary Table S2 and used for Sanger sequencing.
Population Structure and Molecular Diversity
The software STRUCTURE (version 2.3.4) (Pritchard et al., 2000) was used to estimate the number of hypotheti-cal subpopulations (K) and the probability of individual accessions to fall in each subpopulation. As the STRUC-TURE algorithm assumes that the loci are independent, the SNP dataset was pruned prior to analysis, on the basis of pairwise linkage disequilibrium (LD) between adjacent markers, using the SNP & Variation Suite (SVS) software package (version 8.4.0, Golden Helix Inc.) and the 0.5 r2 threshold. A Bayesian clustering approach was
used, in which the hypothesis of 1 to 10 subpopulations was set and a Markov chain Monte Carlo of 100,000 burn-in phases followed by 100,000 iterations was run independently 10 times using an admixture model. The value of the ad hoc quantity K was chosen as a criterion to estimate the true K (Evanno et al., 2005). Individual samples were assigned to any of the subpopulations if the value of the corresponding membership coefficient (q) was higher than 0.6; otherwise, they were considered to be of admixed ancestry.
Molecular diversity among accessions was ana-lyzed with the principal component analysis (PCA) tool implemented in SVS, using the LD-pruned SNP data-set as input. In addition, a neighbor-joining tree was obtained via MEGA6 (Tamura et al., 2013), performing 1000 bootstrap replications.
Pairwise fixation index (FST) estimates among the three chickpea subpopulations identified by STRUCTURE were calculated using the formula of Weir and Cock-erham (1984) implemented in SVS, excluding admixed individuals. To estimate overall FST, LD-pruned SNP were used. Instead, single-marker FST estimates were computed on the whole SNP dataset. Markers with pairwise esti-mates higher than 0.9 were used to draw a custom Venn diagram (http://bioinformatics.psb.ugent.be/webtools/ Venn/, accessed 10 Apr. 2017). A plot of single-marker FST estimates against the chickpea 1.0 genome assembly was obtained by using the GenomeBrowse function in SVS.
Phenotypic Evaluation of Seed Weight
The germplasm collection described in Supplementary Table S1 was grown at the experimental farm P. Martucci of the University of Bari (41°01′22.1″N 16°54′21.0″E) during the growing season of 2013–2014. Plants were disposed according to a randomized block design with four replicates, each replicate containing 10 individual plants. At crop maturity, 25 seeds from each block were used to measure the weight of 100 seeds. For cultivated accessions included in the chickpea reference set collec-tion (Upadhyaya et al., 2008), the weight of 100 seeds parameter was extracted from the Germplasm Resources Information Network web server database (http://www. ars-grin.gov, accessed 10 Apr. 2017). Significant differ-ences in pairwise comparisons among groups of acces-sions were inferred by Student’s t-test.
Results
Single Nucleotide Polymorphism Discovery,
Genotyping, and Validation
Sequencing of the ApeKI GBS library yielded about 198 million good barcoded reads from desi (29) and kabuli (28) accessions, originating from the main chickpea growing countries, and 25 Apulian black chickpea acces-sions (Supplementary Table S1). This corresponds, on average, to 2.5 million good reads per sample. Alignment of the reads with the chickpea reference genome yielded 80% tags aligned to unique positions, 10% to multiple positions, and 10% tags that could not be aligned.
Biallelic SNPs were selected and filtered on the basis of the call rate (90%), minimum depth (5×) and minor allele frequency (0.01), resulting in 37,495 polymor-phisms. A further filter based on the inbreeding coef-ficient FIT was applied, as suggested by Glaubitz et al. (2014), to remove error-prone SNPs and spurious SNPs from paralogy. At the end of the process, 3187 SNPs were obtained in a final dataset of 82 genotypes. The accession W617430 was removed from further analyses because of an excess of missing data. The average depth of cover-age was 28.6 reads per SNP locus; the observed depth of coverage distribution across accessions is reported in Supplementary Fig. S1. Single nucleotide polymorphism quality was tested via Sanger sequencing of seven ran-domly selected SNP loci from three different accessions (see Materials and Methods), resulting in the validation of all the polymorphisms called by the GBS assay. Chro-mosomes 1–8 contained 561, 275, 249, 851, 197, 438, 269, and 138 SNP loci, respectively, with an average density of one locus per 112.797 kb. The remaining 209 mark-ers were positioned on scaffolds that could not be placed on any chickpea chromosome. Using the available gene coordinates (Varshney et al., 2013), 69 and 31% of the SNP loci were assigned to genic and intergenic regions, respectively. The vast majority of SNP loci was homo-zygous for either the reference (72.8%) or the alternate allele (24.8%), whereas a few loci were scored as heterozy-gous (1.6%) or were associated with missing data (0.7%) (Supplementary Fig. S2). Concerning SNP substitutions, the observed transition/transversion ratio was 1.61, resulting from 1748 transitions and 1083 transversions. The most and less represented substitution types were the A–G transition (28.4%) and the C–G transversion (6.9%).
Genetic Structure
An admixture-based clustering model was used to infer the genetic structure of the germplasm collection geno-typed in this study. As the model assumes independent loci, prior to analysis, the SNP dataset was pruned by setting a maximum threshold of LD between adjacent markers, resulting in an input file of 1015 markers. According to the K inference approach, a model with three subpopulations best fitted the data (Supplementary Fig. S3), in which 94% of the accessions were assigned to
a specific subpopulation (membership coefficient q 0.6) and 6% of accessions showed admixed ancestry. Notably, one of the subpopulations, named A, contained 21 acces-sions of Apulian black chickpea, suggesting the identifi-cation of a peculiar gene pool. The second subpopulation (K) grouped all the kabuli accessions and four accessions of Apulian chickpea (‘MG_9’, ‘MG_15’, ‘MG_17’, and ‘MG_24’). The third subpopulation (D) contained all the
desi accessions and two kabuli accessions (PI 292005 and
PI 343014) (Fig. 1). Pairwise fixation index (FST) estimates were 0.31 between A and K, 0.26 between A and D, and 0.19 between K and D.
Genetic Relationships among Individuals
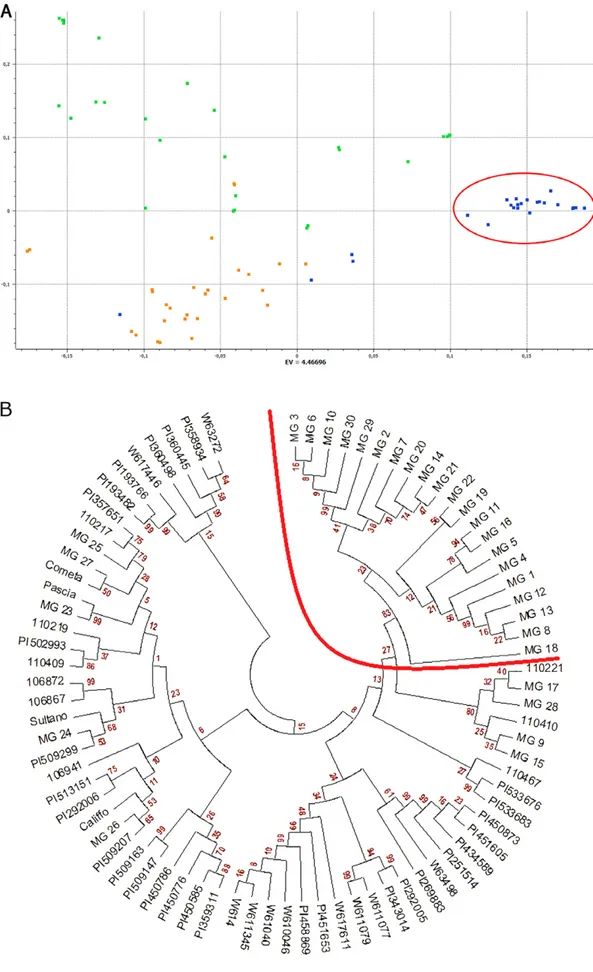
Principal component analysis substantiated the results obtained from structural analysis and indicated patterns of molecular diversity among individual accessions. As shown in Fig. 2a, a PCA cluster consisted entirely of the Apulian black chickpea accessions falling within the A subpopulation. Another PCA group was formed by
kabuli types and the Apulian chickpea accessions MG_9,
MG_15, MG_17, and MG_24. Desi chickpeas were more scattered throughout the PCA plot, indicating higher genetic variability. Neighbor-joining clustering analysis provided bootstrap support for differentiating a mono-phyletic clade corresponding to Subpopulation A and gave a measure of genetic distance among the accessions genotyped in this study (Fig. 2b).
Phenotypic Evaluation of the Collection
To provide phenotypic support to the GBS results, we characterized our germplasm collection for the 100-seed weight (Supplementary Table S1) and extracted 100-seed weight estimates from the reference set collection reported by Upadhyaya et al. (2008), previously indicated as being representative of chickpea genetic variation. The average weight measured for the A cluster (26.4 g) resulted significantly higher than the one displayed by
desi genotypes present in our collection (18 g) and in
the reference set collection (16.7 g). Analogous conclu-sions could be drawn when comparing the A group with black-seeded desi germplasm (Supplementary Table S3). Remarkably, many A accessions were associated with seed weights that were comparable with or exceeding the maximum value observed for desi germplasm (Supple-mentary Tables S1 and S3), thus substantiating the notion that A forms a distinct gene pool.
Genetic Divergence at Individual Loci
To identify genomic regions putatively subjected to dif-ferent selection pressures in the subpopulations A, D and K, we estimated, at individual SNP loci, the pairwise fix-ation index (FST). This parameter approaches the upper limit of 1 when two genetic groups tend to fix alternative alleles. The genomic distribution of SNP loci in the func-tion of the FST distance highlighted two large genomic windows on chickpea chromosomes 1 and 4 differentiat-ing the germplasm of K from that of A and D (Fig. 3).
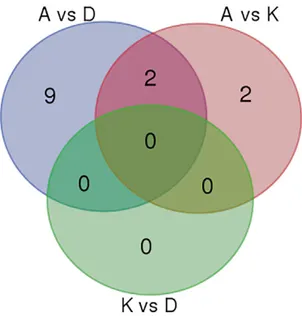
Aiming to detect SNPs that are highly polymorphic among A, D, and K, we selected loci associated with pairwise FST estimates higher than 0.9. No locus of this type was found when we examined K and D. Conversely, 11 loci were detected when we compared A and D, posi-tioned on five different regions of chromosomes 4, 5, 6, 7, and 8 and 4 loci were detected when we compared A and K, positioned on four different regions of chromosomes 4, 5, and 6 (Fig. 4 and Supplementary Table S4). Two loci on chromosomes 4 and 5 were highly polymorphic in both the A–D and the A–K pairwise comparisons. One of them (4:38978423-SNV) defined a private allele, unique for the A group (FST [A vs. K] = 1 and FST [A vs. D] = 1) (Fig. 4 and Supplementary Table S4).
Discussion
Understanding genetic variation in cultivated plant spe-cies is of utmost importance for adopting efficient strate-gies for germplasm conservation and for coping with breeding issues. Therefore, in the last few years, several
Fig. 1. Population structure analysis of cultivated chickpea germplasm. Results are shown for K = 3, which corresponds to the number of subpopulations that sufficiently defines genetic variation (see Fig. S3). These are named K, A, and D as they mostly group kabuli, Apulian black chickpea, and desi genotypes, respectively. Each individual is represented by a vertical line, which is partitioned into colored segments that represent the estimated membership fractions (q) in each subpopulation. Individuals of admixed (ADM) ancestry (highest q < 0.6) are indicated.
Fig. 2. Genetic relationships within the germplasm collection used in this study. (A) Principal component analysis (PCA) plot of the first two components. Different colors represent desi (green), kabuli (orange), and Apulian black chickpea (blue) accessions. A cluster of Apulian black chickpea accessions corresponding to the A subpopulation is circled. (B) Neighbor-joining tree. A monophyletic clade containing accessions of the A subpopulation is delimited by an arch.
Fig . 3 . G en om ic d is tri bu tio n o f 3 18 7 s in gl e nu cl eo tid e p ol ym or ph is m ( SN P) m ar ke rs i de nt ifi ed i n t hi s s tu dy i n t he f un ct io n o f p ai rw is e F ST e sti m at es b et w ee n t he D , K , a nd A s ub po pu la tio ns id en tifi ed b y s tru ct ur e a na lys is. H igh ly p ol ym or ph ic g en om ic r eg io ns o n c hr om os om es 1 a nd 4 a re h igh ligh te d.
investigations addressed the characterization of DNA polymorphisms in chickpea. In this study, we used GBS as an efficient and cost-effective strategy to simultane-ously discover and genotype a large number of polymor-phisms. Similarly to previous GBS assays on chickpea (Bajaj et al., 2015a, 2015b), we obtained, on average, 2.5 million good reads per sample. We applied a strong SNP calling filter by setting 0.8 as the minimum value of the inbreeding coefficient FIT, as suggested by Glaubitz et al. (2014). We believe that this is a reliable strategy for removing error-prone SNPs and spurious SNPs from paralogy without losing valid information, as chickpea is a strictly self-pollinated species and thus is expected to be highly homozygous. Indeed, except for the accessions PI 458706 and 106867, which might derive from relatively recent hybridization events, our germplasm collection was characterized by a very low percentage of heterozy-gous SNP loci (ranging from 0.14 to 6.3%) (Supplemen-tary Fig. S2). First-generation sequencing of random SNP loci provided a direct indication of the high quality of the SNP dataset used in this study.
Prior to this study, the Apulian black chickpea was mentioned by Mohammadi (2015), indicating its pecu-liar features compared with the commercial types desi and kabuli. However, no work has addressed its genetic characterization. Here, inference on chickpea’s genetic structure resulted in the characterization of a subpopula-tion (A) that only contained Apulian black accessions, separated by a considerably high FST distance from desi and kabuli subpopulations (Fig. 1). Principal component analysis, hierarchical clustering, and phenotypic data further indicated the peculiarity of the A genetic group (Fig. 2 and Supplementary Table S3). The collection used in this study contained chickpea germplasm from
different geographical origins, including non-Italian black-seeded accessions. However, it has a moderate size and thus it is possible that future genetic analyses will not result in the same clear-cut separation between the A cluster and other cultivated germplasm reported here. However, the phenotypic and genetic data provided in this study clearly indicate that Apulian black chickpeas are distinct from common cultivated germplasm. In support of this notion, we showed that the A group sig-nificantly differs, at the phenotypic level, from the desi and kabuli accessions included in a collection previously indicated as being representative of chickpea genetic variation (Upadhyaya et al., 2008).
The FST estimates at individual SNP loci indicate the occurrence of several A alleles that are absent or present at very low frequencies in D and K (Fig. 4 and Supple-mentary Table S4), further indicating the necessity of preserving the A gene pool from genetic erosion. The plot of pairwise FST estimates at individual loci indicated the presence of two large regions on chickpea chromosomes 1 and 4 that were associated with FST values around 0.7, differentiating K from A and D (Fig. 3). These regions might be of great significance for the diversification of peculiar traits within cultivated chickpea germplasm. Loci showing high pairwise FST did not overlap with any of the 15 genomic loci predicted to control seed coat color (Bajaj et al., 2015a). As this trait is known to be quantita-tively inherited (Bajaj et al., 2015a), our findings indicate that there are no peculiar QTL alleles for seed color in the subpopulations characterized in this study.
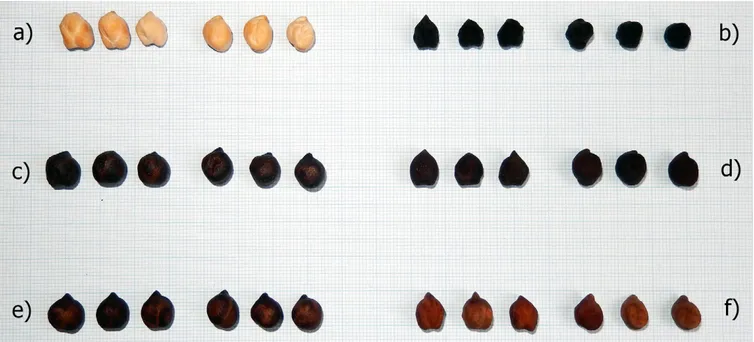
Interestingly, we found that four Apulian black chickpea accessions, namely MG_9, MG_15, MG_17, and MG_24, were genetically close to the cream-colored seed
kabuli genotypes and grouped in the K subpopulation
(Fig. 1 and Fig. 2). Apart from the color, seeds of these accessions are similar to kabuli types, as they are large and smooth (Fig. 5). We conclude that these accessions might originate from artificial or natural crosses between A and K genotypes, followed by selection by local farm-ers. In further support of this hypothesis, the same four accessions contain several SNP alleles typical of the A subpopulation. The exclusion of these accessions from FST analysis raises the number of loci associated with FST
[A vs. K] > 0.9 to 35, the number of alleles associated with
FST [A vs. K] > 0.9 and FST [A vs. D] > 0.9 to five, and the num-ber of A private alleles to two (Supplementary Fig. S4).
We found that two accessions with a kabuli type seed (PI 292005 and PI 343014) actually fall within the D sub-population. Moreover, we could not detect highly poly-morphic loci when we compared D and K (Fig. 4). This is consistent with the hypothesis of the relatively recent evo-lution of kabuli chickpeas from desi ancestors (Roorkiwal et al., 2014). Apulian chickpeas might also stem from desi types. In this case, high genetic distance between A and D might be the result of peculiar selection pressures, genetic drift, or both. Clearly, future studies might provide insights into the evolution of Apulian germplasm.
Fig. 4. Distribution of single nucleotide polymorphism (SNP) markers among subpopulations identified by STRUCTURE analy-sis. Accessions of admixed ancestry were excluded. The Venn diagram refers to markers associated with pairwise FST estimates
In conclusion, our results provide insights into molecular diversity and relationships within cultivated chickpea and identify a gene pool of great interest for chickpea conservation genetics and breeding, which suffers from the narrow genetic basis available in the primary chickpea gene pool. Information on the Apulian black chickpea is still scarce. We are currently perform-ing an extensive characterization of its agronomic, nutri-tional, and technological properties to detect features of interest for breeding purposes.
Supplemental Information
Supplementary Table S1. Cultivated chickpea
acces-sions genotyped in this study.
Supplementary Table S2. List of primer pairs used
to validate GBS polymorphisms via Sanger sequencing.
Supplementary Table S3. Pairwise 100-seed weight
mean comparisons among different groups of accessions. A, D and K stand for the subpopulations identified by STRUCTURE analysis; Desi and Kabuli refer to groups extracted from the chickpea reference set collection; ** and n.s. indicate significant and non-significant differ-ences (p < 0.01) with the A group, respectively.
Supplementary Table S4. List of markers with
pair-wise FST estimates (A vs D and A vs K) higher than 0.9. The locus 4:38978423-SNV, harbouring an allele unique to A, is highlighted. For each SNP locus falling into a gene, gene identification (Cicer_arietinum_GA_v1.0) and gene description are reported.
Supplementary Figure S1. Mean read depth for each
accession.
Supplementary Figure S2. Frequency distribution of
homozygous loci, heterozygous loci and missing data for each accession.
Supplementary Figure S3. ΔK distribution from
STRUCTURE analysis. K=3 shows a peak indicating that three subpopulations sufficiently define genetic variation in the cultivated chickpea dataset used in this study.
Supplementary Figure S4. Distribution of SNP
polymorphisms among subpopulations identified by STRUCTURE analysis. Accessions of admixed ances-try (highest q < 0.6) and the accessions MG_9, MG_15, MG_17, and MG_24 were excluded from analysis. The Venn diagram refers to markers associated with pairwise FST estimates higher than 0.9.
Conflict of Interest Disclosure The authors declare no conflicts of interest. Acknowledgments
Financial support to this work was granted by the project “Recupero, caratterizzazione, SAlvaguardia e ValorizzazionE di leguminose e cereali da GRAanella e foraggio IN PUGLIA (SaVeGraINPuglia)”, Programma di Sviluppo Rurale (PSR), European Agricultural Fund for Rural Development (EAFRD) 2007-2013, Council Regulation (EC) No 1698/2005. The authors acknowledge the farm “Iannone Anna” for kindly providing several acces-sions of Apulian black chickpea and Mrs. Anita Morgese for technical help. References
Abbo, S., J. Berger, and N.C. Turner. 2003. Evolution of cultivated chickpea: Four bottlenecks limit diversity and constrain adaptation. Funct. Plant Biol. 30:1081–1087. doi:10.1071/FP03084
Abbo, S., R.J. Redden, and S.S. Yadav. 2007. Utilization of wild relatives. In: S.S. Yadav, R.J. Redden, W. Chen, and B. Sharma, editors, Chickpea breeding and management. CAB International, Wallingford, UK. p. 338–354.
Amin, M., and F. Melkamu. 2014. Management of Ascochyta blight (Asco-chyta rabiei) in chickpea using a new fungicide. Res. Plant Sci. 2:27–32. doi:10.12691/plant-2-1-6
Fig. 5. Seed phenotype of a typical kabuli accession (cv. Cometa) (a), a typical accession of Apulian black chickpea (MG_21) (b), and the accessions MG_9 (c), MG_15 (d), MG_17 (e), and MG_24 (f).
Bajaj, D., S. Das, H.D. Upadhyaya, R. Ranjan, S. Badoni, V. Kumar, et al. 2015a. A genome-wide combinatorial strategy dissects complex genetic architecture of seed coat color in chickpea. Front. Plant Sci. 6:979. doi:10.3389/fpls.2015.00979
Bajaj, D., M.S. Saxena, A. Kujur, S. Das, S. Badoni, S. Tripathi, et al. 2015b. Genome-wide conserved non-coding microsatellite (CNMS) marker-based integrative genetical genomics for quantitative dissection of seed weight in chickpea. J. Exp. Bot. 66:1271–1290. doi:10.1093/jxb/eru478 Bradbury, P.J., Z. Zhang, D.E. Kroon, T.M. Casstevens, Y. Ramdoss,
and E.S. Buckler. 2007. TASSEL: Software for association mapping of complex traits in diverse samples. Bioinformatics 23:2633–2635. doi:10.1093/bioinformatics/btm308
Danecek, P., A. Auton, G. Abecasis, C.A. Albers, E. Banks, M.A. DePristo, et al. 2011. The variant call format and VCFtools. Bioinformatics 27:2156–2158.
Elshire, R.J., J.C. Glaubitz, Q. Sun, J.A. Poland, K. Kawamoto, E.S. Buckler, et al. 2011. A robust, simple genotyping-by-sequencing (GBS) approach for high diversity species. PLoS ONE 6:e19379. doi:10.1371/journal. pone.0019379
Evanno, G., S. Regnaut, and J. Goudet. 2005. Detecting the number of clusters of individuals using the software STRUCTURE: A simulation study. Mol. Ecol. 14:2611–2620. doi:10.1111/j.1365-294X.2005.02553.x FAOSTAT. 2014. FAO statistical databases. Food and Agricultural
Organi-zation. http://faostat.fao.org/ (accessed 10 Apr. 2017)
Glaubitz, J.C., T.M. Casstevens, L. Fei, J. Harriman, R.J. Elshire, and Q. Sun. 2014. TASSEL-GBS: A high capacity genotyping by sequencing analysis pipeline. PLoS ONE 9:e90346. doi:10.1371/journal.pone.0090346 Jain, M., G. Misra, R.K. Patel, P. Priya, S. Jhanwar, A.W. Khan, et al. 2013. A
draft genome sequence of the pulse crop chickpea (Cicer arietinum L.). Plant J. 74:715–729. doi:10.1111/tpj.12173
Kujur, A., D. Bajaj, M.S. Saxena, S. Tripathi, H.D. Upadhyaya, C.L. Gowda, et al. 2013. Functionally relevant microsatellite markers from chickpea transcription factor genes for efficient genotyping applications and trait association mapping. DNA Res. 20:355–374. doi:10.1093/dnares/dst015
Mansfeld. 2008. Cicer arietinum subsp. arietinum. Mansfeld’s world database of agricultural and horticultural crops. IPK Gatersleben. http://mansfeld.ipk-gatersleben.de/apex/f?p=185:145:::NO::P3_ BOTNAME:Cicer%20arietinum (accessed 10 Apr. 2017)
Mohammadi, K. 2015. Nutritional composition of Iranian desi and kabuli chickpea (Cicer arietinum L.) cultivars in autumn sowing. Int. J. Biol., Biomolecular, Agric. Food and Biotech. Eng. 9:514–517.
Nayak, S.N., H. Zhu, N. Varghese, S. Datta, H.K. Choi, R. Horres, et al. 2010. Integration of novel SSR and gene-based SNP marker loci in the chickpea genetic map and establishment of new anchor points with Medicago truncatula genome. Theor. Appl. Genet. 120:1415–1441. doi:10.1007/s00122-010-1265-1
Pritchard, J.K., M. Stephens, and P. Donnelly. 2000. Inference of population structure using multilocus genotype data. Genetics 155:945–959. Roorkiwal, M., S.N. Nayak, M. Thurdi, H.D. Upadhyaya, D. Brunel, P.
Mournet, et al. 2014. Allele diversity for abiotic stress responsive can-didate genes in chickpea reference set using gene based SNP markers. Front. Plant Sci. 5:248. doi:10.3389/fpls.2014.00248
Tamura, K., G. Stecher, D. Peterson, A. Filipski, and S. Kumar. 2013. MEGA6: Molecular evolutionary genetics analysis version 6.0. Mol. Biol. Evol. 30:2725–2729. doi:10.1093/molbev/mst197
Upadhyaya, H.D., S.L. Dwivedi, M. Baum, R.K. Varshney, S.M. Udupa, C.L.L. Gowda, et al. 2008. Genetic structure, diversity, and allelic rich-ness in composite collection and reference set in chickpea (Cicer arieti-num L.). BMC Plant Biol. 8:106. doi:10.1186/1471-2229-8-106 Varshney, R.K., C. Song, R.K. Saxena, S. Azam, S. Yu, A.G. Sharpe, et
al. 2013. Draft genome sequence of chickpea (Cicer arietinum) pro-vides a resource for trait improvement. Nat. Biotechnol. 31:240–246. doi:10.1038/nbt.2491
Weir, B.S., and C.C. Cockerham. 1984. Estimating F-statistics for the analysis of population structure. Evolution 38:1358–1370. doi:10.2307/2408641