Società Informazioni Esperienze Termoidrauliche Via Nino Bixio, 27 - 29100 Piacenza (I)
Unità di Produzione Production Unit CLIENTE: Client : ENEA COMMESSA: job: 1PN000CA90245 DISCO: disk CA90245/1 PAGINA: page: 1 DI: of 164 IDENTIFICATIVO: document: 01 525 ST 09 Classe Ris.: Confidential: ALLEGATI: Enclosures: TITOLO: Title:
SPES3 - TWO-PHASE MASS FLOW MEASUREMENTS: TECHNICAL SPECIFICATIONS
REDATTORI: S. Gandolfi, M. Greco
prepared by:
LISTA DI DISTRIBUZIONE
distribution list
ENEA Renato Tinti ENEA Fosco Bianchi SIET S.p.A. Andrea Achilli SIET S.p.A. Gustavo Cattadori SIET S.p.A. Stefano Gandolfi SIET S.p.A. Matteo Greco SIET S.p.A. Roberta Ferri SIET S.p.A. Gaetano Tortota SIET S.p.A. Cinzia Congiu
0 14/07/2010 Emissione S. Gandolfi M Greco G.Cattadori REV. Rev. DATA date DESCRIZIONE description REDAZIONE prepared by APPROVAZIONE approved by
Informazioni strettamente riservate di proprietà SIET SpA - Da non utilizzare per scopi diversi da quelli per cui sono state fornite. Confidential information property of SIET SpA - Not to be used for any purpose other than those for which it is supplied.
CONTENTS LIST OF TABLES... 5 LIST OF FIGURES ... 7 LIST OF ACRONYMS... 12 1 SCOPE... 13 2 INTRODUCTION... 14 3 MEASUREMENT NEEDS... 15 3.1 Thermalhydraulic parameters ... 15 3.2 Measurement location... 16
4 RELAP5 TRANSIENTS AND BREAK POSTIONS ... 18
5 VARIABLE RANGE IDENTIFICATION ... 34
5.1 DVI BREAK TEST ... 35
5.1.1 DVI DEG break line ... 35
5.1.1.1 Synthesis of achievements for the DVI DEG break... 44
5.1.2 DVI SPLIT break line ... 45
5.1.2.1 Synthesis of achievements for the DVI SPLIT break... 54
5.1.3 ADS lines... 55
5.1.3.1 Synthesis of achievements for the ADS lines... 56
5.2 EBT BREAK TEST ... 62
5.2.1 EBT DEG break line ... 62
5.2.1.1 Synthesis of achievements for the EBT DEG break... 71
5.2.2 EBT SPLIT break line ... 72
5.2.2.1 Synthesis of achievements for the EBT SPLIT break... 81
5.2.3 ADS lines... 82
5.2.3.1 Synthesis of achievements for the ADS lines... 83
5.3 ADS BREAK TEST ... 89
5.3.1 ADS ST DEG break line ... 89
5.3.1.1 Synthesis of achievements for the ADS ST DEG break... 98
5.3.2 ADS SPLIT break line ... 99
5.3.2.1 Synthesis of achievements for the ADS SPLIT break ... 108
5.3.3.1 Synthesis of achievements for the ADS lines... 110
5.4 SL BREAK TEST ... 114
5.4.1 SL DEG break line... 114
5.4.1.1 Synthesis of achievements for the SL DEG break ... 123
5.4.2 SL SPLIT break line ... 124
5.4.2.1 Synthesis of achievements for the SL SPLIT break ... 133
5.4.3 ADS lines... 133
5.5 FL BREAK TEST... 134
5.5.1 FL DEG break line ... 134
5.5.1.1 Synthesis of achievements for the FL DEG break... 143
5.5.2 FL SPLIT break line... 144
5.5.2.1 Synthesis of achievements for the FL SPLIT break ... 153
5.5.3 ADS lines... 153
6 INSTRUMENT ANALYTICAL CORRELATIONS AND PARAMETER RANGES ... 154
6.1 Mass flow correlations... 154
6.2 Parameter ranges ... 155
6.3 Spool piece instrument correlations ... 155
7 CONCLUSIONS... 163
LIST OF TABLES
Table 4.1: Base cases for the SPES3 break transients 18
Table 5.1: List of the RELAP5 volumes for the DVI DEG break 35 Table 5.2: Maximum and minimum values of the main variables in the 38 Table 5.3: Maximum and minimum values of the main variables in the 42 Table 5.4: Flow regimes function of monitoring volumes and time – DVI DEG LINE 43 Table 5.5: Description of the volumes for the DVI SPLIT break 45 Table 5.6: Maximum and minimum values of the main variables in the 48 Table 5.7: Maximum and minimum values of the main variables in the 52 Table 5.8: Flow regimes function of monitoring volumes and time – DVI SPLIT LINE 53 Table 5.9: Maximum and minimum values of the void fraction and mass flow in the 55 Table 5.10: Maximum and minimum values of the main variables in the 61 Table 5.11: Maximum and minimum values of the main variables in the 61 Table 5.12: Description of the volumes for the EBT DEG break 62 Table 5.13: Maximum and minimum values of the main variables in the 65 Table 5.14: Maximum and minimum values of the main variables in the 69 Table 5.15: Flow regimes function of monitoring volumes and time – EBT DEG line 70 Table 5.16: Description of the volumes for the EBT SPLIT break 72 Table 5.17: Maximum and minimum values of the main variables in the 75 Table 5.18: Maximum and minimum values of the main variables in the 79 Table 5.19: Flow regimes function of monitoring volumes and time – EBT SPLIT LINE 80 Table 5.20: Maximum and minimum values of the void fraction and mass flow in the 82 Table 5.21: Maximum and minimum values of the main variables in the 88 Table 5.22: Maximum and minimum values of the main variables in the 88 Table 5.23: Description of the volumes for the ADS ST DEG break 89 Table 5.24: Maximum and minimum values of the main variables in the 92 Table 5.25: Maximum and minimum values of the main variables in the 96 Table 5.26: Flow regimes function of monitoring volumes and time – ADS ST DEG LINE 97 Table 5.27: Description of the volumes for the ADS ST SPLIT break 99 Table 5.28: Maximum and minimum values of the main variables in the 102 Table 5.29: Maximum and minimum values of the main variables in the 106
Table 5.30: Flow regimes function of monitoring volumes and time – ADS ST SPLIT LINE 107 Table 5.31: Maximum and minimum values of the void fraction and mass flow in the 109 Table 5.32: Maximum and minimum values of the main variables in the 113 Table 5.33: Description of the volumes for the SL-B DEG break 114 Table 5.34: Maximum and minimum values of the main variables in the 117 Table 5.35: Maximum and minimum values of the main variables in the 121 Table 5.36: Flow regimes function of monitoring volumes and time – SL-B DEG LINE 122 Table 5.37: Description of the volumes for the SL-B SPLIT break 124 Table 5.38: Maximum and minimum values of the main variables in the 127 Table 5.39: Maximum and minimum values of the main variables in the 131 Table 5.40: Flow regimes function of monitoring volumes and time – SL-B SPLIT LINE 132 Table 5.41: Description of the volumes for the FL-B DEG break 134 Table 5.42: Maximum and minimum values of the main variables in the 137 Table 5.43: Maximum and minimum values of the main variables in the 141 Table 5.44: Flow regimes function of monitoring volumes and time – FL-B DEG LINE 142 Table 5.45: Description of the volumes for the FL-B SPLIT break 144 Table 5.46: Maximum and minimum values of the main variables in the 147 Table 5.47: Maximum and minimum values of the main variables in the 151 Table 5.48: Flow regimes function of monitoring volumes and time – FL-B SPLIT LINE 152 Table 6.1: Two-phase parameters and measurement instruments 155
Table 6.2: DVI SPLIT break line 158
Table 6.3: EBT SPLIT break line 159
Table 6.4: ADS SPLIT break line 160
Table 6.5: ADS ST Stage-I line 161
LIST OF FIGURES
Figure 3.1: SPES3 facility general view ... 17
Figure 4.1: SPES3 DVI Break line – Flow Sheet – Steady state conditions ... 19
Figure 4.2: SPES3 DVI Break line – Flow Sheet – Transient conditions ... 19
Figure 4.3: SPES3 ADS lines – Flow Sheet – Steady state conditions. ... 20
Figure 4.4: SPES3 ADS lines – Flow Sheet – Transient conditions ... 21
Figure 4.5: SPES3 DVI break line system ... 22
Figure 4.6: SPES3 DVI-B break line nodalization ... 23
Figure 4.7: SPES3 EBT-B break line system... 24
Figure 4.8: SPES3 EBT-B break line nodalization ... 25
Figure 4.9: SPES3 FL-B break line system ... 26
Figure 4.10: SPES3 FL-B break system nodalization ... 26
Figure 4.11: SPES3 SL-B break system ... 27
Figure 4.12: SPES3 SL-B break system nodalization... 28
Figure 4.13: SPES3 ADS-ST Stage-I break line system ... 29
Figure 4.14: SPES3 ADS group of pipes and ADS break lines ... 30
Figure 4.15: SPES3 ADS single and double train nodalization (front view)... 31
Figure 4.16: SPES3 ADS single train and ADS break line nodalization (top view)... 32
Figure 4.17: SPES3 ADS double train nodalization (top view) ... 33
Figure 5.1: DVI DEG BREAK LINE Mass flowrate... 36
Figure 5.2: DVI DEG BREAK LINE liquid and gas velocities UPSTREAM ... 36
Figure 5.3: DVI DEG BREAK LINE pressure UPSTREAM ... 37
Figure 5.4: DVI DEG BREAK LINE liquid and gas temperatures UPSTREAM... 37
Figure 5.5: DVI DEG BREAK LINE void fraction and quality UPSTREAM ... 38
Figure 5.6: DVI DEG BREAK LINE liquid and gas velocities DOWNSTREAM... 39
Figure 5.7: DVI DEG BREAK LINE pressure DOWNSTREAM ... 40
Figure 5.8: DVI DEG BREAK LINE liquid and gas temperatures DOWNSTREAM ... 40
Figure 5.9: DVI DEG BREAK LINE void fraction and quality DOWNSTREAM... 41
Figure 5.10: DVI DEG BREAK LINE volumetric flowrate DOWNSTREAM... 41
Figure 5.12: DVI SPLIT BREAK LINE liquid and gas velocities UPSTREAM... 46
Figure 5.13: DVI SPLIT BREAK LINE pressure UPSTREAM... 47
Figure 5.14: DVI SPLIT BREAK LINE liquid and gas temperatures UPSTREAM ... 47
Figure 5.15: DVI SPLIT BREAK LINE void fraction and quality UPSTREAM ... 48
Figure 5.16: DVI SPLIT BREAK LINE liquid and gas velocities DOWNSTREAM ... 49
Figure 5.17: DVI SPLIT BREAK LINE pressure DOWNSTREAM ... 50
Figure 5.18: DVI SPLIT BREAK LINE liquid and gas temperatures DOWNSTREAM ... 50
Figure 5.19: DVI SPLIT BREAK LINE void fraction and quality DOWNSTREAM... 51
Figure 5.20: DVI SPLIT BREAK LINE volumetric flowrate DOWNSTREAM ... 51
Figure 5.21: DVI TEST, ADS ST (Stage-I) LINE void fraction UPSTREAM ... 57
Figure 5.22: DVI TEST, ADS ST (Stage-I) LINE void fraction DOWNSTREAM ... 57
Figure 5.23: DVI TEST, ADS ST (Stage-I) LINE mass flow... 58
Figure 5.24: DVI TEST, ADS DT (Stage-I) LINE void fraction UPSTREAM ... 58
Figure 5.25: DVI TEST, ADS DT (Stage-I) LINE void fraction DOWNSTREAM... 59
Figure 5.26: DVI TEST, ADS DT (Stage-I) LINE mass flow... 59
Figure 5.27: DVI TEST, ADS ST (Stage-I) LINE volumetric flowrate DOWNSTREAM ... 60
Figure 5.28: DVI TEST, ADS DT (Stage-I) LINE volumetric flowrate DOWNSTREAM ... 60
Figure 5.29: EBT DEG BREAK LINE mass flowrate... 63
Figure 5.30: EBT DEG BREAK LINE liquid and gas velocities UPSTREAM ... 63
Figure 5.31: EBT DEG BREAK LINE pressure UPSTREAM ... 64
Figure 5.32: EBT DEG BREAK LINE liquid and gas temperatures UPSTREAM... 64
Figure 5.33: EBT DEG BREAK LINE void fraction and quality UPSTREAM ... 65
Figure 5.34: EBT DEG BREAK LINE liquid and gas velocities DOWNSTREAM... 66
Figure 5.35: EBT DEG BREAK LINE pressure DOWNSTREAM... 67
Figure 5.36: EBT DEG BREAK LINE liquid and gas temperatures DOWNSTREAM ... 67
Figure 5.37: EBT DEG BREAK LINE void fraction and quality DOWNSTREAM... 68
Figure 5.38: EBT DEG BREAK LINE volumetric flowrate DOWNSTREAM ... 68
Figure 5.39: EBT SPLIT BREAK LINE mass flowrate ... 73
Figure 5.40: EBT SPLIT BREAK LINE liquid and gas velocities UPSTREAM... 73
Figure 5.41: EBT SPLIT BREAK LINE pressure UPSTREAM... 74
Figure 5.42: EBT SPLIT BREAK LINE liquid and gas temperatures UPSTREAM ... 74
Figure 5.44: EBT SPLIT BREAK LINE liquid and gas velocities DOWNSTREAM ... 76
Figure 5.45: EBT SPLIT BREAK LINE pressure DOWNSTREAM ... 77
Figure 5.46: EBT SPLIT BREAK LINE liquid and gas temperatures DOWNSTREAM ... 77
Figure 5.47: EBT SPLIT BREAK LINE void fraction and quality DOWNSTREAM... 78
Figure 5.48: EBT SPLIT BREAK LINE volumetric flowrate DOWNSTREAM ... 78
Figure 5.49: EBT TEST, ADS ST (Stage-I) LINE void fraction UPSTREAM ... 84
Figure 5.50: EBT TEST, ADS ST (Stage-I) LINE void fraction DOWNSTREAM ... 84
Figure 5.51: EBT TEST, ADS ST (Stage-I) LINE mass flow... 85
Figure 5.52: EBT TEST, ADS DT (Stage-I) LINE void fraction UPSTREAM ... 85
Figure 5.53: EBT TEST, ADS DT (Stage-I) LINE void fraction DOWNSTREAM... 86
Figure 5.54: EBT TEST, ADS DT (Stage-I) LINE mass flow... 86
Figure 5.55: EBT TEST, ADS ST (Stage-I) LINE volumetric flowrate DOWNSTREAM ... 87
Figure 5.56: EBT TEST, ADS DT (Stage-I) LINE volumetric flowrate DOWNSTREAM ... 87
Figure 5.57: ADS ST DEG BREAK LINE mass flowrate... 90
Figure 5.58: ADS ST DEG BREAK LINE liquid and gas velocities UPSTREAM ... 90
Figure 5.59: ADS ST DEG BREAK LINE pressure UPSTREAM ... 91
Figure 5.60: ADS ST DEG BREAK LINE liquid and gas temperatures UPSTREAM... 91
Figure 5.61: ADS ST DEG BREAK LINE void fraction and quality UPSTREAM ... 92
Figure 5.62: ADS ST DEG BREAK LINE liquid and gas velocities DOWNSTREAM... 93
Figure 5.63: ADS ST DEG BREAK LINE pressure DOWNSTREAM... 94
Figure 5.64: ADS ST DEG BREAK LINE liquid and gas temperatures DOWNSTREAM ... 94
Figure 5.65: ADS ST DEG BREAK LINE void fraction and quality DOWNSTREAM... 95
Figure 5.66: ADS ST DEG BREAK LINE volumetric flowrate DOWNSTREAM... 95
Figure 5.67: ADS ST SPLIT BREAK LINE mass flowrate ... 100
Figure 5.68: ADS ST SPLIT BREAK LINE liquid and gas velocities UPSTREAM... 100
Figure 5.69: ADS ST SPLIT BREAK LINE pressure UPSTREAM... 101
Figure 5.70: ADS ST SPLIT BREAK LINE liquid and gas temperatures UPSTREAM ... 101
Figure 5.71: ADS ST SPLIT BREAK LINE void fraction and quality UPSTREAM ... 102
Figure 5.72: ADS ST SPLIT BREAK LINE liquid and gas velocities DOWNSTREAM ... 103
Figure 5.73: ADS ST SPLIT BREAK LINE pressure DOWNSTREAM ... 104
Figure 5.74: ADS ST SPLIT BREAK LINE liquid and gas temperatures DOWNSTREAM ... 104
Figure 5.76: ADS ST SPLIT BREAK LINE volumetric flowrate DOWNSTREAM ... 105
Figure 5.77: ADS TEST, ADS DT (stage I) LINE void fraction UPSTREAM... 111
Figure 5.78: ADS TEST, ADS DT (stage I) LINE void fraction DOWNSTREAM ... 111
Figure 5.79: ADS TEST, ADS DT (stage I) LINE mass flow... 112
Figure 5.80: ADS TEST, ADS DT (stage I) LINE volumetric flowrate DOWNSTREAM ... 112
Figure 5.81: SL-B DEG BREAK LINE mass flowrate UPSTREAM... 115
Figure 5.82: SL-B DEG BREAK LINE liquid and gas velocities UPSTREAM ... 115
Figure 5.83: SL-B DEG BREAK LINE pressure UPSTREAM ... 116
Figure 5.84: SL-B DEG BREAK LINE liquid and gas temperatus UPSTREAM... 116
Figure 5.85: SL-B DEG BREAK LINE void fraction and quality UPSTREAM ... 117
Figure 5.86: SL-B DEG BREAK LINE liquid and gas velocities DOWNSTREAM... 118
Figure 5.87: SL-B DEG BREAK LINE pressure DOWNSTREAM... 119
Figure 5.88: SL-B DEG BREAK LINE liquid and gas temperatures DOWNSTREAM ... 119
Figure 5.89: SL-B DEG BREAK LINE void fraction and quality DOWNSTREAM... 120
Figure 5.90: SL-B DEG BREAK LINE volumetric flowrate DOWNSTREAM ... 120
Figure 5.91: SL-B SPLIT BREAK LINE mass flowrate ... 125
Figure 5.92: SL-B SPLIT BREAK LINE liquid and gas velocities UPSTREAM... 125
Figure 5.93: SL-B SPLIT BREAK LINE pressure UPSTREAM... 126
Figure 5.94: SL-B SPLIT BREAK LINE liquid and gas temperatures UPSTREAM ... 126
Figure 5.95: SL-B SPLIT BREAK LINE void fraction and quality UPSTREAM ... 127
Figure 5.96: SL-B SPLIT BREAK LINE liquid and gas velocities DOWNSTREAM ... 128
Figure 5.97: SL-B SPLIT BREAK LINE pressure DOWNSTREAM ... 129
Figure 5.98: SL-B SPLIT BREAK LINE liquid and gas temperatures DOWNSTREAM ... 129
Figure 5.99: SL-B SPLIT BREAK LINE void fraction and quality DOWNSTREAM... 130
Figure 5.100: SL-B SPLIT BREAK LINE volumetric flowrate DOWNSTREAM ... 130
Figure 5.101: FL-B DEG BREAK LINE mass flowrate ... 135
Figure 5.102: FL-B DEG BREAK LINE liquid and gas velocities UPSTREAM ... 135
Figure 5.103: FL-B DEG BREAK LINE pressure UPSTREAM ... 136
Figure 5.104: FL-B DEG BREAK LINE liquid and gas temperatures UPSTREAM... 136
Figure 5.105: FL-B DEG BREAK LINE void fraction and quality UPSTREAM ... 137
Figure 5.106: FL-B DEG BREAK LINE liquid and gas velocities DOWNSTREAM... 138
Figure 5.108: FL-B DEG BREAK LINE liquid and gas temperatures DOWNSTREAM ... 139
Figure 5.109: FL-B DEG BREAK LINE void fraction and quality DOWNSTREAM ... 140
Figure 5.110: FL-B DEG BREAK LINE volumetric flowrate DOWNSTREAM... 140
Figure 5.111: FL-B SPLIT BREAK LINE mass flowrate... 145
Figure 5.112: FL-B SPLIT BREAK LINE liquid and gas velocities UPSTREAM ... 145
Figure 5.113: FL-B SPLIT BREAK LINE pressure UPSTREAM ... 146
Figure 5.114: FL-B SPLIT BREAK LINE liquid and gas temperatures UPSTREAM... 146
Figure 5.115: FL-B SPLIT BREAK LINE void fraction and quality UPSTREAM ... 147
Figure 5.116: FL-B SPLIT BREAK LINE liquid and gas velocities DOWNSTREAM... 148
Figure 5.117: FL-B SPLIT BREAK LINE pressure DOWNSTREAM ... 149
Figure 5.118: FL-B SPLIT BREAK LINE liquid and gas temperatures DOWNSTREAM ... 149
Figure 5.119: FL-B SPLIT BREAK LINE void fraction and quality DOWNSTREAM... 150
LIST OF ACRONYMS
ADS Automatic Depressurization System ANM Annular mist
BBY Bubbly
CHF MPR mist pre-CHF
CV Containment Volume DBE Design Basis Event DEG Double Ended Guillotine DT Double Train
DVI Direct Vessel Injection
DW Dry Well
EBT Emergency Boration Tank EHRS Emergency Heat Removal System
FL Feed Line
HST Horizontal Stratified
LGMS Long Term Gravity Make-up System LOCA Loss of coolant Accident
LWR Light Water Reactor
PSS Pressure Suppression System RV Reactor Vessel
RC Reactor Cavity SG Steam Generator
SL Steam Line
SLG Slug
SPES Simulatore Per Esperienze di Sicurezza ST Single Train
1 SCOPE
The purposel of this document is to define the technical specifications for the choice of two-phase flow instrumentation to be installed on the SPES3 test facility.
To reach that goal, a detailed analysis of thermalhydraulic conditions in the plant locations where two-phase flow occurs has been done by using the RELAP5 numerical code.
2 INTRODUCTION
The SPES-3 facility is an integral simulator of the IRIS reactor, suitable to test the plant response to postulated design basis accidents and to provide experimental data for code validation and IRIS plant safety analyses [1].
The IRIS reactor is an advanced medium size nuclear reactor, based on the proven technology of Pressurized (Light) Water Reactors with an innovative integral configuration and safety features suitable to cope with Loss of Coolant Accidents through a dynamic coupling of the primary and containment systems. It is under design in the frame of an international consortium led by Westinghouse including industries, universities and research centers.
All the primary, secondary and containment systems are simulated in SPES3 with 1:100 volume and power scaling, 1:1 elevation scaling and the fluid at IRIS pressure and temperature nominal conditions [2].
A test matrix establishes the simulation of a series of SBLOCAs and secondary breaks which data will be fundamental for the certification process IRIS is going to undergo by the US-NRC [1].
The SBLOCA tests and the secondary side breaks foresee two-phase flow conditions in the pipes simulating the break flow paths, in critical flow during the early phases of the transients and driven by differential pressure in the later phases.
The measurements of two-phase flow have never been an easy task in the experimental thermalhydraulics and the need of such measures in the SPES3 facility has led to investigate different possibilities and evaluation methods to record mass flows and energies, in particular to focuse on the analysis of the thermalhydraulic conditions that occur in the interested pipe lines during the investigate transients.
Data obtained by the SPES3 facility simulation with the RELAP5 thermalhydraulic code and the execution of Design Basis Accident transients have provided the reference conditions to define the main thermalhydraulic parameter ranges and a selection of instruments suitable to measure them and derive the required quantities [3], [4].
3 MEASUREMENT NEEDS
3.1 Thermalhydraulic parameters
The thermalhydraulic parameters that need to be investigated in order to evaluate the behaviour of the SPES3 facility, Figure 3.1, and to identify the mass and energy balance in two-phase conditions are: - Temperature; - Pressure; - Mass flowrate; - Flow regimes; - Mixture quality; - Slip ratio.
In two-phase flow conditions, temperatures of the liquid and gas phases are different, since the thermal dynamic equilibrium is not preserved. Anyway, the RELAP5 pre-test analyses of the LOCA and break transients [4] demonstrate that the liquid vs. gas temperature difference is negligible. On the basis of the RELAP5 results, the fluid temperature will be measured by conventional instruments.
Pressure is one of the most fundamental parameters to be measured. The saturation temperature, enthalpy and density values depend on it. It will be measured by conventional instruments.
The two-phase mass flowrate cannot be directly measured by conventional instruments, e.g. Venturi or Coriolis meters that are usually utilised in single phase flow conditions. The need to limit intrusive measures and the occurrence of different flow regimes (bubbly, churn, annular, horizontal stratified) require special instrumentation, typically set up by two or more instruments. The knowledge of the flow regime is important in the definition of the instrument specifications.
The mixture quality is necessary to estimate the energy balance. A direct measurement of the steam quality is not possible, but it will be obtained by means of the slip ratio value and the mixture void fraction or the mixture density.
The mixture density can be measured by means of non or limited intrusive instruments as Wire Mesh or Capacitive Wire sensors or Gamma-ray densitometers.
Other quantities like mixture velocity, void fraction and momentum flux, necessary to obtain the final required quantity (two-phase mass flow), cannot be measured by conventional instruments and need to be derived by means of particular devices, namely spool piece, which allow to measure typical physical parameters in two-phase conditions.
The spool piece device consists in a set of heterogeneous instruments that give information to be correlated by means of analytical tools in order to have the main variables (mass flowrate, quality). The devices that constitute the spool piece must be able to resist to all the working conditions foreseen in the SPES facility.
Reference [5] reports the results of a research on possible instruments to measure the two-phase mass flow in the SPES3 facility. A series of criteria has been investigated to select such instruments up to identify a limited number of devices that can potentially satisfy the SPES3 requirements. This document starts from the achievements of reference [5] and defines the ranges of quantities to be measured towards a final selection of instruments.
3.2 Measurement location
The position for the break simulation in SPES3 are specified in [1] and shown in detail in [3] where details of the ADS lines are reported too. Break pipe lines and ADS lines represent a-priori the places where it is necessary to evaluate both mass flow and energy in two-phase conditions. Details of conditions coming from the analysis of the test matrix transients are summarized in section 6 of this document [1].
The special instrumentation, i.e. the spool piece, will be installed in the positions where the two-phase flow conditions are foreseen.
The pre-test analyses of the test matrix transients with the RELAP5 code allows the identification of those break lines where void fraction experiments significant values. The RELAP5 results of the transients are reported in [4]. The investigation of specific variables, properly selected among the set of output data of RELAP5 calculations, allows to identify the pipes with prevalently single-phase water or steam (measurable by conventional instruments, e.g. venturimeters or orifices) and those with a significant two-phase mass flow (necessarily measurable by spool pieces).
The lines identified in SPES3 where two-phase flow may occur are globally fourteen, including the break lines, split and DEG, and the ADS lines Stage-I and Stage-II [3].
In order to limit the number of installed spool pieces to those strictly necessary, it has been decided to establish criteria, in terms of parameters and range of evaluation, suitable to identify those incidents and lines where two-phase conditions are relevant. The details of this process are described in section 4 of this document.
Due to the high pressure in SPES3, upstream of the break valve (primary side pressure), it has been decided to install the spool piece downstream of the break valve (containment pressure). Anyway, a venturimeter will be installed on each line upstream of the break valve to measure the mass flow until the fluid remains single-phase (early phases of the transients), be it liquid or steam. Due to the presence of a calibrated orifice at the break valve and the pressure difference between primary and containment systems, a critical flow occurs at the breaks with strongly different velocity between the phases.
As the break lines are longer downstream than upstream of the valves, the spool piece installation in the longer part allows to limit the instrument impact on the flow profile.
RWSTAB
RWSTC
DW
RV
PSSA
RC
LGMSB
EBTB
QT
PSSB
EBTA
LGMSA
RWSTAB
RWSTC
DW
RV
PSSA
RC
LGMSB
EBTB
QT
PSSB
EBTA
LGMSA
Figure 3.1:SPES3 facility general view4 RELAP5 TRANSIENTS AND BREAK POSTIONS
Five base transient case simulations have been utilized to study the two-phase flow occurrence in the break lines and such transients have been chosen coherently with the test matrix [1] and reported in [4]. Such cases are simulated starting from full power steady conditions, in order to make easier the comparison between the facility and the IRIS plant calculation results. Due to a limitation on the available power at SIET laboratories, the actual SPES3 tests will be run starting from reduced power (65%) steady conditions, reducing accordingly the primary and secondary mass flows to have the same temperature difference between core inlet and outlet. This does not affect the break mass flow and related thermo-dynamic conditions, being the flow driven by the pressure difference, equal to the full power cases. On this basis, it is correct utilize the available RELAP results to investigate the break line flow conditions.
The investigated cases cover the main primary system LOCAs and secondary system breaks and the ADS lines are involved in the studied transients.
The five investigated base cases are shown inTable 4.1 [4].
Table 4.1: Base cases for the SPES3 break transients
RELAP base case number Case name Description
SPES 89 DVI break Double Ended Guillotine break of the Direct Vessel Injection Line B
SPES 90 EBT break Double Ended Guillotine break of the top connection between the Emergency Boration Tank and the Reactor Vessel B
SPES 91 ADS break Double Ended Guillotine break of the Automatic Depressurization System B, on the Single Train Line SPES 92 SL break Double Ended Guillotine break of the Steam Line B
SPES 93 FL break Double Ended Guillotine break of the Feed Line B
For each case, the Double Ended Guillotine (DEG) break is simulated, representing a complete severance of the pipe. The split break, perforation of the pipe without pipe axis movement, is foreseen in the test matrix but not yet simulated at the time of this work.
In the SPES3 facility, each break is constituted as follows:
- three valves;
- three lines: the main pipe and two break lines, SPLIT (RV side) and DEG (containment side).
During the steady state of operations, the two valves localized on the break lines are closed, whereas the valve on the main pipe is open, as shown in Figure 4.1.
Figure 4.1: SPES3 DVI Break line – Flow Sheet – Steady state conditions
The Figure 4.1 represents the connection between the RV and the RC by the DVI-B.
An analogous break system is used also for the EBT-B line and ADS lines and for the SL and FL breaks. The break lines (SPLIT and DEG) connect the RV to the containment at the same elevation of the pipe which rupture is being simulated, so the DVI and FL breaks exit in the RC, the EBT, ADS and FL breaks exit in the DW.
When a break occurs, the valves switch from “closed” to “open” and vice-versa and water mass and energy are transferred from the RV to the containment, as shown in Figure 4.2.
In general, during the steady state, the SPLIT break line, being directly connected to the RV, contains fluid at the primary conditions: water at DVI, EBT and FL and steam at the ADS and SL, while the DEG break lines contain fluid at the containment conditions (air).
The test matrix [1] indicates ten break test positions in which it is necessary to evaluate both mass flow and energy balance in two-phase flow conditions:
- DVI Split line break; - DVI DEG line break; - EBT Split line break; - EBT DEG line break; - ADS-ST Split line break; - ADS-ST DEG line break; - SL Split line break; - SL DEG line break; - FL Split line break; - FL DEG line break.
Moreover the two ADS trains (single and double train), each consisting of Stage-I and Stage-II, add four more lines that can experiment two-phase flow and water and gas mixture.
Each ADS line contains a valve. During the steady state such valves are close, as shown in Figure 4.3.
During a transient, when a high containment pressure signal occurs contemporarily to a low pressurizer pressure signal, the ADS Stage-I valves are opened while the ADS Stage-II open later following a low LGMS mass signal. The transient configuration for ADS is shown in Figure 4.4.
Figure 4.4: SPES3 ADS lines – Flow Sheet – Transient conditions
The RELAP5 results analyzed in this work are mainly related to the break lines, while the description of the whole transients is available in [4]. As all the five simulated transients are Double Ended Guillotine breaks, data for both the SPLIT and DEG lines are available.
The RELAP5 code allows for the determination of the flow main characteristics in each volume that is included in the nodalization [3].
For each break position, two different monitoring volumes were defined for the extraction of the variables necessary to set the instrument range. Such monitoring volumes are located upstream and downstream the valve with calibrated orifice that simulates the correct size of the break. The upstream monitor volume is always the one just before the break valve, in each test.
The downstream monitor volumes are chosen in the position where it is expected to install the spool piece where the pipe geometric discontinuities (e.g. bends) have little influence on the flow profile (straight pipe portion).
The preliminary check of the pre-test data, as reported in [4], highlighted the presence of two-phase condition in the ADS ST and DT lines (stage I and Stage-II), whenever such lines are in operation. This has led to select monitor volumes on such lines to investigate the problem. Due to the nodalization configuration, the valve downstream volume has been chosen together with an upstream volume on a straight portion of the pipe.
Among the others, flow regime data have been extracted from the RELAP5 results for each break line, considering in particular the downstream volumes sequence, in order to evaluate the flow pattern variation in the transient evolution.
Figure 4.5, Figure 4.6, Figure 4.7, Figure 4.8, Figure 4.9, Figure 4.10, Figure 4.11, Figure 4.12, Figure 4.13, Figure 4.14, Figure 4.15, Figure 4.16 and Figure 4.17 show the studied line configuration and the related RELAP5 nodalization [3].
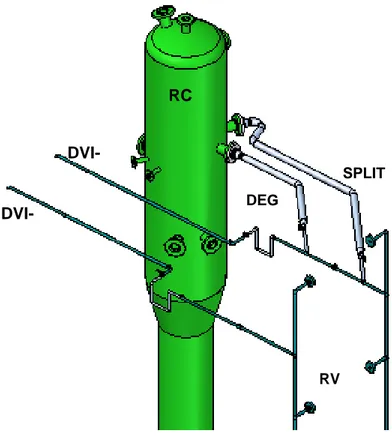
Figure 4.5: SPES3 DVI break line system RC DVI-RV SPLIT DEG
Figure 4.7: SPES3 EBT-B break line system SPLIT DEG DW RV EBT-B EBT-B to RV balance line
Figure 4.9: SPES3 FL-B break line system
Figure 4.10: SPES3 FL-B break system nodalization
FL break
DEG
SPLIT
RC
RV
FL-B
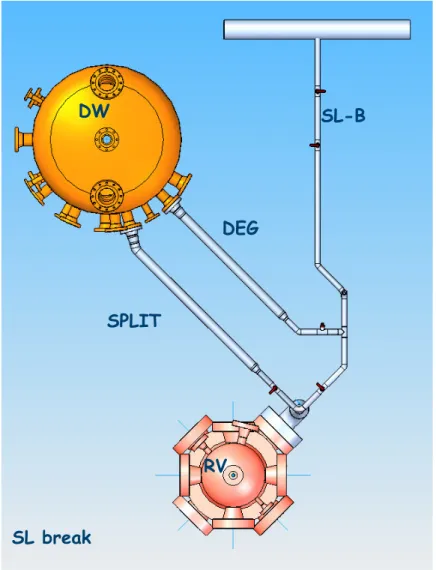
Figure 4.11: SPES3 SL-B break system
SPLIT
DEG
SL break
DW
RV
SL-B
Figure 4.13: SPES3 ADS-ST Stage-I break line system DW RV ADS Stage-I to QT ADS-DT Stage-II Stage-I Stage-I Stage-II ADS-ST SPLIT DEG
Figure 4.14: SPES3 ADS group of pipes and ADS break lines
RV
QT
ADS-STDW
ADS-DT ADS Stage-I Stage-II5 VARIABLE RANGE IDENTIFICATION
The aim of the RELAP5 result analyses, related to the break and ADS lines, is to investigate the two-phase thermal-hydraulic conditions in order to identify the variation ranges of the main parameters and to establish suitable criteria to decide where the spool-piece installation is necessary.
In order to investigate the flow conditions in positions where it is foreseen to install instrumentation, a series of monitoring volumes has been defined for each studied line, in particular a volume upstream of the break, the junction representing the break valve, a volume downstream of the break and a volume and the end of the pipe, at the connection with the containment tanks. Such volumes are listed in a proper table for each case.
The variables taken into consideration to analyse the trend of the thermal-hydraulic parameters during the transients are as follows:
- the void fraction and the quality; - the mass flow;
- the gas and liquid velocities; - the pressure;
- the gas and liquid temperatures.
The trends of these variables versus time are reported in five graphs for each break line. A table summarizes the maximum and minimum values of the considered variables.
The evolution of the flow regime in time and space, along the lines, is shown in two tables for the break upstream and downstream position, respectively.
A table points out the minimum and maximum values of the main parameters of the ADS single and double train, Stage-I and Stage-II, upstream and downstream of the valve. Moreover, further graphs shows the void fraction trend in the ADS ST and DT Stage-I.
Each test is described both for break line DEG and for break line SPLIT as follows: Five graphs for the main variables upstream of the break;
A table summarizing the maximum and minimum values of the variables; A table for the flow regimes in space and time upstream of the break; Five graphs for the main variables downstream of the break;
A table summarizing the maximum and minimum values of the variables; A table for the flow regimes in space and time downstream of the break;
A table for the maximum and minimum values of mass flowrate and void fraction in the ADS lines.
5.1 DVI BREAK TEST
A Design Basis Event is simulated with a 2 inch equivalent double ended guillotine (DEG) break on the DVI (DVI-B in the facility), but differently from the test matrix specification [1], all the safety systems are available: 3 ADS (ST and DT in SPES3), 2 EBT, 4 EHRS (EHRS-A, B and C in SPES3), 2 LGMS.
5.1.1 DVI DEG break line
The Errore. L'autoriferimento non è valido per un segnalibro. describes the nodalization of the DVI DEG BREAK line: one volume upstream of the valve, the junction (valve) that represents the break, nine volumes downstream of the valve and the nozzle before the tank (end of line). The main variables and the flow regimes have been taken in the volumes indicated by “*”.
Table 5.1: List of the RELAP5 volumes for the DVI DEG break
UPSTREAM VALVE DOWNSTRAM END OF LINE
675010000 (*) 676000000 677010000 677020000 677030000 677040000 677050000 677060000 677070000 (*) 677080000 677090000 678010000 UPSTREAM
The Figure 5.1, Figure 5.2, Figure 5.3, Figure 5.4 and Figure 5.5 represent the mass flowrate, the liquid and gas velocities, the pressure, the liquid and gas temperatures, the void fraction and the quality of the volume 675010000 upstream of the break in the DVI DEG line,
-0.1 0 0.1 0.2 0.3 0.4 0.5 0.6 0.7 0.8 0.01 0.1 1 10 time (s) 100 1000 10000 100000 kg /s
mflowj 676000000 mass flow
Figure 5.1: DVI DEG BREAK LINE Mass flowrate
-10 0 10 20 30 40 50 60 70 0.01 0.1 1 10 time (s) 100 1000 10000 100000 m/s
velf 675010000 liquid velocity velg 675010000 gas velocity
0 2 4 6 8 10 12 14 16 18 0.01 0.1 1 10 time (s) 100 1000 10000 100000 MP a p 675010000 pressure
Figure 5.3: DVI DEG BREAK LINE pressure UPSTREAM
300 350 400 450 500 550 600 650 0.01 0.1 1 10 time (s) 100 1000 10000 100000 K
tempf 675010000 liquid temperature tempg 675010000 gas temperature saturation temperature
-0.5 -0.3 -0.1 0.1 0.3 0.5 0.7 0.9 1.1 0.01 0.1 1 10 time(s) 100 1000 10000 100000
voidg 675010000 void fraction quale 675010000 quality
Figure 5.5: DVI DEG BREAK LINE void fraction and quality UPSTREAM
Table 5.2: Maximum and minimum values of the main variables in the DVI DEG break line upstream the valve
DVI DEG break line UPSTREAM MIN MAX
void fraction 0 1
volume equilibrium quality -0.9076 1.0429 mass flowrate kg/s -0.00047 0.7023 liquid velocity m/s -0.2459 27.7336 gas velocity m/s -1.3802 63.6599 liquid temperature K 308.4040 553.2080 gas temperature K 316.4240 618.6600 pressure MPa 0.1266 15.6391
The Table 5.2 shows the minimum and maximum values of void fraction, quality, mass flowrate, liquid and gas velocities, liquid and gas temperatures, pressure during the transient, upstream of the break.
DOWNSTREAM
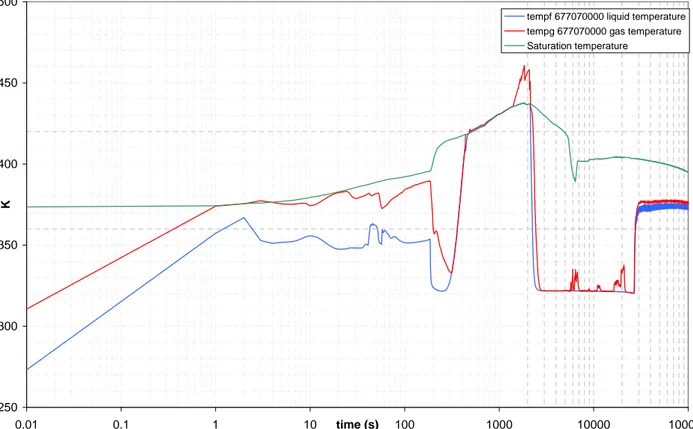
The Figure 5.6, Figure 5.7, Figure 5.8 and Figure 5.9 represent the liquid and gas velocities, the pressure, the liquid and gas temperatures, the void fraction and the quality in the volume 677070000, downstream of the break in the DVI DEG line. Figure 5.10 shows the volumetric flowrate calculated using the area of the pipe, the void fraction, the gas and liquid velocities.
The mass flowrate is not shown because it is the same downstream and upstream of the break.
-10 0 10 20 30 40 50 60 70 80 90 100 110 0.01 0.1 1 10 time (s) 100 1000 10000 100000 m/ s
velf 677070000 liquid velocity velg 677070000 gas velocity
0 0.1 0.2 0.3 0.4 0.5 0.6 0.7 0.8 0.01 0.1 1 10 time (s) 100 1000 10000 100000 MP a p 677070000 pressure
Figure 5.7: DVI DEG BREAK LINE pressure DOWNSTREAM
250 300 350 400 450 500 0.01 0.1 1 10 time (s) 100 1000 10000 100000 K
tempf 677070000 liquid temperature tempg 677070000 gas temperature Saturation temperature
-0.2 0 0.2 0.4 0.6 0.8 1 1.2 0.01 0.1 1 10 time (s) 100 1000 10000 100000
voidg 677070000 void fraction quale 677070000 quality
Figure 5.9: DVI DEG BREAK LINE void fraction and quality DOWNSTREAM
-0.05 0 0.05 0.1 0.15 0.2 0.25 0.3 0.01 0.1 1 10 100 1000 10000 100000 time (s) m 3 /s
Volumetric Flow Rate - Vol: 677070000
Figure 5.10: DVI DEG BREAK LINE volumetric flowrate DOWNSTREAM
The Table 5.3 shows the minimum and maximum values of void fraction, quality, mass flowrate, liquid and gas velocities, liquid and gas temperatures, pressure and volumetric flowrate during the transient, downstream of the break.
Table 5.3: Maximum and minimum values of the main variables in the DVI DEG break line downstream of the break
DVI DEG break line DOWNSTREAM MIN MAX
void fraction 0.5198 1
volume equilibrium quality -0.1303 1.028 mass flowrate kg/s -0.00047 0.70233 liquid velocity m/s -0.989 12.008 gas velocity m/s -0.360 93.778 liquid temperature K 320.28 437.50 gas temperature K 320.35 460.84 pressure MPa 0.1025 0.6902 volumetric flowrate m3/s -0.001 0.2882
The Table 5.4 describes the flow regimes in the volume before the break and in some volumes after the break. The time step changes only when there is a modification in the flow regime. The volumes highlighted in red indicate the monitoring points.
FLOW REGIMES
Table 5.4: Flow regimes function of monitoring volumes and time – DVI DEG LINE
Time 675010 677010 677030 677050 677070 677090 678010 0 BBY CHF MPR CHF MPR CHF MPR CHF MPR CHF MPR CHF MPR 1 BBY ANM ANM ANM ANM ANM ANM 2 HST ANM ANM ANM ANM ANM HST 7 HST ANM HST HST HST HST HST 54 HST HST HST HST HST HST HST 56 HST HST HST HST HST HST CHF MPR 184 HST HST HST HST HST HST HST 185 BBY HST HST HST HST HST HST 437 BBY BBY HST HST HST HST HST 454 BBY SLG HST HST HST HST HST 487 BBY ANM HST HST HST HST HST 488 HST ANM HST HST HST HST HST 490 SLG ANM HST HST HST HST HST 810 SLG ANM HST HST HST HST HST 1020 CHF MPR ANM HST HST HST HST HST 1390 HST ANM HST HST HST HST HST 1850 HST HST HST HST HST HST HST 1860 HST CHF MPR CHF MPR CHF MPR HST HST HST 1910 HST CHF MPR CHF MPR CHF MPR CHF MPR HST HST 1920 HST CHF MPR CHF MPR CHF MPR CHF MPR CHF MPR HST 1940 HST CHF MPR CHF MPR CHF MPR CHF MPR CHF MPR CHF MPR 2090 HST CHF MPR CHF MPR CHF MPR CHF MPR HST HST 2180 HST HST HST HST HST HST HST 2190 BBY HST HST HST HST HST HST 2200 BBY BBY HST HST HST HST HST 2210 BBY HST HST HST HST HST HST 2220 BBY BBY HST HST HST HST HST 2230 BBY HST HST HST HST HST HST 6690 BBY BBY HST HST HST HST HST 25790 BBY HST HST HST HST HST HST 99990 HST HST HST HST HST HST HST
5.1.1.1 Synthesis of achievements for the DVI DEG break
As indicated by Figure 5.3 and Table 5.2, pressure upstream of the break is very high (15.6 MPa), at least at the beginning of the transient, whereas pressure downstream of the break reaches a maximum 0.7 MPa, as shown in Figure 5.7. Therefore the installation of an eventual spool piece is suggested downstream of the break.
The void fraction varies between 0 and 1 as indicated in Figure 5.9 and Table 5.3 and the mass flowrate is appreciable as indicated in Figure 5.1 and Table 5.2. Anyway, the mass flowrate through the DEG line is due to water coming from the EBT and LGSM safety systems [4] and such single-phase mass flows are measured by orifices in the related injection lines.
This avoids the need to install a spool piece on the DVI DEG break line.
5.1.2 DVI SPLIT break line
The Errore. L'autoriferimento non è valido per un segnalibro. describes the nodalization of the DVI SPLIT BREAK line: one volume upstream the valve, the junction (valve) that represents the break, fourteen volumes downstream of the valve and the nozzle before the tank (end of line). The main variables and the flow regimes have been taken in the volumes indicated by “*”.
Table 5.5: Description of the volumes for the DVI SPLIT break
UPSTREAM MOTOR VALVE DOWNSTRAM END OF LINE
665010000 (*) 666000000 667010000 667020000 667030000 667040000 667050000 667060000 667070000 667080000 667090000 (*) 667100000 667110000 667120000 667130000 667140000 668010000 UPSTREAM
The Figure 5.11, Figure 5.12, Figure 5.13, Figure 5.14 and Figure 5.15 represent the mass flowrate, the liquid and gas velocities, the pressure, the liquid and gas temperatures, the void fraction and the quality of the volume 665010000 upstream of the break in the DVI SPLIT line.
-0.2 0 0.2 0.4 0.6 0.8 1 1.2 1.4 0.01 0.1 1 10 time (s) 100 1000 10000 100000 kg/ s
mflowj 666000000 mass flow
Figure 5.11: DVI SPLIT BREAK LINE mass flowrate
-20 0 20 40 60 80 100 120 140 160 0.01 0.1 1 10 time (s) 100 1000 10000 100000 m/ s
velf 665010000 liquid velocity velg 665010000 gas velocity
0 2 4 6 8 10 12 14 16 18 0.01 0.1 1 10 time (s) 100 1000 10000 100000 MPa p 665010000 pressure
Figure 5.13: DVI SPLIT BREAK LINE pressure UPSTREAM
300 350 400 450 500 550 600 650 0.01 0.1 1 10 time (s) 100 1000 10000 100000 K
tempf 665010000 liquid temperature tempg 665010000 gas temperature saturation temperature
-0.4 -0.2 0 0.2 0.4 0.6 0.8 1 1.2 0.01 0.1 1 10 time (s) 100 1000 10000 100000
voidg 665010000 void fraction quale 665010000 quality
Figure 5.15: DVI SPLIT BREAK LINE void fraction and quality UPSTREAM
Table 5.6: Maximum and minimum values of the main variables in the DVI SPLIT break line upstream the break
DVI SPLIT break line UPSTREAM MIN MAX
void fraction 0 0.9994
volume equilibrium quality -0.9012 0.9975 mass flowrate kg/s -0.1308 1.3328 liquid velocity m/s -4.0312 12.0997 gas velocity m/s -13.5510 154.1660 liquid temperature K 375.5650 593.3750 gas temperature K 375.5650 618.6600 pressure MPa 0.2102 15.6391
The Table 5.6 shows the minimum and maximum values of void fraction, quality, mass flowrate, liquid and gas velocities, liquid and gas temperatures, pressure during the transient, upstream of the break.
DOWNSTREAM
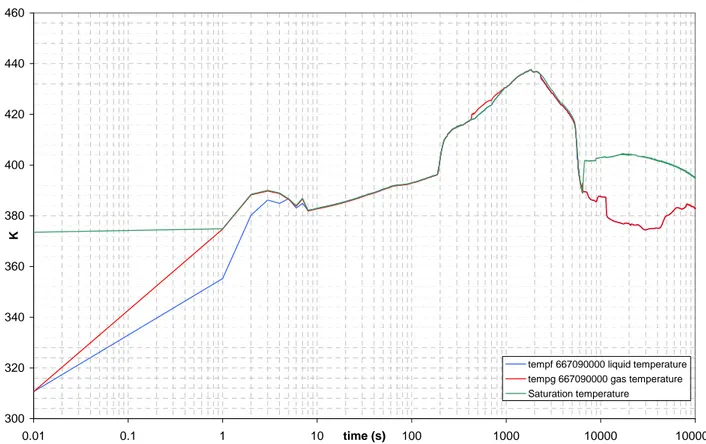
The Figure 5.16, Figure 5.17, Figure 5.18 and Figure 5.19 represent the liquid and gas velocities, the pressure, the liquid and gas temperatures, the void fraction and the quality in the volume 667090000 downstream of the break in the DVI SPLIT line. Figure 5.20 shows the volumetric flowrate calculated using the area of the pipe, the void fraction, the gas and liquid velocities.
The mass flowrate is not shown because it is the same downstream and upstream of the break.
-50 0 50 100 150 200 0.01 0.1 1 10 time (s) 100 1000 10000 100000 m/ s
velf 667090000 liquid velocity velg 667090000 gas velocity
0 0.1 0.2 0.3 0.4 0.5 0.6 0.7 0.8 0.01 0.1 1 10 time (s) 100 1000 10000 100000 MP a p 667090000 pressure
Figure 5.17: DVI SPLIT BREAK LINE pressure DOWNSTREAM
300 320 340 360 380 400 420 440 460 0.01 0.1 1 10 time (s) 100 1000 10000 100000 K
tempf 667090000 liquid temperature tempg 667090000 gas temperature Saturation temperature
-0.2 0 0.2 0.4 0.6 0.8 1 1.2 0.01 0.1 1 10 time (s) 100 1000 10000 100000
voidg 667090000 void fraction quale 667090000 quality
Figure 5.19: DVI SPLIT BREAK LINE void fraction and quality DOWNSTREAM
-0.1000000 0.0000000 0.1000000 0.2000000 0.3000000 0.4000000 0.5000000 0.01 0.1 1 10 100 1000 10000 100000 time (s) m 3/s
Volumetric Flow Rate - Vol: 667030000
Figure 5.20: DVI SPLIT BREAK LINE volumetric flowrate DOWNSTREAM
The Errore. L'autoriferimento non è valido per un segnalibro. shows the minimum and maximum values of void fraction, quality, mass flowrate, liquid and gas velocities, liquid and gas temperatures, pressure and volumetric flowrate during the transient, downstream the break.
Table 5.7: Maximum and minimum values of the main variables in the DVI SPLIT break line downstream of the break
DVI SPLIT break line DOWNSTREAM MIN MAX
void fraction 0** 1
volume equilibrium quality -0.0025 0.9997 mass flowrate kg/s -0.1308 1.3328 liquid velocity m/s -5.398 55.492 gas velocity m/s -0.922 187.888 liquid temperature K 355.25 437.51 gas temperature K 374.47 437.57 pressure MPa 0.1026 0.6902 volumetric flowrate m3/s -0.002 0.464
** At the end of the transient, after about 5000 seconds, the safety systems intervention leads to the covering of the break with water that starts to exit the rupture in liquid phase. The mass flowrate has to be estimated before the intervention, when the minimum value of the void fraction is 0.6256, as showed by Figure 5.19.
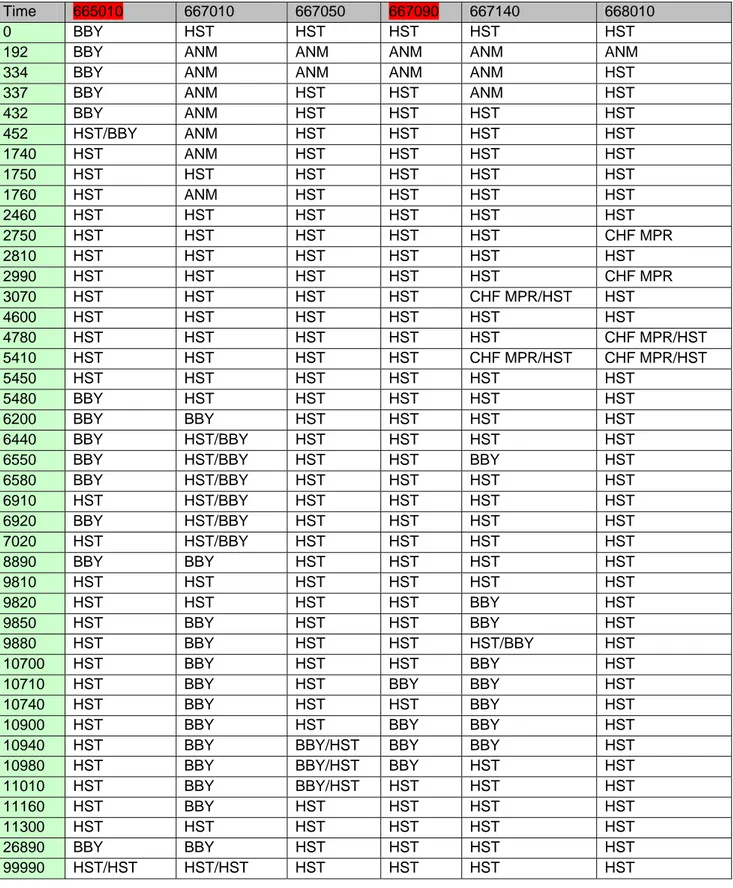
The Table 5.8 describes the flow regimes in the volume before the break and in some volumes after the break. The time step changes only when there is a modification in the flow regime. The volumes emphasized by red indicate the monitoring points.
FLOW REGIME
Table 5.8: Flow regimes function of monitoring volumes and time – DVI SPLIT LINE
Time 665010 667010 667050 667090 667140 668010
0 BBY HST HST HST HST HST
192 BBY ANM ANM ANM ANM ANM
334 BBY ANM ANM ANM ANM HST
337 BBY ANM HST HST ANM HST
432 BBY ANM HST HST HST HST 452 HST/BBY ANM HST HST HST HST 1740 HST ANM HST HST HST HST 1750 HST HST HST HST HST HST 1760 HST ANM HST HST HST HST 2460 HST HST HST HST HST HST 2750 HST HST HST HST HST CHF MPR 2810 HST HST HST HST HST HST 2990 HST HST HST HST HST CHF MPR 3070 HST HST HST HST CHF MPR/HST HST 4600 HST HST HST HST HST HST 4780 HST HST HST HST HST CHF MPR/HST 5410 HST HST HST HST CHF MPR/HST CHF MPR/HST 5450 HST HST HST HST HST HST 5480 BBY HST HST HST HST HST 6200 BBY BBY HST HST HST HST 6440 BBY HST/BBY HST HST HST HST
6550 BBY HST/BBY HST HST BBY HST
6580 BBY HST/BBY HST HST HST HST 6910 HST HST/BBY HST HST HST HST 6920 BBY HST/BBY HST HST HST HST 7020 HST HST/BBY HST HST HST HST 8890 BBY BBY HST HST HST HST 9810 HST HST HST HST HST HST 9820 HST HST HST HST BBY HST 9850 HST BBY HST HST BBY HST 9880 HST BBY HST HST HST/BBY HST 10700 HST BBY HST HST BBY HST
10710 HST BBY HST BBY BBY HST
10740 HST BBY HST HST BBY HST
10900 HST BBY HST BBY BBY HST
10940 HST BBY BBY/HST BBY BBY HST
10980 HST BBY BBY/HST BBY HST HST
11010 HST BBY BBY/HST HST HST HST
11160 HST BBY HST HST HST HST
11300 HST HST HST HST HST HST
26890 BBY BBY HST HST HST HST
5.1.2.1 Synthesis of achievements for the DVI SPLIT break
As indicated by Figure 5.13 and Table 5.6, pressure upstream of the break is very high (15.6 MPa), at least at the beginning of the transient, whereas pressure downstream of the break reaches at maximum 0.7 MPa, as shown in Figure 5.17. Therefore the installation of an eventual spool piece is suggested downstream of the break.
The void fraction, downstream of the break, varies between 0 and 1 as indicated in Figure 5.19 and The Errore. L'autoriferimento non è valido per un segnalibro. shows the minimum and maximum values of void fraction, quality, mass flowrate, liquid and gas velocities, liquid and gas temperatures, pressure and volumetric flowrate during the transient, downstream the break.
Table 5.7. Differently from the DVI DEG break line, water going out of the Reactor Vessel flows
through the DVI SPLIT break line and the mass flow value reaches a maximum of 1.33 Kg/s. Moreover a reflux from the containment to the RV is evidenced by a negative value of the mass flow (-0.13 Kg/s), as shown by Figure 5.11 and Table 5.6 [4].
Therefore the installation of a spool piece is planned for the DVI SPLIT line. The device will be located downstream of the break in the zone corresponding to volume 667090000 of the nodalization,
As indicated in Table 5.8, it will experiment three different flow regimes: annular mist, bubbly and horizontal stratified.
5.1.3 ADS lines
As detailed in [4], the DVI break transient foresees the ADS Stage-I lines opening to reduce pressure in the RV and anticipate the safety systems intervention to make-up water in the primary side. The ADS Stage-II lines open later in the transient, to improve the steam circulation between primary and containment systems in the upper part of the plant.
When the ADS Stage-I valves open, steam flows rapidly through the pipes sucking and entraining water from the PRZ. In this condition, a liquid fraction can flow through the pipes even if they are connected to the RV top, where steam is currently present.
The Table 5.9 describes the maximum and minimum values of mass flowrate and void fraction in the ADS single train and double train (stage I and II) during the DVI break test. These variables are essential to evaluate the possibility to apply a spool piece in these lines.
Table 5.9: Maximum and minimum values of the void fraction and mass flow in the ADS ST and DT (Stage-I and II) upstream and downstream of the valve (DVI break test)
DVI break test Volume MIN MAX
ADS ST Stage-I Void Fraction 152030000 Upstr. 0 1 ADS ST Stage-II Void Fraction 135020000 0 1 ADS DT Stage-I Void Fraction 142080000 0.8111 1 ADS DT Stage-II Void Fraction 132020000 0.0986 1
ADS ST Stage-I Void Fraction 134010000 Downst. 0** 1 ADS ST Stage-II Void Fraction 155010000 0.9943 1 ADS DT Stage-I Void Fraction 131010000 0.9633 1 ADS DT Stage-II Void Fraction 145010000 0.9967 1
ADS ST Stage-I Mass Flow kg/s 153000000 -0.1311 0.9082 ADS ST Stage-II Mass Flow kg/s 154000000 -0.0021 0.0079 ADS DT Stage-I Mass Flow kg/s 143000000 -0.0160 1.8389 ADS DT Stage-II Mass Flow kg/s 144000000 -0.0097 0.0153
** This value is due to the reflux of water sucked from the quench tank around 3000 seconds. The phenomenon lasts about 300 seconds. But this event, the minimum value of the void fraction is 0.9471.
The Figure 5.21 and Figure 5.22 represent the void fraction trend in the ADS ST Stage-I line, upstream and downstream of the break and Figure 5.23 represents the mass flow. Figure 5.24, Figure 5.25, and Figure 5.26 show the same variables in the ADS DT Stage-I line. The involved volumes are 152030000 (upstream) and 134010000 (downstream) for the ST and 142080000 (upstream) and 131010000 (downstream) for the DT, Figure 4.15, Figure 4.16, Figure 4.17. Figure
5.27
and
Figure 5.28 shows the volumetric flowrate calculated using the area of the pipe, the voidfraction, the gas and liquid velocities.
5.1.3.1 Synthesis of achievements for the ADS lines
ADS Stage-I
Table 5.9 shows that the mass flow is appreciable in the ADS ST and DT Stage I as well as the void fraction covers a wide range (0 – 1) in the same lines. This suggests to install a spool piece on each line. The devices will be located downstream of the valves in zones corresponding to volumes 134010000 and 131010000 for the ST and DT, respectively. Table 5.10 and Table 5.11 show the minimum and maximum values (mass and volumetric flowrate, quality, void fraction, temperature, pressure, liquid and gas velocities) in these volumes that are necessary to set the spool piece.
A Venturi meter will be installed upstream of the ADS ST and DT Stage-I valves.
ADS Stage-II
Table 5.9 shows that the mass flow is very little in both the ADS ST and DT Stage-II and also the void fraction excursions are limited around 1. For this reason no spool piece will be installed on such pipes.
-0.1 0 0.1 0.2 0.3 0.4 0.5 0.6 0.7 0.8 0.9 1 1.1 0.01 0.1 1 10 time (s) 100 1000 10000 100000
voidg 152030000 void fraction
Figure 5.21: DVI TEST, ADS ST (Stage-I) LINE void fraction UPSTREAM
0 0.2 0.4 0.6 0.8 1 1.2 0.01 0.1 1 10 time (s) 100 1000 10000 100000
voidg 134010000 void fraction
-0.2 0 0.2 0.4 0.6 0.8 1 0.01 0.1 1 10 time (s) 100 1000 10000 100000 kg /s
mflowj 153000000 mass flow
Figure 5.23: DVI TEST, ADS ST (Stage-I) LINE mass flow
0 0.2 0.4 0.6 0.8 1 1.2 0.01 0.1 1 10 time (s) 100 1000 10000 100000
voidg 142080000 void fraction
0.96 0.965 0.97 0.975 0.98 0.985 0.99 0.995 1 1.005 0.01 0.1 1 10 time (s) 100 1000 10000 100000
voidg 131010000 void fraction
Figure 5.25: DVI TEST, ADS DT (Stage-I) LINE void fraction DOWNSTREAM
-0.5 0 0.5 1 1.5 2 0.01 0.1 1 10 time (s) 100 1000 10000 100000 kg/ s
mflowj 143000000 mass flow
Volumetric Flow Rate - Vol: 134010000 -0.01 0 0.01 0.02 0.03 0.04 0.05 0.06 0.07 0.08 0.01 0.1 1 10 100 1000 10000 100000 time (s) m 3 /s
Volumetric Flow Rate - Vol: 134010000
Figure 5.27: DVI TEST, ADS ST (Stage-I) LINE volumetric flowrate DOWNSTREAM
-0.05 0 0.05 0.1 0.15 0.2 0.25 0.01 0.1 1 10 100 1000 10000 100000 time (s) m 3/s
Volumetric Flow Rate - Vol: 131010000
Table 5.10: Maximum and minimum values of the main variables in the ADS ST (Stage-I) downstream of the valve (DVI break test) DVI break test – ADS ST line
DOWNSTREAM MIN MAX
void fraction 0 1
volume equilibrium quality -0.0002 1.0533
mass flowrate kg/s -0.1311 0.9082 liquid velocity m/s -2.9735 25.6128 gas velocity m/s -2.9735 66.3613 liquid temperature K 273.16 489.34 gas temperature K 309.808 485.118 pressure MPa 0.1024 2.0163 volumetric flowrate m3/s -0.003 0.075
Table 5.11: Maximum and minimum values of the main variables in the ADS DT (Stage-I) downstream of the valve (DVI break test) DVI break test – ADS DT line
DOWNSTREAM MIN MAX
void fraction 0.9633 1
volume equilibrium quality 0.4111 1.0648
mass flowrate kg/s -0.0160 1.8389 liquid velocity m/s -2.4829 32.8595 gas velocity m/s -2.4829 76.6541 liquid temperature K 273.16 485.937 gas temperature K 311.396 487.184 pressure MPa 0.1024 1.7946 volumetric flowrate m3/s -0.008 0.236
5.2 EBT BREAK TEST
A Design Basis Event is simulated with a 4 inch equivalent double ended guillotine (DEG) break on the EBT to RV balance line (EBT-B in the facility), but differently from the test matrix specification [1], all the safety systems are available: 3 ADS (ST and DT in SPES3), 2 EBT, 4 EHRS (EHRS-A, B and C in SPES3), 2 LGMS.
5.2.1 EBT DEG break line
The Errore. L'autoriferimento non è valido per un segnalibro. describes the nodalization of the EBT DEG BREAK line: one volume upstream of the valve, the junction (valve) that represents the break, seven volumes downstream of the valve and the nozzle before the tank (end of line). The main variables and the flow regimes have been taken in the volumes indicated by “*”.
Table 5.12: Description of the volumes for the EBT DEG break
UPSTREAM MOTOR VALVE DOWNSTRAM NOZZLE
652010000 (*) 653000000 654010000 654020000 654030000 (*) 654040000 654050000 654060000 654070000 655010000 UPSTREAM
The Figure 5.29, Figure 5.30, Figure 5.31, Figure 5.32 and Figure 5.33 represent the mass flowrate, the liquid and gas velocities, the pressure, the liquid and gas temperatures, the void fraction and the quality of the volume 652010000 upstream of the break in the EBT DEG line, Figure 4.8.
-0.2 0 0.2 0.4 0.6 0.8 1 1.2 1.4 1.6 1.8 2 0.01 0.1 1 10 100 1000 10000 100000 time (s) kg /s
mflowj 65300000 mass flow
Figure 5.29: EBT DEG BREAK LINE mass flowrate
-20 -10 0 10 20 30 40 50 60 70 0.01 0.1 1 10 100 1000 10000 100000 time (s) m/ s
velf 652010000 liquid velocity velg 652010000 gas velocity
0 2 4 6 8 10 12 14 16 18 0.01 0.1 1 10 time (s) 100 1000 10000 100000 MPa p 652010000 pressure
Figure 5.31: EBT DEG BREAK LINE pressure UPSTREAM
0 100 200 300 400 500 600 700 0.01 0.1 1 10 time (s) 100 1000 10000 100000 K
tempf 652010000 liquid temperature tempg 652010000 gas temperature saturation temperature
-0.8 -0.6 -0.4 -0.2 0 0.2 0.4 0.6 0.8 1 1.2 0.01 0.1 1 10 100 1000 10000 100000 time (s)
voidg 652010000 void fraction quale 652010000 quality
Figure 5.33: EBT DEG BREAK LINE void fraction and quality UPSTREAM
Table 5.13: Maximum and minimum values of the main variables in the EBT DEG break line upstream of the valve
EBT DEG break line UPSTREAM MIN MAX
void fraction 0.0000 0.9997
volume equilibrium quality -1.4991 0.9964
mass flowrate kg/s -0.0122 1.7372 liquid velocity m/s -2.2831 6.5990 gas velocity m/s -10.4934 61.2530 liquid temperature K 314.0290 493.8590 gas temperature K 324.3550 618.0670 pressure MPa 0.1257 15.5245
The Table 5.13 shows the minimum and maximum values of void fraction, quality, mass flowrate, liquid and gas velocities, liquid and gas temperatures, pressure during the transient, upstream the break.
DOWNSTREAM
The Figure 5.34, Figure 5.35, Figure 5.36 and Figure 5.37 represent the liquid and gas velocities, the pressure, the liquid and gas temperatures, the void fraction and the quality in the volume 654030000, downstream of the break in the EBT DEG line, Figure 4.8. Figure 5.38 shows the volumetric flowrate calculated using the area of the pipe, the void fraction, the gas and liquid velocities.
The mass flowrate is not shown because it is the same downstream and upstream of the break.
-20 0 20 40 60 80 100 120 0.01 0.1 1 10 100 1000 10000 100000 time (s) m/s
velf 654030000 liquid velocity velg 654030000 gas velocity
0 0.1 0.2 0.3 0.4 0.5 0.6 0.7 0.8 0.9 0.01 0.1 1 10 time (s) 100 1000 10000 100000 MPa p 654030000 pressure
Figure 5.35: EBT DEG BREAK LINE pressure DOWNSTREAM
300 320 340 360 380 400 420 440 460 0.01 0.1 1 10 time (s) 100 1000 10000 100000 K
tempf 654030000 liquid temperature tempg 654030000 gas temperature Saturation temperature
-0.2 0 0.2 0.4 0.6 0.8 1 1.2 0.01 0.1 1 10 time (s) 100 1000 10000 100000
voidg 654030000 void fraction quale 654030000 quality
Figure 5.37: EBT DEG BREAK LINE void fraction and quality DOWNSTREAM
-0.02 0 0.02 0.04 0.06 0.08 0.1 0.01 0.1 1 10 time (s) 100 1000 10000 100000 m 3 /s
Volumetric Flow Rate - Vol: 654030000
The Errore. L'autoriferimento non è valido per un segnalibro. shows the minimum and maximum values of void fraction, quality, mass flowrate, liquid and gas velocities, liquid and gas temperatures, pressure and volumetric flowrate during the transient, downstream of the break.
Table 5.14: Maximum and minimum values of the main variables in the EBT DEG break line downstream of the break
EBT DEG break line DOWNSTREAM MIN MAX
void fraction 0.9011 1
volume equilibrium quality -0.045 1 mass flowrate kg/s -0.0122 1.7372 liquid velocity m/s -0.094 32.895 gas velocity m/s -3.037 97.203 liquid temperature K 335.79 441.42 gas temperature K 364.54 441.74 pressure MPa 0.102451 0.770127 volumetric flowrate m3/s -0.003 0.091
The Table 5.15 describes the flow regimes in the volume before the break and in some volumes after the break. The time step changes only when there is a modification in the flow regime. The volumes highlighted in red indicate the monitoring points.
FLOW REGIMES
Table 5.15: Flow regimes function of monitoring volumes and time – EBT DEG line
Time 652010000 654010000 654030000 654070000 655010000
0 BBY CHF MPR CHF MPR CHF MPR CHF MPR
2 BBY ANM ANM ANM ANM
1700 HST HST HST HST ANM 1720 HST SLG HST HST ANM 2040 HST HST HST HST HST 2310 HST HST HST HST CHF MPR 2370 HST HST HST HST HST 3240 HST HST HST HST CHF MPR 3620 HST HST HST HST HST 3640 HST HST HST HST CHF MPR 99990 HST HST HST HST HST
5.2.1.1 Synthesis of achievements for the EBT DEG break
As indicated by Figure 5.31 and Table 5.13, pressure upstream the break is very high (15.5 MPa), at least at the beginning of the transient, whereas pressure downstream of the break reaches a maximum of 0.77 MPa, as shown in Figure 5.35. Therefore the installation of an eventual spool piece is suggested downstream of the break.
Upstream of the break, the void fraction varies between 0 and 0.9997, being such line covered by water in the early phases of the transient, but uncovering soon when the RV level decreases for the LOCA [4], Figure 5.33 and Table 5.13. Downstream of the break, the void fraction is always high, between 0.9012 and 1, as shown in Figure 5.37 and The Errore. L'autoriferimento non è
valido per un segnalibro. shows the minimum and maximum values of void fraction, quality,
mass flowrate, liquid and gas velocities, liquid and gas temperatures, pressure and volumetric flowrate during the transient, downstream of the break.
Table 5.14. Moreover, as shown in Figure 5.29, the mass flowrate is appreciable only in the first
seconds of the transient and goes down to zero after 3 s. Consequently, the velocities downstream of the break are very low, as shown in Figure 5.34.
This avoids the need to install a spool piece on the EBT DEG break line.
5.2.2 EBT SPLIT break line
The Table 5.16 describes the nodalization of the EBT SPLIT BREAK line: one volume upstream of the valve, the junction (valve) that represents the break, seven volumes downstream of the valve and the nozzle before the tank (end of line). The main variables and the flow regimes have been taken in the volumes indicated by “*”.
Table 5.16: Description of the volumes for the EBT SPLIT break
UPSTREAM MOTOR VALVE DOWNSTRAM END OF LINE
622010000 (*) 643000000 644010000 644020000 644030000 (*) 644040000 644050000 644060000 644070000 645010000 UPSTREAM
The Figure 5.39, Figure 5.40, Figure 5.41, Figure 5.42 and Figure 5.43 represent the mass flowrate, the liquid and gas velocities, the pressure, the liquid and gas temperatures, the void fraction and the quality of the volume 622010000, upstream of the break in the EBT SPLIT line,
-1 0 1 2 3 4 5 0.01 0.1 1 10 time (s) 100 1000 10000 100000 kg/s
mflowj 643000000 mass flow
t
Figure 5.39: EBT SPLIT BREAK LINE mass flowrate
-40 -20 0 20 40 60 80 100 120 0.01 0.1 1 10 100 1000 10000 100000 time (s) m/ s
velf 622010000 liquid velocity velg 622010000 gas velocity
0 2 4 6 8 10 12 14 16 18 0.01 0.1 1 10 time (s) 100 1000 10000 100000 MPa p 622010000 pressure
Figure 5.41: EBT SPLIT BREAK LINE pressure UPSTREAM
300 350 400 450 500 550 600 650 0.01 0.1 1 10 time (s) 100 1000 10000 100000 K
tempf 622010000 liquid temperature tempg 622010000 gas temperature saturation temperature
-0.3 -0.1 0.1 0.3 0.5 0.7 0.9 1.1 0.01 0.1 1 10 100 1000 10000 100000 time (s)
voidg 622010000 void fraction quale 622010000 quality
Figure 5.43: EBT SPLIT BREAK LINE void fraction and quality UPSTREAM
Table 5.17: Maximum and minimum values of the main variables in the EBT SPLIT break line upstream of the break
EBT SPLIT break line UPSTREAM MIN MAX
void fraction 0.0000 1.0000
volume equilibrium quality -1.4991 1.0651 mass flowrate kg/s -0.0202 4.6686 liquid velocity m/s -17.2207 66.6764 gas velocity m/s -20.8762 106.1670 liquid temperature K 314.0370 600.3600 gas temperature K 406.3700 618.0670 pressure MPa 0.3417 15.5245
The Table 5.17 shows the minimum and maximum values of void fraction, quality, mass flowrate, liquid and gas velocities, liquid and gas temperatures, pressure during the transient, upstream the break.