SCIENTIFIC OPINION
Scientific Opinion on the environmental risk assessment of the apple snail
for the EU
1EFSA Panel on Plant Health (PLH)
2,3 European Food Safety Authority (EFSA), Parma, ItalyA
BSTRACTAt EFSA‘s request, the Plant Health Panel (PLH) performed an environmental risk assessment (ERA) of the apple snail for the EU and validated the ERA approach presented in the PLH ERA guidance document. Improvements and suggestions for simplification of the ERA are provided. One service-providing unit—shallow fresh water areas—was identified for this ERA. The effects of resistance, resilience and management on snail population dynamics in the short (5 years) and the long term (30 years) were estimated. In line with the PLH ERA guidance rating system, expert judgement was used to evaluate separately the impacts on (i) ecosystem traits, (ii) ecosystem services and (iii) biodiversity components. Snail biomass values were predicted to be higher in the short term than in the long term. For ecosystem services, moderate risk was estimated for genetic resources, climate regulation, pest and disease regulation and pollination in both the short and long term; for food, risk was assessed as moderate in the short term and major in the long term; for water and erosion regulation, risk was assessed as major both in the short term and in the long term; for fresh water, risk was assessed as massive both in the short term and in the long term; and for nutrient cycling and photosynthesis and primary production of macrophytes, risk was assessed as massive in the short term and as major in the long term. For biodiversity components, risk for genetic diversity and native species diversity was estimated as major in both the short and the long term; risk for native habitats was assessed massive in the short term and major in the long term; and for threatened species and habitats of high conservation value, risk was determined as massive in both the short and the long term.
© European Food Safety Authority, 2014
KEY WORDS
apple snail, Pomacea spp., environmental risk assessment, scenario analysis, ecosystem traits, ecosystem services, biodiversity components
1 On request from EFSA, Question No EFSA-Q-2013-00739, adopted on 31 March 2014.
2 Panel members : Richard Baker, Claude Bragard, Thierry Candresse, Gianni Gilioli, Jean-Claude Grégoire, Imre Holb, Michael John Jeger, Olia Evtimova Karadjova, Christer Magnusson, David Makowski, Charles Manceau, Maria Navajas, Trond Rafoss, Vittorio Rossi, Jan Schans, Gritta Schrader, Gregor Urek, Johan Coert van Lenteren, Irene Vloutoglou, Wopke van der Werf and Stephan Winter. Correspondence: [email protected]
S
UMMARYThe European Food Safety Authority (EFSA) asked the Plant Health Panel (hereinafter referred to as the Panel) to deliver a scientific opinion on the risk the apple snail poses to the environment of the European Union (EU). The Panel was requested to review the current state of the art of the biology and ecology of apple snails of the genus Pomacea, and to perform an environmental risk assessment (ERA) using the invasive species of Pomacea as a case study for validating the Panel‘s guidance document on ERA (EFSA PLH Panel, 2011), hereinafter referred to as PLH ERA guidance. This was also deemed necessary since the Spanish pest risk analysis (Spanish Ministry of Environment and Rural and Marine Affairs, 2011) did not sufficiently address the environmental impacts of the apple snail (EFSA PLH Panel, 2012a).
In this scientific opinion, when the Panel refers to the apple snail, it refers specifically to
Pomacea maculata and to P. canaliculata. As these species are closely related, their population
dynamics pattern and potential impacts are assumed by the Panel to be similar.
In this document, the Panel presents the ERA of the apple snail for the EU territory, including an analysis and evaluation of the risk assessment methodology applied to the apple snail. In EFSA PLH Panel (2013), the Panel reviewed the current state of the art of the biology and ecology of the apple snail and used a population dynamics model to assess its establishment in terms of density distribution in Europe. The Panel used these results as a starting point for performing the ERA.
Conclusions concerning the methodological approach and its simplification
The PLH ERA guidance includes a detailed procedure with different consecutive steps to assess the impacts of plant pests on ecosystem traits, ecosystem services and biodiversity components. In the current opinion, when performing the assessment, the complete PLH ERA approach was tested to evaluate the different steps described in the ERA guidance. Some aspects of the guidance were modified to improve it, and suggestions were made to simplify the approach and to make it more flexible.
In this opinion, the results obtained by the population dynamics model developed for P. canaliculata (EFSA PLH Panel, 2013) are summarised to describe the potential establishment and population density of the apple snail in different areas of Europe. However, in the current opinion, the Panel assessed snail population densities not in terms of number of eggs, juveniles and adults, but instead using a snail biomass index to represent density, which combines the fresh weights of the snail stages and supports the evaluations of the impacts on ecosystem services and biodiversity.
Definition of the service-providing unit
In the Pomacea case study, only one service-providing unit (SPU) was identified, i.e. shallow fresh water areas containing macrophytes, such as wetlands, shallow lakes, river deltas and the littoral zone of deeper lakes and rivers, which simplified and shortened the assessment, consequently decreasing its complexity.
Temporal, spatial and biomass scales and the influence of resistance, resilience and management
In this assessment, only the area of potential establishment as predicted by the population dynamics model was taken into account. The influence and the time variability of resistance, resilience and management led to the consideration of two different scenarios for this case, a short-term assessment 5 years after establishment (main influence: resistance of the ecosystem) and a long-term assessment 30 years after establishment (main influence: resilience).
between 1 and 5 (minimal to massive). Experts first individually provided their ratings including the uncertainties, then discussed their ratings and agreed on final ratings. This procedure improved the accuracy of the ratings and reduced the uncertainty in some cases.
Changes made in the ERA approach applied for the Pomacea case
Creating traits–ecosystem services clusters as described in the PLH ERA guidance was found to be very complex. Therefore, the impacts on ecosystem traits, ecosystem services and biodiversity were assessed in a direct, separate evaluation using expert judgement. This procedure also reduced uncertainty, because at least some scientific evidence could be provided. To homogenise and simplify the approach, impacts on biodiversity and ecosystem services were assessed and rated in the same way. Since the ERA is based on a scenario analysis, an assessment of the area of origin is not considered logical, because scenarios are based on the biomass that is predicted for the risk assessment area by the population dynamics model and the impacts that are expected.
Simplification of ERA
The Panel does not propose to perform a detailed ERA in all cases. Therefore, before starting an ERA, it is essential to define the level at which the assessment should or needs to be conducted. Suggestions for different ways to implement the ERA are presented in the Section ‗Recommendations‘.
Conclusions concerning environmental risks posed by Pomacea
According to the population dynamics model (EFSA PLH Panel, 2013) the area of potential establishment of Pomacea comprises wetlands of southern Europe (i.e. Spain, southern France, most of Italy and Greece) and the Balkans up to the latitude of the Danube River.
High potential biomass values (more than 20 g/m² in snail fresh weight) are predicted for a large number of coastal and inland Mediterranean locations, but realised biomass values were smaller (84 % of the potential biomass at the 5 years time horizon and 40 % of the potential biomass at the 30 years time horizon) after application of the scaling factors (resistance, resilience and management). The average realised snail biomass after 30 years is lower than after 5 years, because it is expected that (i) macrophytes that are non-palatable to Pomacea will replace palatable macrophytes, which will largely disappear, and (ii) natural enemies may reduce the apple snail density more efficiently at the longer time horizon.
The Panel assessed the effect of snail biomass on a number of ecosystem traits and assessed the impact of snail invasion on the ecosystem services in the worst-case scenario. In the context of the current ERA, considering that the driving force of the ecosystem change is apple snail biomass, some services are not expected to be modified, and only a selection of the provisioning services and regulating– supporting services have been retained for evaluation. The Panel also assessed the impact of snail invasion on biodiversity in the worst-case scenario, for both structural and conservation components. In order to systematically assess the impact of snail invasion on the ecosystem services and biodiversity components, a number of traits–services clusters and traits–biodiversity components clusters have been schematised by the Panel. For each ecosystem service and biodiversity component, the risk was calculated in both the short and the long term.
With regard to the ecosystem services, the Panel concludes that the presence of the apple snail results in a moderate risk for genetic resources, climate regulation, pest and disease regulation and pollination in both the short and the long term. The risk for food is moderate in the short term and major in the long term. The risk for water regulation and erosion regulation is major in both the short and the long term. The risk for fresh water is massive in both the short and the long term. The risk for nutrient cycling and photosynthesis and primary production of macrophytes is massive in the short term and
For the biodiversity component, the Panel concludes that the presence of the apple snail results in a major risk for genetic diversity and native species diversity in both the short and the long term. For native habitat, the risk is massive in the short term and major in the long term. For threatened species and habitat of high conservation value, the risk is massive in both the short and the long term. In the worst case scenario, the overall effect of the snail invasion on the shallow freshwater wetlands of southern Europe is massive on the biodiversity in the short term and major in the long term.
In future work, the methodology used in this opinion to produce the maps of the spatial distribution of impact on some ecosystem traits, ecosystem services and biodiversity components could also be compared with maps of special wetland areas under Natura 2000 (Council Directive 92/43 EEC4). The
objective of this comparison would be to visualise the relevant habitats present in the assessment area that are potentially affected by the presence of the apple snail. However, to do this in a scientifically sound way, it would be necessary to relate these maps more clearly to the quantitative analysis of the impacts on ecosystem traits, ecosystem services and the biodiversity components of those habitats considered in the ERA.
Recommendations
The Panel recommends the following:
1. Consider the use of a population dynamics model to estimate both establishment and population density of emerging pests in the risk assessment area.
2. Use the population density to assess the impact of pests on ecosystem services and biodiversity.
3. Do not consider the area of origin of the pest, but focus the assessment on the risk assessment area, in accordance with the scenario(s) being developed for the risk assessment area.
4. Evaluate ecosystem traits, biodiversity components and ecosystem services directly without quantifying the interactions represented in the traits–services and traits–biodiversity clusters. 5. Assess impacts on ecosystem services and biodiversity in the same way.
6. Define the level at which an ERA needs to be conducted before starting the assessment by considering the following questions:
(a) How much and which relevant knowledge is available?
(b) What are the objectives of the risk assessor(s) for the ERA and on which level do they have to be addressed?
(c) Which resources are available to perform the ERA?
7. Consider a number of simplifications related to the description and selection of assumptions, the selection and the amount of detail to describe traits and ecosystem services, and the assessment of the impacts on ecosystem services and biodiversity.
8. Set out the whole revised ERA procedure in a flow chart to obtain a clear overview of the various steps and different possibilities, including a decision support scheme.
9. Discuss the new PLH ERA approach with other organisations involved in ERA, or present it to them, with the aim of complementing other risk assessments and harmonising where possible and needed.
10. Consider how the innovative method used to perform the ERA might influence other elements of a pest risk assessment.
T
ABLE OF CONTENTSAbstract ... 1
Summary ... 2
Table of contents ... 5
Background as provided by EFSA ... 7
Terms of reference as provided by EFSA ... 8
Assessment ... 9
1. Introduction ... 9
2. Methodology ... 10
2.1. The ERA Pomacea framework ... 10
2.2. The new scenario analysis and the density dimension ... 11
2.3. The adaptation of the assessment scheme ... 13
2.4. The collection of expert judgements ... 14
2.4.1. Scaling factors ... 14
2.4.2. Impact on ecosystem traits ... 14
2.4.3. Impact on ecosystem service and biodiversity components ... 15
2.4.4. Spatial distribution of the potential impacts ... 15
3. The scenario assumptions ... 15
3.1. Identification of the SPUs ... 15
3.2. Definition of the spatial and temporal (5–30 years) scales ... 16
3.3. Definition of the biomass scale ... 17
3.4. Estimation of resistance, resilience and management ... 18
3.4.1. Resistance ... 18
3.4.2. Resilience ... 19
3.4.3. Management ... 19
3.4.4. Scenario parameters ... 20
3.4.5. Object of the assessment ... 20
4. Environmental risk assessment ... 22
4.1. Projection of the potential and realised biomass ... 22
4.2. Effects of snail biomass on ecosystem traits ... 28
4.2.1. Traits related to the macrophytes ... 28
4.2.2. Traits related to water quality ... 36
4.2.3. Traits related to biodiversity ... 40
4.3. Effect on ecosystem services ... 46
4.3.1. Provisioning service ... 46
4.3.2. Regulating and supporting service ... 48
4.4. Effect on biodiversity components ... 54
4.4.1. Genetic diversity ... 54
4.4.2. Native species diversity ... 55
4.4.3. Habitat, community and/or ecosystem diversity ... 57
4.4.4. Threatened species ... 60
4.4.5. Habitats of high conservation value ... 63
4.5. Overall risks and uncertainties ... 66
5. Evaluation of the Pomacea ERA procedure ... 67
5.1. Scenarios ... 67
5.1.1. Population dynamics model ... 67
5.1.2. Definition of the service providing unit... 67
5.1.3. Definition of the temporal, spatial and biomass scales and the influence of resistance, resilience and management ... 68
5.5.2. Traits ... 70
5.5.3. Ecosystem services ... 70
5.5.4. Assessment of the impacts on ecosystem services and biodiversity components ... 70
5.5.5. Flow charts ... 70
Conclusions and recommendations ... 71
References ... 74
Appendices ... 78
Appendix A. Ratings risk and confidence intervals ... 78
Appendix B. Questionnaire for expert consultation on environmental impact assessment ... 81
B
ACKGROUND AS PROVIDED BYEFSA
The Scientific Panel on Plant Health (PLH Panel) provides independent scientific advice on the risks posed by organisms which can cause harm to plants, plant products or plant biodiversity in the European Community. The Panel reviews and assesses those risks with regard to the safety and security of the food chain to assist risk managers in taking effective and timely decisions on protective measures against the introduction and spread of harmful organisms in the European Community. On request, the Panel prepares pest risk assessments and identifies and evaluates the effectiveness of risk reduction options to provide scientific advice to the European Commission in support of protective measures within the European Community to prevent the introduction and further spread of organisms considered harmful to plants or plants products under the Council Directive 2000/29/EC5.
In 2011 the PLH Panel evaluated a Spanish Pest Risk Analysis (EFSA PLH Panel, 2012a), and recommended that further study should be performed on the potential consequences of the Pomacea genus for the European environment. The assessment of environmental consequences of the Pomacea spp.-induced transformation of wetland ecosystems presented in the Spanish Pest Risk Analysis demonstrates some limits in the capacity to predict the interaction of the snails and the receiving communities and ecosystems. These limits affect the possibility of extrapolating the findings in Asia to the EU territory. Given that projections of environmental consequences are based on a scenario exercise, a more structured and ecologically sound approach would strongly contribute to providing insight into the future development of the snail invasion and its consequences. In particular, the following aspects might be considered for the development of an environmental risk assessment for the Pomacea snails in the EU territory:
(i) The snail population density. The environmental consequences of snail invasion have been proven to be dependent on the snail population density. It appears to be essential to project not only the potential area of invasion, based on simple climate matching, but also to produce a scenario of potential impact based on adequate consideration of the snail‘s biology and its ecology at the basis of population dynamics. The development of a snail population dynamics model may assist the computation of the potential population density over all the suitable areas in continental Europe. This model should include temperature-dependent responses of development, survival and reproduction. The role of host availability and density can also be taken into account in model projections, if data are available.
(ii) Development of scenarios of potential consequences. To develop a scenario of potential consequences the following information is required: (a) projection of the potential population density; (b) hypothesis on pest spread potential; (c) information on the distribution of the potentially affected habitats including habitats other than rice fields and natural wetlands that may be invaded by the pest such as rivers, shallow lakes and ponds (these ecosystems are also likely to be affected by the Pomacea snails and may serve as reservoirs for the snails and as an infrastructure for spread). Such information can support the estimation of (1) the environmental consequences on natural wetlands and (2) the potential impact on rice fields. (iii) Perform a structured evaluation based on biodiversity and ecosystem services. The published
guidance on the environmental risk assessment of plant pests (EFSA PLH Panel, 2011) provides a structured methodological framework for assessing the environmental risks of plant pests and is very suitable for development of an environmental risk assessment for Pomacea snails in the risk assessment area. The guidance emphasises the importance of assessing the consequences on both the structural (biodiversity) and the functional (ecosystem services)
assessment scheme and is particularly suitable for a plant pest such as Pomacea spp., which represents an important driving force of wetland ecosystems change.
Furthermore in 2012, The PLH Panel has published a statement on the identity of the apple snails (EFSA PLH Panel, 2012b), and considered that the uncertainties on the invasive potential of the apple snail that are mainly related to the poor knowledge of the biology and ecology of most of the Pomacea species that does not allow grading of the invasive potential at species level. The understanding of the invasive potential is also limited by possible change in the invasiveness after establishment.
T
ERMS OF REFERENCE AS PROVIDED BYEFSA
In this context EFSA requests the PLH Panel to produce an environmental risk assessment of the apple snails for the EU territory. Specifically, the Panel is requested to:
- Review the current state of the art of the biology and ecology of the apple snails;
- Perform an environmental risk assessment using the invasive species of Pomacea as a case study for validation of the Plant Health environment guidance document (EFSA PLH Panel, 2011).
A
SSESSMENT1. Introduction
The island apple snail (previously called Pomacea insularum (d‘Orbigny, 1835) and now called
P. maculata) is one of the largest fresh water snails. P. maculata, along with other species belonging
to the same genus, is highly invasive outside its native distribution range (South America), which might be the result of its polyphagy and high reproductive rate. The apple snail is considered to be a serious rice pest and can cause devastating effects on the flora and fauna of natural fresh water wetlands. In 2010, the organism invaded rice fields in the Ebro Delta in Spain. Before then, it was not known to occur in the European Union (EU) and was not regulated. Since November 2012, the invasive snail has been regulated in the EU by a Commission Implementing Decision6. Currently,
apple snail invasion is continuing in the Ebro Delta despite control measures to eradicate and/or contain the snail in the rice paddies. Mechanical and chemical control measures are used, as well as inundation of paddies with saline water and other methods. At present, the snail is present not only in rice paddies, but also in some nearby wetlands, and it has been found moving upwards along the Ebro riverbeds.
At the request of the European Commission (EC) the Panel on Plant Health (hereinafter referred at as the Panel) provided advice in two different documents regarding the apple snail in 2012:
- EFSA PLH Panel, 2012a. Scientific Opinion on the evaluation of the pest risk analysis on
Pomacea insularum, the island apple snail, prepared by the Spanish Ministry of
Environment and Rural and Marine Affairs.
- EFSA PLH Panel, 2012b. Statement on the identity of apple snails.
In its evaluation, provided in the scientific opinion, the Panel concluded that the Spanish pest risk analysis (Spanish Ministry of Environment and Rural and Marine Affairs, 2011) did not sufficiently address the environmental impact of snail invasion and recommended that further study should be performed. The Panel was therefore requested by EFSA to perform an environmental risk assessment (hereinafter referred to as an ERA) on the apple snail following the guiding principles presented in the PLH guidance document (EFSA PLH Panel, 2011, hereinafter referred to as PLH ERA guidance document). While performing the ERA, the Panel was also asked to use this as a case study and evaluate and update the guidance document.
In EFSA PLH Panel (2013), the Panel presented the current state of the art of the biology of apple snails, and developed and used a population dynamics model to assess the potential establishment of apple snails in the EU in terms of the spatial distribution of the snail‘s population density.
In this scientific opinion the Panel uses the data on biology and ecology of the apple snail and the results of the population dynamics model, presented in EFSA PLH Panel (2013), to perform an ERA following the guiding principles detailed in the PLH ERA guidance document. This task has been performed considering the possible simplification and adjustments to the Panel‘s environmental risk assessment guidance document.
In this scientific opinion, when the Panel refers to the apple snail, it refers specifically to
Pomacea maculata and to P. canaliculata. As these species are closely related, their population
dynamics pattern and potential impacts are assumed by the Panel to be similar, under the assumptions detailed in EFSA PLH Panel (2013).
2. Methodology
2.1. The ERA Pomacea framework
The ERA of the apple snail has been performed following the principles described in the EFSA guidance on ERA of invasive species (EFSA PLH Panel, 2011).
In a nutshell the different concepts used to perform the ERA are:
The invasive species is considered the driver of ecosystem change.
The definition of impact relates to the specific service-providing unit (SPU). The impact depends on the resistance and resilience of the system.
The impact also depends on the management of the invasive species.
The impact is assessed under specific assumptions defining the scenarios of the assessment. Only the negative impacts of the apple snail on the traits, ecosystems services and biodiversity components are assessed.
First the relationships between the driver of the ecosystem change (i.e. the snail biomass) and the ecosystem traits are assessed.
Then the clusters traits–biodiversity and traits–ecosystem services are identified.
Finally, the impact on the biodiversity and ecosystem services components is assessed considering the impact on traits previously evaluated.
The described procedure is summarised in Figure 1.
DRIVING FORCE PROVISIONING IMPACT ON ECOSYSTEM SERVICES MANAGEMENT SUPPORTING REGULATING IMPACT ON ECOSYSTEM TRAITS INVASION IMPACT ON BIODIVERSITY SPU ECOSYSTEM TRAITS ECOSYSTEM RESISTANCE RESILIENCE STRUCTURAL BIODIVERSITY CONSERVATION
introduction of the density dimension (in this opinion in the form of snail biomass) in the scenario analysis together with the spatial and the temporal dimension (see Section 2.2). A new approach has been developed to address the ERA of the apple snail. The approach is based on different procedures for collecting expert judgements related to different aspects of the assessment (impact on ecosystem traits and risks posed to ecosystem services and biodiversity components) (see Section 2.3).
The glossary provides explanations of the technical terminology used throughout this document. 2.2. The new scenario analysis and the density dimension
Knowing the population density of an invasive species and its spatial and temporal variation is essential to determine the spatial and temporal pattern of the environmental impact. The density is the most important state variable that the Panel uses to describe and predict the outcome of the trophic relationships between a pest and its host plants. The effect of this trophic interaction on the host plants community is the first element to be considered in order to understand the ecosystem disturbance produced by a plant pest.
In this opinion, a method based on the information on the density distribution of snails is used to evaluate the potential environmental impact of the snail in the assessment area.
In EFSA PLH Panel (2013), to estimate the area of potential establishment of the apple snail in the EU, the Panel developed a population dynamics model for Pomacea canaliculata, a closely related species to P. maculata, identified as the invasive apple snail in the Ebro Delta in Spain.
P. canaliculata is also a worldwide invasive apple snail, and one for which more bio-ecological
information is available. The Panel assumes that the species are similar in terms of their population dynamics pattern and potential impacts. Snail population dynamics depend on development, reproduction and mortality, which are strongly influenced by temperature. Density-dependent population regulation is included into the model to account for intraspecific competition. Additional mortality is introduced into the model as an averaged effect of the temperature-independent and density-dependent mortality. A 25 × 25 km simulation grid is considered to cover the whole of Europe. In each node of the grid the potential snail population abundance was calculated using a physiologically based demographic model (Metz and Diekmann, 1986; Curry and Feldman, 1987; Gutierrez, 1996; Di Cola et al., 1999). P. canaliculata is considered a stage-structured population comprising three stages: egg, juvenile and reproductive adult. Demographic processes are described by means of temperature-dependent biodemographic functions (development, mortality and fecundity for reproductive females). The functional forms of these functions are the same as used for many other poikilotherm species, and parameters were estimated using available literature data on P. canaliculata (Albrecht et al., 1999, 2005; Estebenet and Martin, 2002; Yingying et al., 2008; Burela and Martin, 2011; Y. Liu et al., 2011; J. Liu et al., 2012; Seuffert and Martín, 2012, 2013). Population dynamics were described by a Kolmogorov equation discretised with a time step of one hour for each point of the spatial grid (Di Cola et al., 1999). The simulated abundance in each node was obtained using the specific climatic condition of the node. The potential distribution of the apple snail P. canaliculata in Europe was obtained by calculating the average abundance per year for each node of the grid covering Europe. For further details on the model and data, see EFSA PLH Panel (2013).
In EFSA PLH Panel (2013), two cases were considered, which differed in the mortality rate function: one case was less favourable to apple snail establishment owing to higher mortality (PM2.0) and the other more favourable (PM1.5) owing to lower mortality. In the ERA presented in this scientific opinion, the Panel considers only the model with the lower mortality (PM1.5).
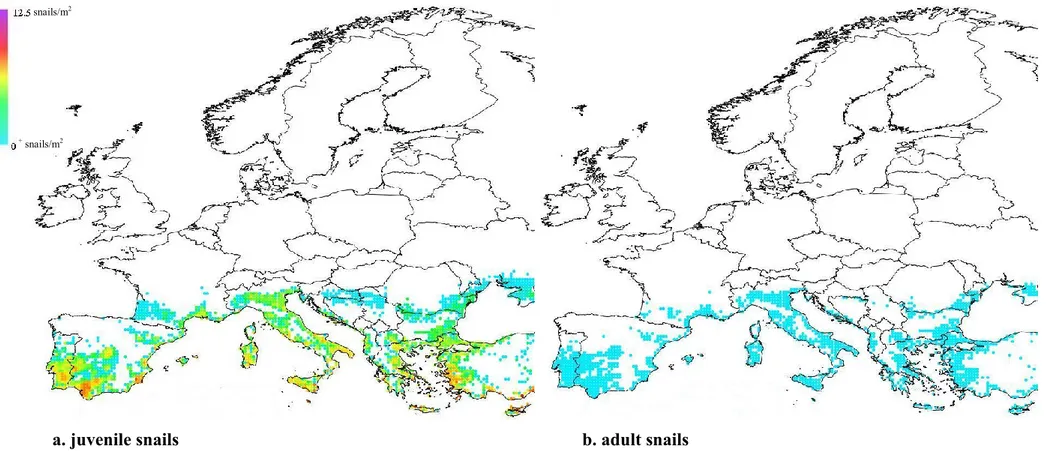
Figure 2: Potential distribution and density of Pomacea canaliculata in Europe obtained with the apple snail population dynamics model: (a) juveniles; (b) adults. The colour code in the legend corresponds to densities above 0 (individuals per m2).
snails/m2
+ snails/m2
The area of potential establishment of the apple snail comprises part of southern Europe and includes the rice production areas and most of the wetlands of southern Europe and the Balkans up to the latitude of the Danube River. The northern limit of the potential distribution of snails in Europe is in the Po Valley (Italy). Coastal areas in the Mediterranean area are generally more suitable than inland areas. Adult population density is generally low (Figure 2b). Juvenile population density is generally higher than adult population density. Several hotspots (locations with an infestation of more than five juveniles per square metre) corresponding in the map of Figure 2a to the colour changes from light green to yellow.
Pest population density can be expressed in terms of numbers or biomass per unit area or volume. In the case of herbivores, biomass, if related to the information on the type of damage and the metabolic rates of the pest, can be even more informative than numbers to account for the population pressure on the environment. In the epidemiology of plant diseases, the prevalence of a disease in a given plant population per unit of area or volume can be considered the equivalent of the population density concept. The spatial distribution of the density, expressed in terms of apple snail biomass per unit area of suitable habitats, is derived from the population dynamics model developed in EFSA PLH Panel (2013).
2.3. The adaptation of the assessment scheme
The generic ERA scheme proposed in the PLH ERA guidance will usually need to be adapted to the specific requirements of an invasive organism, its host plants and its potential impact on the environment, as well as the objectives of the analysis, current knowledge and the resources available for the assessment. For the ERA of the apple snail, the following should be emphasised:
The scientific principles of the ERA for invasive species and the procedure for constructing the scenarios given in the PLH ERA guidance were very useful to develop the options for the assessment of environmental risks posed by the apple snail.
The evaluation of the impact on the ecosystem traits was performed and impacts could often be supported by scientific evidence.
As expected, designing and quantifying the links between impact on ecosystem traits and on biodiversity components as well as on ecosystem services was a complex exercise.
The experts involved in the assessment apparently used two different cognitive approaches for the assessment of the impact on the traits and on biodiversity and ecosystem services. For the traits the assessment was generally linked to knowledge on available data and interpretation of specific ecological dynamics in a system under perturbation. For biodiversity and ecosystem services, the level of analysis was mainly integrative and conceptual, and required incorporation of different sets of knowledge.
On the basis of the above-mentioned points:
The Panel performed three types of assessment based on expert judgements at three different levels of detail: (i) estimation of values of the scaling factors limiting the potential biomass, (ii) estimation of the impacts on the ecosystem traits and (iii) estimation of the impacts on biodiversity and ecosystem services.
The Panel developed three slightly different methods to collect expert judgements to address these three types of assessment.
- Second, the Panel assessed the impact on ecosystem traits in relation to the snail biomass (see ii). The consideration of the impact on different traits facilitates the evaluation of systemic effects due to the interactions between the traits.
- In the third step, an assessment of the impact on the integrative levels of biodiversity and ecosystem services was carried out (iii).
Finally, the assessments conducted at different levels were then checked by the same experts to consider any discrepancies or inconsistencies among assessments.
2.4. The collection of expert judgements
To obtain information about the impact of snails on ecosystem services and biodiversity, a panel of five experts with knowledge of the biology and ecology of the apple snail and of the ecology of wetlands was established.
2.4.1. Scaling factors
The biomass expected at the two time horizons (5 and 30 years) can then be obtained by multiplying the potential biomass in each node of the assessment area by the value in the node for the three scaling factors (resistance, resilience and management) at the different time horizons. Further details of the approach are provided in Section 3.4.
For each scaling factor, each individual expert gave an estimate of the mean value and an estimate of the range of variability around this mean value, intended as an interval in which the value of the scaling factor falls with 95 % probability. Next, a single 95 % confidence interval was obtained by combining the confidence intervals estimated by the experts (Appendix A). Then, mean values and confidence intervals were used to design maps of the realised biomass. Three types of maps were designed for the two time horizons: one map is based on the multiplication of the potential biomass by the mean values of the scaling factors and the other two maps are based on multiplication of the potential biomass by the lower and upper bounds of the scaling factors.
2.4.2. Impact on ecosystem traits
The impact on ecosystem traits was evaluated as a function of potential snail biomass. Experts were consulted to assess how the variation of the potential snail biomass affects a given trait of the ecosystem. The level of the variable measuring the state of each ecosystem trait is set equal to 1 for a potential snail biomass of 0 (no snails). In addition, the potential snail biomass was normalised to the highest value obtained for the assessment area, which was 31.5 g of snail per square metre of fresh weight.
During a consultation meeting, the experts involved in the procedure were asked to reach an agreement on the possible variation of the impact on each ecosystem trait separately. The impact is measured in terms of change in the level of the ecosystem trait due to the increase in snail biomass. Four levels of potential snail normalised biomass have been considered: 0.25, 0.5, 0.75 and 1. Then, the estimated changes in the four values of the trait were interpolated to obtain continuous functions for the relationship between potential snail biomass and impact on ecosystem traits (see Section 4.2). The objectives for this assessment were twofold:
(i) to assess the value of the impact on the ecosystem traits at the two time horizons defined in the study;
2.4.3. Impact on ecosystem service and biodiversity components
The impacts on the components of biodiversity and ecosystem services have been evaluated by using the method based on the probability distributions described in Appendix B. Experts were consulted through a questionnaire presented in Appendix B. Together with the questionnaire, guidelines for the assessment of the impact of snail invasion on ecosystem services and biodiversity components were provided. The guidelines present the information necessary to perform the assessment and include:
a description of the method for the assessment; the assumptions for the assessment;
the list of ecosystem services and biodiversity components; the traits–services and traits–biodiversity clusters.
The experts were asked to provide their judgement on the probability distribution of the reduction in the level of services provided by the SPU and the level of reduction of specific components of biodiversity.
The experts responded individually to the questionnaire and provided explanations to support their ratings. The collected ratings were combined to provide mixture distributions for the impact on each ecosystem service and biodiversity component subject of the assessment. The mixture distributions were then presented and discussed with the experts, resulting in consensus about the final probability distributions. The final probability distributions represent realistic distributions that adequately integrate the different expert opinions expressed during this consultation.
2.4.4. Spatial distribution of the potential impacts
The resulting estimates of potential impacts have been used to generate high-resolution maps (25 25 km) of the spatial distribution of the potential impacts of the apple snail invasion for some ecosystem traits, ecosystem services and biodiversity components.
In future work, the methodology used in this opinion to produce the maps of the spatial distribution of impact on some ecosystem traits, ecosystem services and biodiversity components could also be compared with maps of special wetland areas under Natura 2000 (Council Directive 92/43 EEC7). For
example, Baker et al. (2012) identified Natura 2000 wetland sites in Spain and Portugal that were climatically suitable for Eichhornia crassipes. Although the use of spatial land use data in environmental analysis have limitations (Perennou et al., 2012), CORINE Land Cover Class maps (Bossard et al., 2000) could also be used to help identify and quantify the areas of wetland at risk in the EU. The objective of this comparison would be to visualise the relevant habitats present in the assessment area that are potentially affected by the presence of the apple snail. However, to do this in a scientifically sound way, it would be necessary to relate these maps more clearly to the quantitative analysis of the impacts on ecosystem traits, ecosystem services and the biodiversity components of those habitats considered in the ERA.
3. The scenario assumptions 3.1. Identification of the SPUs
For the definition of the SPU, homogeneity of the type of services the ecosystem provides is important, irrespective of the homogeneity of the environment containing the aquatic plants susceptible to attack by the apple snail (mostly submersed and floating macrophytes). There are
colonised by Pomacea. The term ‗wetland‘ covers a wide range of habitats that are characterised by standing or slowly moving waters, with or without an open body of water. In our ERA, the term wetland is used to describe shallow, aquatic, fresh water systems with standing or slowly moving waters that have an open body of water with a mean depth between 0.2 and 1.0 m for at least six months of the year. In parallel, lentic aquatic systems that have a mean depth of between 1.0 and 2.0 m all year around are defined as shallow lakes, while lentic aquatic fresh waters systems that have a mean depth of more than 2.0 m throughout the year are called lakes.
In order to simplify the application of the ERA, the Panel considers that a single SPU is affected by
Pomacea spp., i.e. shallow fresh water areas containing macrophytes such as wetlands, shallow lakes,
river deltas and the littoral zone of deeper lakes and rivers. The interaction between the SPU and cultivated areas (rice fields) is taken into account in this opinion, but not the cultivated areas themselves. Although the above-mentioned areas are ecologically diverse, they all share a homogeneous environment in which the macrophytes offer retention and processing of nutrients and toxic substances, physical structure, habitat, refuge, food or substrate and an environment for spawning of invertebrates, fish and amphibians. More importantly, these environments share a homogeneity in the type of ecosystem services they provide, which justifies grouping them into a single SPU in our assessment.
3.2. Definition of the spatial and temporal (5–30 years) scales
The potential establishment of the snail in the risk assessment area is expressed in terms of the distribution of snail density. Population density is a very important state variable in ERA as it determines the impact on the ecosystems. For an organism such as Pomacea, biomass is more informative than snail density in determining the impact. Therefore, in this opinion, density is expressed in terms of snail biomass per unit area of suitable snail habitat. Because of their trophic activity, only juvenile and adult stages are considered.
In each spatial unit, defined as the cell of the lattice model used to simulate the snail population dynamics, the Panel now computes the potential biomass (PB) as the biomass obtained considering the climatic condition in the node, the density-dependent constraints and the additional mortality factor estimated by means of the calibration procedure described in EFSA PLH Panel (2013). Moreover, as explained in the above-mentioned opinion, the role of abiotic factors other than temperature is not explicitly addressed. Because of the width of the trophic niche of the apple snail and the quality and availability of host plants, the Panel does not expect plants to be a limiting factor for establishment. From the potential biomass (PB) estimated by means of the model on potential establishment, the realised biomass (RB) is computed considering the effects of resistance, resilience and management, which are regarded as the factors limiting the potential biomass in each spatial unit. The potential biomass is computed for the whole risk assessment area disregarding the presence of suitable habitats. The distribution of the suitable habitats can be overlaid as a different information layer restricting the projection of the population density as well as the expected impact on the areas where snail habitats are really present. This procedure provides a more detailed spatial representation of the impact.
In a first approximation, the effect of the limiting factors is considered homogeneous in the space dimension but variable in the time dimension. This leads to an assessment of the spatial variation of the impact that depends only on the spatial variation of the realised biomass. Snail occurs on a spatio-temporal scale. However, spread of snails is very difficult to predict, owing to the potential but largely unknown role of human-assisted spread and potential long-distance spread by birds (see EFSA PLH Panel, 2013). Therefore, the change in area of potential establishment is disregarded, and the spatial extent of the assessment corresponds to the area of establishment predicted by the population
A short-term assessment, performed 5 years after establishment, when the population dynamics of the snail has reached its potential maximum level and is mainly influenced by the resistance of the receiving environment and with consideration of the containment and eradication efforts.
A long-term assessment, performed 30 years after the establishment. At this time horizon a major role is played by the resilience e.g. occurrence of snail-resistant macrophytes and development of control of snails by predators and other natural enemies which need to adapt to the presence of the exotic snail. More specific management measures are expected to be available and will also be considered. Changes in climate and wetland habitats have not been taken into account in the 30-year assessment scenario.
The effects of resistance, resilience and management are discussed in Section 3.4, including a discussion of the evolution of the impact of these factors over time in limiting the snail biomass. Further, the numerical values for the two time horizons are estimated and presented in this section. 3.3. Definition of the biomass scale
To define the biomass scale, the procedure, described in Section 2, and the basic assumptions, specified in Sections 3.1 and 3.2, are modelled, resulting in the quantification of the environmental risk.
Let be the potential biomass in a cell i at time t obtained by the earlier developed simulation model (EFSA PLH Panel, 2013). depends on the climatic condition of cell i and changes over time. It requires a certain time to reach the maximum abundance attainable, . In the representation of the potential distribution of the invasive species, is used.
Three major factors influence the time dynamics of : the resistance and the resilience of the receiving environment and the management options available to control Pomacea. The effects of these factors are modelled by the following functions:
is a time-dependent scaling factor describing the effect of resistance in cell i. is a time-dependent scaling factor describing the effect of resilience in cell i.
is a time-dependent scaling factor describing the effect of management in cell i.
is defined as the realised biomass in cell i at time t. The realised biomass is obtained from the potential biomass multiplied by the three scaling factors as follows:
.
Under the hypothesis that the effects of resistance, resilience and management are the same in every cell, the realised biomass function becomes
.
When the values for of resistance, resilience and management are known, scaling factors at different time horizons for the realised biomass can be calculated. In the ERA of invasive species it is relevant to consider at least two time horizons that lead to two different assessments:
In these two scenarios the intensity of the driving force (i.e. the realised biomass of the invasive species) is computed as
. .
The next step in the assessment procedure is to define the relationship between the driving force and the ecosystem traits. For each of the selected ecosystem traits, a variable, , expressing the state of the traits is defined. The state of the variable is normalised to 1, this being the condition characterising the ecosystems before the invasion. It is assumed that the change in the state of ecosystem traits due to the effect of the invasive species depends on the biomass of the driving force only. The driving force is supposed to reduce the value of , but an increase is also possible. Then, the functions
, which describe the variation of the state of the ecosystem traits as function of the realised biomass, are estimated by means of a procedure based on the collection of experts‘ judgement (see Section 4.2). These functions allow the state of the ecosystem traits to be estimated at the two selected time horizons. Under the assumption that the functions do not depend on the cell (i.e. the impact is the same for the whole assessment area), the impact of the invasive alien species on the ecosystem traits for the short term (ts) and the long term (tl) is defined as
; and .
Having estimated and , two different configurations of ecosystem traits for the two time horizons were obtained. On the basis of the change in the ecosystem traits and the traits–services clusters (see Section 3.4.5), the change in the ecosystem services can be estimated.
3.4. Estimation of resistance, resilience and management 3.4.1. Resistance
The assessment of the environmental consequences of the Pomacea spp.-induced transformation of shallow fresh water, macrophyte-dominated ecosystems in Europe must address the interaction between the invader and the receiving communities and ecosystems. The level of ecosystem resistance, i.e. the capability of the ecosystem to remain relatively functionally intact despite the disturbance from Pomacea herbivory, is one key variable required to forecast the magnitude of the environmental consequences, especially in the short period after the invasion.
It is important to take into account the fact that fresh water habitats in lowland regions of Europe have been subject to large-scale changes over the last 200 years as a result of an increasing human population, more efficient and nutrient-demanding cultivation and rapid industrialisation in the surrounding catchment areas. These human activities have led to sharp increases in the transport of both suspended particles and nutrients to the fresh water ecosystems and coastal waters in lowland Europe. These changes negatively affect the abundance, diversity and the maximum growing depths of aquatic macrophytes through impoverished light conditions and by promotion of phytoplankton growth (Sand-Jensen et al., 2000). Macrophyte abundance and macrophyte species diversity are therefore steadily declining in Europe (de Nie, 1987). These changes make the shallow fresh water, macrophyte-dominated ecosystems in Europe less resistant to further disturbance.
deter the snails (Morrison and Hay, 2011). In addition, European macrophytes lack a co-evolutionary history with Pomacea, and high susceptibility to snail herbivory, and thus very low resistance of the receiving ecosystem, may be expected. Furthermore, the Panel considers it unlikely that natural enemies that are naive to Pomacea will be able to control the invasive population and prevent population establishment and growth, at least in the beginning of the invasion. For these reasons, ecosystem resistance to a Pomacea invasion is expected to be very low in Europe.
3.4.2. Resilience
The resilience, or the capability of the fresh water ecosystems in Europe to return to their original clear water, macrophyte-dominated state after being disturbed by the effects from a Pomacea invasion, may increase over time, as natural enemies may adapt to utilise the new, invasive and abundant resource (Carlsson et al., 2009). However, many fish and bird species that could become important predators of
Pomacea over time are expected to decline if macrophytes are declining as a result of Pomacea
herbivory.
3.4.3. Management
Options to reduce and manage apple snail populations were presented in the Spanish pest risk analysis (Spanish Ministry of Environment and Rural and Marine Affairs, 2011) and are discussed in EFSA PLH Panel (2012a). In addition to these options, in the Ebro Delta in Spain, several new management methods have been used recently, such as treatment of rice paddies with lime or saline water. Risk reduction options include legislation to prevent import of the snail into the EU, banning of breeding and trade of the snail, hand or mechanical collection of snails and installation of snail traps. The above-mentioned options are not expected to have serious negative environmental effects and are not discussed later in this section, though they should be considered in the ERA under effects of management on the biomass of apple snail.
The risk reduction options that may cause negative environmental effects on the wetlands are (1) keeping rice paddies dry for long periods, (2) burning vegetation and river bank conditioning and (3) treating rice paddies and/or irrigation canals with (a) lime, (b) saline water, (c) snail attractants containing methaldehyde or (d) saponins.
(1) Keeping rice paddies dry for a long period might negatively influence rice paddy biodiversity, in particular soil biodiversity and birds visiting the rice ecosystem. These effects, when only a small part of all paddies are kept dry at a certain time, are not expected to influence the natural wetland ecosystems near the rice production area.
(2) Burning vegetation and removal of plants along river banks to prevent egg laying and survival of snails will have a negative effect on flora and fauna of river ecosystems in wetlands when applied on a large scale and over several years.
(3) Treating rice paddies with saponins, lime and saline water may result in negative effects on both the rice and the natural wetland ecosystem.
(a) Application of lime to the paddies will suddenly and strongly increase the pH, and kill not only the snails, but also the majority of invertebrates, fish, amphibians, reptiles, flora and soil life in the rice paddy. Depending on the rice area treated, a further negative effect will be a temporary increase in pH in the rivers and pools of the wetland ecosystem.
(d) Use of saponins will result in a high mortality of many organisms living in rice paddies; saponins are plant-produced glycosides which are highly toxic to fish, molluscs, frogs and other gill-breathing organisms (Joshi et al., 2008; San Martin et al., 2008). As saponins have very short half-lives, 12–24 hours under field conditions according to Hostettmann and Marston (1995), negative effects of their use will mainly occur in the rice paddies and the irrigation canals. The effects on the river and delta ecosystem are expected to be temporary and rather limited.
Some of the methods to control apple snail in rice paddies might also be used in wetlands, e.g. hand or mechanical collection of snails and installation of snail traps, though it is as yet unknown how snail traps affect other biota of wetlands. All the risk reduction options mentioned under 1–3 above seem to result in serious negative effects on wetland ecosystems and, therefore, should not be used.
The negative effects of control measures aimed at apple snail are expected by the Panel to be only a fraction of the negative environmental effects caused by other management methods used to control pests, diseases and weeds in rice production areas. In addition to chemical control of rice pests, diseases and weeds, chemical pesticides as well as microbial control agents are extensively used for control of mosquitoes. Available information on the control of rice pests and mosquitoes suggests that the current methods used to control the apple snail might result in only minor additional negative effects.
Finally, the role of natural enemies in reducing apple snail populations needs to be considered. In the short term, natural enemies are not expected to play an important role, but in the long term several natural enemy species may start to use and even specialise on this abundantly available food source. Based on the information presented above and on expert estimates, the effect of management measures on reduction of potential snail biomass in fresh water wetlands is estimated to be low in the short term and moderate in the long term.
3.4.4. Scenario parameters
Table 1 summarises the parameters used for the scenarios of the assessment with their confidence intervals.
Table 1: Summary of the scenario parameters used in the assessment
Short term (ts): 5 years Long term (tl): 30 years Mean scaling factors
Resistance (RS) 0.9 (CI [0.8242;0.9758]*) 1
Resilience (RL) 0.95 (CI [0.9021;0.9979]*) 0.5 (CI [0.3593;0.6407]*) Management (MN) 0.99 (CI [0.9563;1]*) 0.8 (CI [0.6607;0.9393]*)
RS RL MN 0.84 0.4
Biomass
Maximum potential biomass (PBmax) 31.5 g/m2 31.5 g/m2
Maximum realised biomass (RBmax) 26.5 g/m2 (normalised 0.84 g/m2) 12.6 g/m2 (normalised 0.40 g/m2) *95 % confidence interval for the mean of the scaling factor obtained as described in Appendix A.
3.4.5. Object of the assessment
In this study, three different assessments have been performed separately.
The Panel assessed the effect of snail biomass on ecosystem traits for the traits that are presented in Table 2 below and assessed the impact of snail invasion on the ecosystem services in the worst-case scenario. In the context of the current ERA, considering that the driving force of the ecosystem change is the apple snail biomass, some services are not expected to be modified and only the provisioning services and regulating–supporting services listed in Table 3 below have been retained for evaluation. The Panel also assessed the impact of snail invasion on biodiversity in the worst-case scenario, for both structural and conservation components, which are listed in Table 4. For some of these components of biodiversity, the effect of snail biomass was also evaluated.
Table 2: List of the traits assessed by the Panel
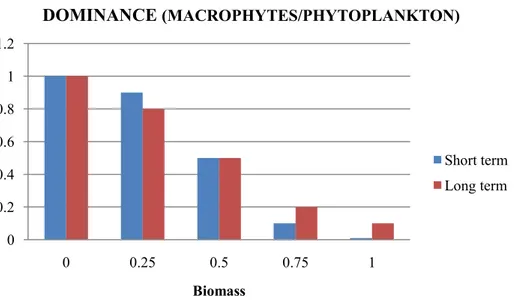
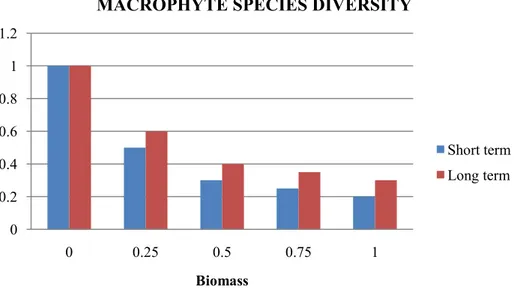
Traits assessed for impact relationship with snail biomass Traits related to the macrophytes Traits related to water
quality Traits related to biodiversity Edible macrophyte biomass Oxygen concentration Aquatic invertebrates
biodiversity
Biomass of non-edible macrophytes Phosphorus concentration Amphibian biodiversity Dominance
(macrophytes/phytoplankton)
Sedimentation rate Fish biodiversity Macrophyte species diversity pH (percentage of variation) Bird biodiversity
Structural complexity of the habitat Denitrification Zooplankton biodiversity Zooplankton biomass Periphyton biomass
Table 3: List of the ecosystem services assessed by the Panel
Ecosystem services assessed for impact of snail invasion Provisioning services Regulating and supporting services
Food Climate regulation
Genetic resources Water regulation/cycling/purification Fresh water Erosion regulation
Nutrient cycling
Photosynthesis and primary production Pest and disease regulation
Pollination
Table 4: List of the biodiversity components assessed by the Panel
Biodiversity components assessed for impact of snail invasion Genetic diversity
Native species diversity
Native habitats, communities and/or ecosystems diversity Threatened species
Figure 3: Traits–services clusters
Figure 4: Traits–biodiversity components clusters
4. Environmental risk assessment
4.1. Projection of the potential and realised biomass
Starting from the maps representing the potential snail density in Europe (individuals/m²), it is possible to obtain maps for the potential biomass (g/m² of fresh weight) of Pomacea, by considering the weighted mean weight for the juvenile and adult stages, i.e. taking into account the duration and the survival of the stages. Mean juvenile weight is 3.6 g (Estebenet and Martín, 2003) and mean adult weight is 7.8 g (Y. Liu et al., 2011). The realised biomass is then obtained by multiplying the potential biomass by the mean values of resistance, resilience and management which were estimated by the experts (Table 1).The experts also individually estimated for each scaling factor an interval in which
three types of maps were compiled for each of the two time horizons: one map is based on the multiplication of the potential biomass by the mean values of the scaling factors; the other two maps are based on multiplication of the potential biomass by the lower bounds (less favourable scenario for snails) or the upper bounds (more favourable scenario for snails) of the scaling factors. The maps based on lower and upper bounds account for the effects of uncertainty in the scaling factors on the distribution of biomass.
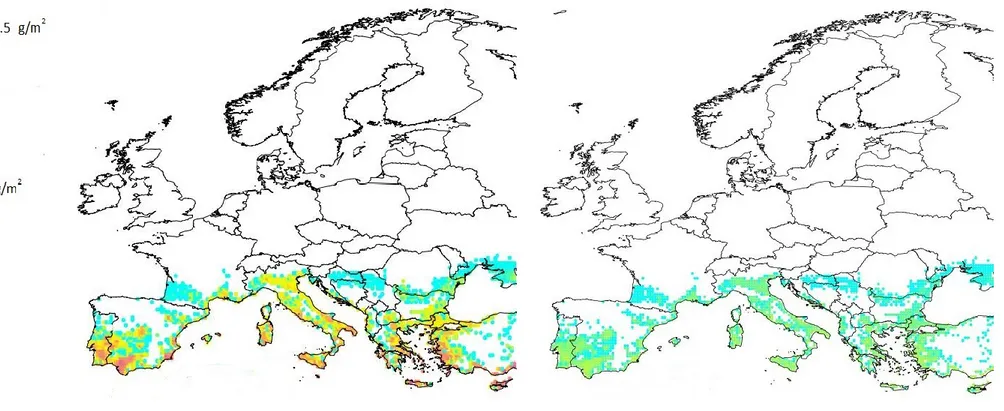
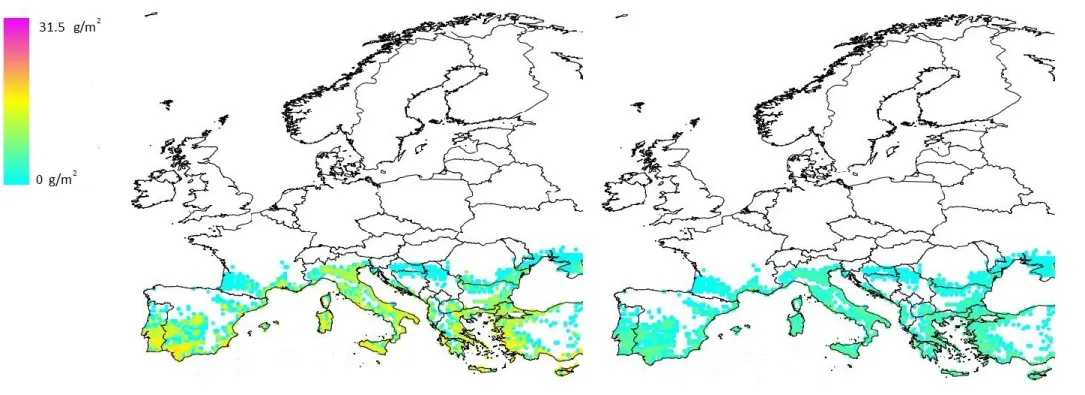
Figure 5: Distribution of total potential biomass (g/m²) of Pomacea canaliculata juveniles + adults over Europe. The colour code in the legend corresponds to biomass values above 0.
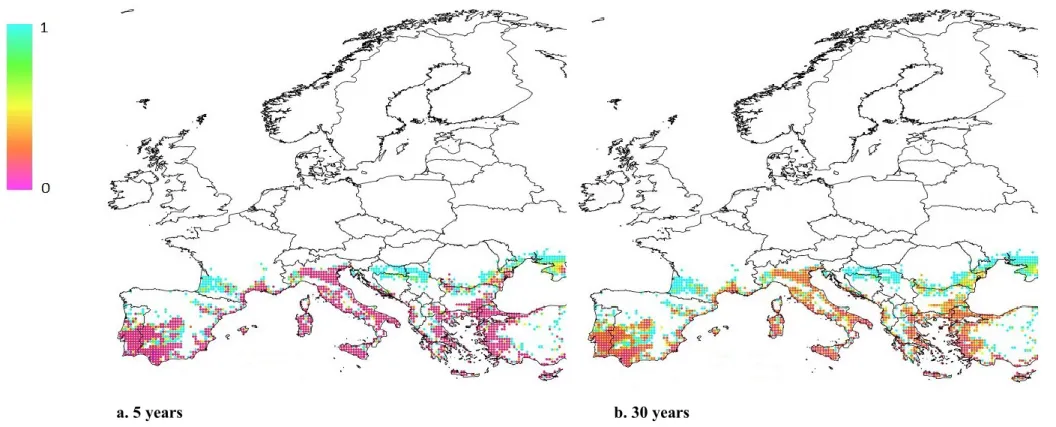
High biomass values (more than 20 g/m²) are predicted for a large number of coastal and inland Mediterranean locations. However, when the potential biomass is multiplied by the values of the scaling factors (resistance, resilience, management), the average realised biomass for the 5 (Figure 6a) and 30 (Figure 6b) years time horizon is considerably lower. The average realised biomass for the 30 years time horizon is lower than that of the 5 years time horizon, since it is expected that (i) macrophytes which are non-palatable to Pomacea will replace some of the palatable macrophytes, which will largely disappear, and (ii) natural enemies may reduce snail numbers more efficiently at the longer time horizon as less food is available for snails.
Figure 6a shows that quite a number of locations have a high average realised biomass; however, this number is significantly lower than in the graph showing total potential biomass (Figure 5). In Figure 6b, which represents the average realised biomass after a 30 years time horizon, biomass values no longer reach the highest classes.
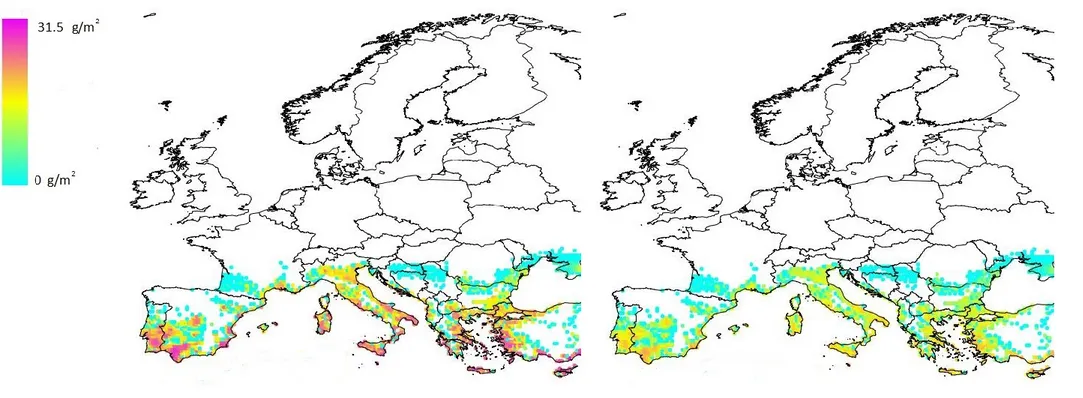
In Figure 7b (5 years time horizon) and Figure 8b (30 years time horizon), the realised biomass is shown for a scenario in which the potential biomass is multiplied by the lower limits of the 95 %
favourable scenario for the snails. As expected, in this case the biomass values are higher than in Figure 6a and b, which shows the average realised biomass.
a. 5 years, average realised biomass b. 30 years, average realised biomass
Figure 6: Distribution of average realised biomass (g/m²) of Pomacea canaliculata juveniles + adults over Europe estimated obtained by multiplying the potential biomass by the values of the scaling factors (resistance, resilience, management) estimated for two time horizons: (a) average realised biomass after 5 years; (b) average realised biomass after 30 years.
a.
5 years, more favourable scenario for snailsb.
5 years, less favourable scenario for snailsFigure 7: Distribution of realised biomass (g/m²) of Pomacea canaliculata juveniles + adults over Europe estimated with a time horizon of 5 years for two scenarios, obtained by multiplying the potential biomass by the limits of the 95 % confidence intervals of the three scaling factors: (a) upper limits corresponding to the more favourable scenario for the snails; (b) lower limits corresponding to the less favourable scenario for the snails.
a.
30 years, more favourable scenario for snailsb.
30 years, less favourable scenario for snailsFigure 8: Distribution of realised biomass (g/m²) of Pomacea canaliculata juveniles + adults over Europe estimated with a time horizon of 30 years for two scenarios, obtained by multiplying the potential biomass by the limits of the 95 % confidence intervals of the three scaling factors: (a) upper limits corresponding to the more favourable scenario for the snails; (b) lower limits corresponding to the less favourable scenario for the snails.
4.2. Effects of snail biomass on ecosystem traits
In this section, the effect of snail biomass on ecosystem traits is assessed and the results are presented in the form of histograms, which are in a number of cases accompanied by maps showing the spatial distribution of the impact on traits in the assessment area. The uncertainty associated with each trait– biomass relationship was not assessed.
The values of the variable ET as function of snail biomass for the different ecosystem traits were obtained by means of a procedure based on the collection of expert‘s judgement. During this procedure, the experts provided an agreed value for each trait with respect to the realised biomass normalised to 1 for the levels of 0 (no snails), 0.25, 0.5, 0.75 and 1. The reference level of the ecosystem trait is the state of the SPU without perturbation, and its value is equal to 1. The value of the variable ET is greater than or equal to zero. If the value is equal to zero, the level of the trait reduces to zero (i.e. there is a high impact on the ecosystem trait); if the value is equal to 1, the trait does not change (i.e. there is no impact on the trait). The level of the trait increases as the variable increases above 1. Next, the estimated values of the function ET provided by the experts for the levels of 0 (no snails), 0.25, 0.50, 0.75 and 1 were interpolated by means of a continuous function. The spatial distribution of the impact on ecosystem traits is evaluated by means of the value of the interpolating function in each node of the simulation grid, hereinafter referred to as index IET, for the
realised snail biomass in the node.
The same procedure for the estimation of ET and the index IET was applied for some of the biodiversity
components. The results are presented in Section 4.4. 4.2.1. Traits related to the macrophytes
At high snail density, sharp reductions in most palatable macrophyte species may be expected. Carlsson et al. (2004) demonstrated that invasion by P. canaliculata in Asian wetlands can dramatically reduce both the species richness and abundance of macrophytes. Macrophytes play a key role in nutrient cycling and act as important natural ‗biofilters‘ that ensure minimum water quality in fresh water ecosystems (Petr, 2000; Carlsson, 2006). Their nutrient cycling hampers phytoplankton growth and, subsequently, prevents the development of harmful and extremely costly toxic algal blooms (Pretty et al., 2003). Macrophytes are therefore key components in the wastewater treatment of both natural and constructed wetlands (Brix, 1994), and, furthermore, are a potent, eco-friendly and cost-efficient tool in the phytoremediation processes (i.e. whereby aquatic macrophytes remove or inactivate harmful heavy metals from industrial effluents (Haberl et al., 1995; Rai, 2009)). As a result of all these features, both the amount of macrophytes and macrophyte species richness are important for the self-cleaning functioning in these wetlands (Engelhardt and Ritchie, 2001) and, as Pomacea spp. herbivory affects both negatively, a Pomacea infestation will also remove these water-cleaning functions in wetlands. Therefore, wetlands are nowadays often protected and restored to create macrophytes-dominated wetland systems, and many countries in Europe have initiated extensive wetland construction programmes (Hansson et al., 2005).
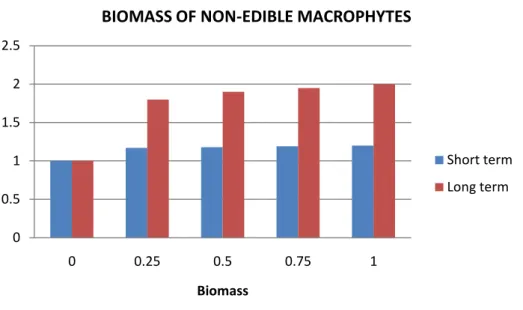
4.2.1.1. Edible macrophyte biomass
Macrophytes species with high contents of phenolic compounds and relatively low contents of nutrients (low C/N ratio) are generally less palatable to Pomacea, and some macrophytes are not consumed at all. In the long term these few species are likely to increase as a result of reduced competition from other macrophytes. Horgan et al. (2014) reviewed a number of studies assessing the effects of invasive Pomacea snails on natural and managed wetlands and predicted that ‗apple snails will shift macrophyte communities towards dominance by chemically and physically (high dry weight)
macrophyte is non-palatable when healthy and vigorous, the old and rotten leaves and stems may help to support Pomacea populations. Another interesting recent finding is that snail feeding may induce chemical plant defence in some of the palatable plant species, resulting in reduced snail feeding and slower growth (Morrison and Hay, 2011).
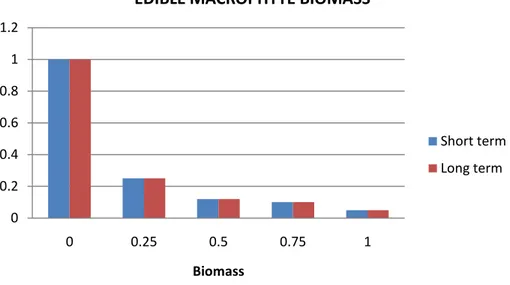
Based on the information in the histogram below (Figure 9) and in Figure 10a and b, the Panel concludes that in both the short term and the long term, the impact of increasing snail biomass on edible plant biomass is very serious in a large part of the Mediterranean area.
Figure 9: Reduction in edible macrophyte biomass due to the effect of snail biomass (x-axis). y-axis: the value of the variable ET in the short (5 years) and long term (30 years), as estimated by experts. 0 0.2 0.4 0.6 0.8 1 1.2 0 0.25 0.5 0.75 1 Biomass
EDIBLE MACROPHYTE BIOMASS
Short term Long term