Unraveling the complexity of tyrosine kinase inhibitor
–resistant
populations by ultra-deep sequencing of the
BCR-ABL kinase domain
Simona Soverini,
1Caterina De Benedittis,
1Katerina Machova Polakova,
2Adela Brouckova,
2David Horner,
3Michele Iacono,
4Fausto Castagnetti,
1Gabriele Gugliotta,
1Francesca Palandri,
1Cristina Papayannidis,
1Ilaria Iacobucci,
1Claudia Venturi,
1Maria Teresa Bochicchio,
1Hana Klamova,
2Federica Cattina,
5Domenico Russo,
5Paola Bresciani,
6Gianni Binotto,
7Barbara Giannini,
8Alexander Kohlmann,
9Torsten Haferlach,
9Andreas Roller,
9Gianantonio Rosti,
1Michele Cavo,
1Michele Baccarani,
1and Giovanni Martinelli
11Department of Experimental, Diagnostic and Specialty Medicine, Institute of Hematology “L. e A. Ser `agnoli”, University of Bologna, Bologna, Italy;2Institute of Hematology and Blood Transfusion, Prague, Czech Republic;3Department of Biosciences, University of Milan, Milan, Italy;4Roche Applied Science, Monza, Italy;5Unit of Blood Diseases and Stem Cell Transplantation University of Brescia, Brescia, Italy;6Department of Medical and Surgical Sciences, Azienda Ospedaliero-Universitaria Policlinico, University of Modena e Reggio Emilia, Modena, Italy;7Department of Clinical and Experimental Medicine, Hematology Section, Padua University School of Medicine, Padua, Italy;8Laboratorio Unico Area Vasta Romagna, Pievesestina di Cesena, Italy; and 9
Munich Leukemia Laboratory, Munich, Germany
Key Points
• UDS demonstrated that
BCR-ABL KD mutations detectable
with conventional methods
may just be the tip of the
iceberg.
• The information provided
by conventional Sanger
sequencing may not always
be sufficient to predict
responsiveness to a given TKI.
In chronic myeloid leukemia and Philadelphia chromosome–positive acute lymphoblastic
leukemia, tyrosine kinase inhibitor (TKI) therapy may select for drug-resistant BCR-ABL
mutants. We used an ultra-deep sequencing (UDS) approach to resolve qualitatively and
quantitatively the complexity of mutated populations surviving TKIs and to investigate
their clonal structure and evolution over time in relation to therapeutic intervention. To this
purpose, we performed a longitudinal analysis of 106 samples from 33 patients who had
received sequential treatment with multiple TKIs and had experienced sequential relapses
accompanied by selection of 1 or more TKI-resistant mutations. We found that
con-ventional Sanger sequencing had misclassified or underestimated BCR-ABL mutation
status in 55% of the samples, where mutations with 1% to 15% abundance were detected.
A complex clonal texture was uncovered by clonal analysis of samples harboring multiple
mutations and up to 13 different mutated populations were identified. The landscape of
these mutated populations was found to be highly dynamic. The high degree of complexity
uncovered by UDS indicates that conventional Sanger sequencing might be an inadequate
tool to assess BCR-ABL kinase domain mutation status, which currently represents an important component of the therapeutic decision
algorithms. Further evaluation of the clinical usefulness of UDS-based approaches is warranted. (Blood. 2013;122(9):1634-1648)
Introduction
The
first Bcr-Abl tyrosine kinase inhibitor (TKI), imatinib, was
in-troduced in the treatment protocols of chronic myeloid leukemias
(CMLs) and Philadelphia chromosome–positive (Ph
1) acute
lym-phoblastic leukemias (ALLs) more than a decade ago.
1Soon after,
however, it was observed that BCR-ABL kinase domain (KD)
mutated forms with reduced or no sensitivity to imatinib could be
selected.
2Second-(dasatinib/nilotinib/bosutinib) and third-generation
(ponatinib) TKIs with much fewer insensitive mutations are now
already approved or pending approval (Table 1
3-10). Sequential switch
from a TKI to another may rescue response, although further gain of
mutations by the same (compound mutations) or different
(poly-clonal mutations) Ph
1clones is possible.
11Capillary Sanger sequencing (SS) is the most widely adopted
method to assess BCR-ABL KD mutation status
3despite its multiple
technical limitations: it cannot robustly identify mutated populations
,10% to 15%, it provides only rough estimates of mutated clone
abundance, and it cannot discriminate between polyclonal and
compound mutations, unless it is preceded by a cumbersome step of
cloning. Before the advent of next-generation sequencing (NGS)
technologies, however, no method was available that could improve
upon these limitations while allowing for scanning of any sequence
variant at any position within the KD. NGS carries out thousands to
millions of picoliter-scale sequencing reactions simultaneously yielding
thousands to millions of sequence reads, each one corresponding
to a single, clonally ampli
fied, DNA molecule.
12The use of this
approach to sequence a nucleotide position multiple times, thus
achieving high sensitivity, is de
fined as ultra-deep sequencing (UDS).
Among NGS technologies commercially available, the Roche
454 Life Sciences is particularly suitable for projects of targeted
amplicon resequencing, the average read length being 400 to 600
bp.
13Its application for the UDS of the BCR-ABL KD would allow
for: (1) full characterization of the spectrum of minor (,10%-15%)
mutated variants; (2) the ability to follow the dynamics of resistant
mutations over time; and (3) reconstruction of the clonal architecture
of mutated populations in the case of multiple mutations occurring
within the same amplicon.
We thus decided to take advantage of a UDS-based approach in
order to resolve qualitatively and quantitatively the complexity of
mutated Ph
1populations surviving TKIs and to investigate their
clonal structure and evolution over time in relation to treatment.
Materials and methods
Patients
We retrospectively selected 33 CML or Ph
1ALL patients who had received
sequential treatment with multiple TKIs (2-4 TKIs among imatinib, dasatinib,
nilotinib, ponatinib) and had experienced sequential relapses accompanied by
selection of 1 or more TKI-resistant mutations. Their main characteristics are
presented in Table 2. Written informed consent had been obtained, in
ac-cordance with the Declaration of Helsinki. Up to 10 samples were analyzed for
each patient, for a total of 106 samples.
We also randomly selected and analyzed 15 CML patients who had
achieved an optimal response to imatinib (according to the European Leukemia
Net [ELN] definitions)
14for comparison.
This study was approved by the review boards of the S.
Orsola-Malpighi Hospital (Bologna) and of the Institute of Hematology and Blood
Transfusion (Prague); it was conducted in accordance with the Declaration
of Helsinki.
SS of the BCR-ABL KD
SS of the BCR-ABL KD was performed on an ABI PRISM 3730 (Applied
Biosystems) as previously described.
15UDS of the BCR-ABL KD
RNA was converted to complementary DNA (cDNA) with the Transcriptor
High-Fidelity cDNA Synthesis kit (Roche Applied Science). To select for
the translocated ABL allele, a
first step of amplification was performed by
polymerase chain reaction (PCR) with a forward primer either on BCR
exon 1a (in case of e1a2 BCR-ABL fusion) or on the border of BCR exons
12-13 (in case of b2a2 or b3a2 BCR-ABL fusions) and a reverse primer on
ABL, exon 10. A second ampli
fication step was then performed to generate
4 partly overlapping amplicons covering the KD of ABL (supplemental
Figure 1, available on the Blood website), tagged with a 10-base “barcode”
sequence (multiplex identi
fier) for sample pooling. Amplifications were
done using the FastStart High-Fidelity PCR System kit (Roche Applied
Science). UDS was performed on a Roche GS Junior (454-Life Sciences)
according to the manufacturer
’s instructions. Primer sequences, PCR, and
sequencing protocols are detailed in the supplemental Methods. Amplicon
Variant Analyzer (version 2.7; 454-Life Sciences) and Sequence Pilot
(version 4.0.1; JSI-Medical Systems) were used to align reads to the
reference ABL sequence (GenBank accession no. X16416.1) and to calculate
variant frequencies. The presence of all relevant mutations was also manually
veri
fied by inspection of individual flowgrams at the corresponding
posi-tions, with particular attention to homopolymeric regions. Samples harboring
multiple mutations were analyzed to gain further insights into the clonal
architecture of mutated populations. To this purpose, 2 further amplicons
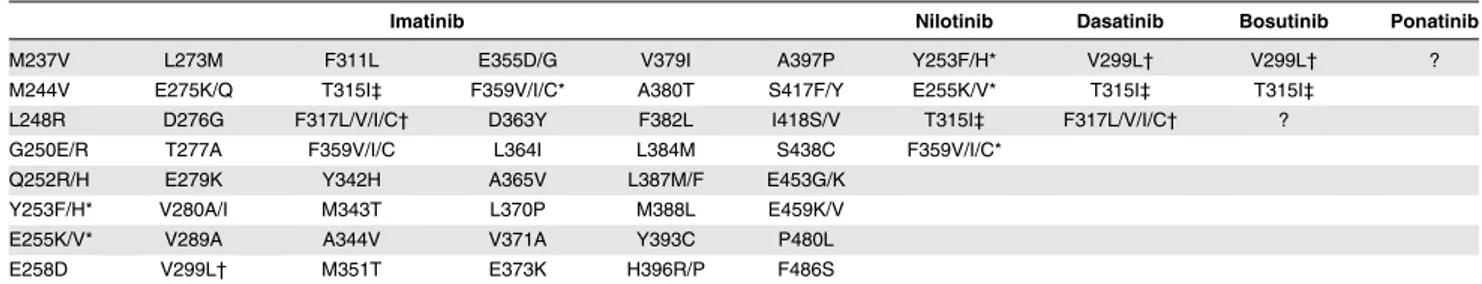
Table 1. Summary of the BCR-ABL KD amino acid substitutions identified in clinical samples from patients reported to be resistant to the
currently approved TKIs
Imatinib Nilotinib Dasatinib Bosutinib Ponatinib
M237V L273M F311L E355D/G V379I A397P Y253F/H* V299L† V299L† ?
M244V E275K/Q T315I‡ F359V/I/C* A380T S417F/Y E255K/V* T315I‡ T315I‡
L248R D276G F317L/V/I/C† D363Y F382L I418S/V T315I‡ F317L/V/I/C† ?
G250E/R T277A F359V/I/C L364I L384M S438C F359V/I/C*
Q252R/H E279K Y342H A365V L387M/F E453G/K
Y253F/H* V280A/I M343T L370P M388L E459K/V
E255K/V* V289A A344V V371A Y393C P480L
E258D V299L† M351T E373K H396R/P F486S
Imatinib, dasatinib, and nilotinib are approved both by the Food and Drug Administration (FDA) and European Medicines Agency (EMA) for first- or subsequent-line use. Busutinib and ponatinib have recently been approved by the FDA for patients with resistance (or intolerance) to prior TKI therapy. Amino acid substitutions reported to be capable to survive imatinib therapy are almost 50.3For patients harboring T315I, pharmacologic options include the recently FDA-approved ponatinib (for CML and Ph1ALL patients with resistance to a prior TKI therapy)4or omacetaxine mepesuccinate,5an alkaloid with a mechanism of action other than Bcr-Abl kinase inhibition (for CP or AP CML patients with resistance to 2 or more TKIs).
? indicates that bosutinib-resistant mutations other than T315I and ponatinib-resistant mutations, if any, still need to be assessed. *Y253F/H, E255K/V, F359V/I/C retain insensitivity also to nilotinib.6,7
†V299L and F317L/V/I/C retain insensitivity also to dasatinib.7-9
‡T315I is a pan-resistant mutation retaining insensitivity to dasatinib, nilotinib, and bosutinib.10
Table 2. Features of the patients included in the present study
Features n
Patients, total 33
Median age, y (range) 52 (18-79)
Male to female ratio 19:14
Disease phase/type
CML 18
greater detail by Grossmann et al.
Moreover, we further explored and
con
firmed the sensitivity and reproducibility of our UDS-based BCR-ABL
KD mutation screening assay in a series of additional experiments detailed in
the supplemental Methods.
Because (1) several studies concordantly demonstrated high reliability
and reproducibility of 454 technology for variants
>1%,
18-20and (2) serial
dilution experiments (see supplemental Methods for details) con
firmed the
ability of our assay to detect mutations as low as 1% (whereas lower levels
were not investigated), we decided to reduce the likelihood of false-positive
results by
filtering-out variants with ,1% abundance and to exploit high
coverage only for haplotype and clonal evolution analyses.
Phylogenetic analysis
Multiple read alignment and clustering was done with Jalview (version 2.8;
www.jalview.org). Phylogenetic reconstruction was performed using the
bioneighbor joining method with the Kimura 2-parameter substitution model
with 1000 bootstrap replicates as implemented in the program SEAVIEW.
21,22To minimize the impact of sequencing errors, only sequences that
represent
.0.5% of the reads sequenced for at least 1 time point were
considered for phylogenetic analyses.
Results
BCR-ABL KD mutation status may be more complex than
SS shows
All the nucleotide substitutions that had been detected by SS (“major”
mutations) were also detected by UDS, with fairly good concordance
between the percentage of variant reads assessed by UDS and the
mutation abundance estimated from the relative peak height in the
SS chromatogram (Table 3; response definitions in references 14 and
23). In 58 of 106 (55%) samples, however, UDS revealed that
mutations undetectable by SS (from now on referred to as
“minor”
mutations; abundance between 1% and 15%) were also present
(Table 3). The type of minor mutations detected by UDS could
frequently be accounted for by TKI exposure history because half
(57 of 111, 51%) could be recognized to be poorly sensitive either
to the TKI being administered or to the previous TKI received, or
both (Table 1 reports the mutations know to be resistant to imatinib,
dasatinib, nilotinib). In 4 patients (MBC-11, ALL-23, ALL-32,
ALL-33), different Ph
1populations were found to have acquired
different nucleotide substitutions leading to the same TKI-resistant
amino acid change (eg, g.c and g.t at position 903, both resulting
in a Q252H mutation; t
.c at 1096 and c.a at 1098, both resulting
in an F317L mutation). In the remaining cases, minor mutations
were either silent (20 of 111, 18%) or never reported in association
with TKI resistance (34 of 111, 28%).
Samples from 15 CML patients who had achieved stable
opti-mal response to imatinib
14were also analyzed by UDS, for
com-parison. None were found to harbor point mutations at a cutoff
level of
>1%.
representative examples. The great majority of the samples turned
out to be a complex mosaic of populations harboring the mutations
alone as well as in combination (Table 3). Single mutants were
136 of 274 (49.6%); compound mutants were almost as frequent
(Figure 1).
The landscape of mutated populations is highly dynamic
Longitudinal quantitative follow-up of mutated populations painted
an elaborate picture of how the relative frequency of competing
populations can ebb and
flow over time and with therapeutic
intervention (Table 3). Some representative examples are illustrated
in Figure 2. The switch from a TKI to another determined the fall of
previously dominant population(s) and the rise of new dominant one(s),
not necessarily preexisting at the time of switchover (or, at least,
not always detectable at the time of switchover with the level of
sensitivity allowed by our experimental approach). A new dominant
population could be unrelated to the former, rather arising from an
unmutated population (as exemplified in Figure 2A-B), or could
result from the acquisition of new mutations by the former, which
generated compound mutants (Figure 2B-C). In several cases, the
evolution of the pattern of mutated populations suggested that the
same mutation could have been acquired in parallel by independent
populations (ie, 1 unmutated and 1 already harboring a mutation;
Figure 2C-D). Selection/deselection of mutated populations could
be strikingly rapid. Some compound mutants (M351T1F317L,
Y253H1T315I, Y253H1F317L, F359V1T315I) were observed to
have higher selective advantage over the respective single mutants.
Other compound mutants (H396R1F317L, H396R1T315I, T315I1
F317L, E355G
1T315I, G250E1F317L, E255V1Y253H, E255V1
T315I) were identified that did not overcome the respective single
mutants. The E255K
1T315I compound mutant was detected in 6
cases: in 3, it became dominant over the E255K and T315I mutants,
whereas in another 3 it did not. The triple and quadruple compound
mutants detected
fluctuated at low levels and were never able to gain
dominance, except in patient LBC-17, suggesting that accumulation
of
.2 mutations, when tolerated, has almost always limited selective
advantage.
Further insights into BCR-ABL KD sequence evolution:
a phylogenetic approach
Figure 3 shows the neighbor joining bootstrap consensus tree for
sequences recovered at 5 time points for patient ALL-30. The tree
can be considered as consisting of 3 clusters. Reassuringly, within
each cluster, both the timing of
first observation of each sequence
and the types of amino acid substitutions present are fairly
consis-tent, suggesting that, despite the low bootstrap support for key
branches, relevant hypotheses can be generated from the
phyloge-netic analysis. The tree is consistent with E255V occurring once,
along the branch dividing cluster A from the rest of the tree. This
substitution, which affords resistance to imatinib and nilotinib, is
Table 3. Comparison between mutations detected by SS and mutations detected by UDS and estimated clonal composition of the samples
harboring multiple mutations as assessed by UDS
Code Date TKI Line Mutations by SS Mutations by UDS*
Estimated mutated
populations by UDS† Disease status and response CP-01-01 2/29/2012 DAS 2 H396R (;50),
F317L (;30)
H396R (55.05), F317L (28.23) H396R (43.99), F317L (17.17), H396R1F317L (11.06)
Complete cytogenetic response but no molecular response after 6 mo on DAS CP-01-02 5/2/2012 DAS 2 F317L (;70), H396R (;20) F317L (63.07), H396R (15.74), T315I (5.42) F317L (55.47),H396R (7.60), H396R1F317L (7.38), T315I (4.44), H396R1T315I (0.76), F317L1T315I (0.22) Complete hematologic response, cytogenetic response not assessed
CP-01-03 7/7/2012 NIL 3 T315I (;100) T315I (99.28) T315I (99.28) Complete hematologic response, no cytogenetic response
CP-02-01 3/4/2008 IM 1 F359V (;20) F359V (17.33) F359V (17.33) Loss of complete hematologic response after 5 mo on IM CP-02-02 4/2/2008 DAS 2 T315I (;100) T315I (94.80) T315I (94.80) Progression to LBC CP-03-01 3/7/2005 IM 1 G250E (;100) G250E (93.72), F317L (1.78) G250E (92.20), G250E1F317L
(1.52), F317L (0.26)
Minor cytogenetic response after 12 mo on IM CP-03-02 9/14/2005 DAS 2 G250E (;70),
F317L (;20)
G250E (74.71), F317L (22.51) G250E (62.00), G250E1F317L (12.71), F317L (9.80)
Minor cytogenetic response
CP-03-03 11/17/2005 DAS 2 G250E (;70), F317L (;30)
G250E (60.73), F317L (27.06) G250E (46.44), G250E1F317L (14.29), F317L (12.77) Not available CP-03-04 2/13/2006 DAS 2 G250E (;50), F317L (;40) G250E (45.47), F317L (37.49), H295H (4.91), C330C (1.48) G250E (30.46), F317L (20.40), G250E1F317L (12.47), F317L1H295H (2.14), G250E1F317L1H295H (1.19), H295H (0.89), F317L1C330C (0.82), G250E1H295H (0.69), G250E1F317L1C330C (0.47), G250E1C330C (0.19) Complete hematologic response, no cytogenetic response CP-03-05 5/15/2006 NIL 3 G250E (;100), E255E (;100) G250E (87.17), E255E (85.78), F317L (10.44) G250E1E255E (77.90), G250E1F317L1E255E (7.66), F317L (2.56), G250E (1.61), F317L1E255E (0.22) Complete hematologic response, no cytogenetic response
CP-04-01 10/20/2005 IM 1 L384M (;100) L384M (87.04), E255V (15.14) N.A. Loss of complete cytogenetic response after 24 mo on IM CP-04-02 12/22/2005 NIL 2 L384M (;70),
E255V (;30)
L384M (68.33), E255V (32.02), M351I (2.64)
N.A. Loss of complete hematologic response
CP-04-03 1/24/2006 NIL 2 E255V (;100) E255V (80.71), L384M (14.40) N.A. No hematologic response CP-05-01 1/20/2005 IM 1 G250E (;100) G250E (99.51) G250E (99.51) Loss of complete cytogenetic
response after 36 mo on IM CP-05-02 3/23/2005 DAS 2 F317L (;30), G250E (;30) F317L (24.93), G250E (22.89), C305C (11.70), K274E (10.38) G250E (16.52), F317L (15.06), C305C (9.30), G250E1F317L (4.30), K274E (4.09) F317L1 K274E (3.70), G250E1 K274E (1.04), C305C1F317L (0.97), C3051CK274E (0.91), G250E1F317L1K274E (0.51), G250E1C305C1 F317L (0.39), G250E1 C305C1K274E (0.13) Not available
CP-05-03 4/20/2005 DAS 2 F317L (;100) F317L (99.50) F317L (99.50) Complete hematologic response, no cytogenetic response CP-06-01 4/19/2005 IM 1 H396R (;100) H396R (99.63), A413A (1.71),
K247N (1.11)
N.A. Partial cytogenetic response after 18 mo on IM
Code Date TKI Line Mutations by SS Mutations by UDS* populations by UDS† Disease status and response CP-06-02 5/17/2005 DAS 2 None H396R (16.07), F317L (7.43) H396R (16.07), F317L (7.43) Complete cytogenetic response
(5 0/200 Ph1by FISH) CP-06-03 6/14/2005 DAS 2 F317L (;20) F317L (20.86), H396R (3.54) F317L (20.20), H396R (2.88),
F317L1H396R (0.66)
Loss of complete cytogenetic response (5 30/200 Ph1by FISH) CP-07-01 3/22/2007 IM 1 None A433A (1.48), P408P (1.42), K378R (1.32) A433A (1.48), P408P (1.42), K378R (1.32)
No cytogenetic response after 12 mo on IM
CP-07-02 9/8/2009 NIL 2 T315I (;30) T315I (25.99), M351T (5.93), T345T (6.37), R332R (5.91) T315I (20.47), T345T (6.15), R332R (5.75), T315I1 M351T (5.30), M351T (0.47), T315I1T345T (0.22), M351T1R332R (0.16) No cytogenetic response
CP-07-03 3/4/2010 NIL 2 T315I (;70) T315I (65.85), Y253H (16.65), W235R (3.77), F497L (3.14), T406I (2.43), Q477Q (2.37), F486S (2.28), D363N (1.47)
N.A. No cytogenetic response; transplanted 6 mo later
CP-08-01 6/22/2010 IM 1 M351T (;100), E499E (;100)
M351T (99.84), E499E (99.84) N.A. No cytogenetic response after 12 mo on IM
CP-08-02 4/26/2012 NIL 2 Y253H (;100), E499E (;100)
Y253H (95.64), E499E (99.67), M351T (3.20)
N.A. No cytogenetic response
CP-09-01 6/22/2004 IM 1 M244V (;20) M244V (19.4), H396R (2.88), L298V (1.91), L364I (1.64)
N.A. No cytogenetic response after 15 mo on IM
CP-09-02 7/14/2005 IM 1 M244V (;80) M244V (79.31), H396R (6.75), L298V (3.75), L364I (3.28)
N.A. Loss of complete hematologic response
CP-09-03 9/3/2007 DAS 2 M244V (;70), T315A (;60)
M244V (73.36), T315A (57.53), F425S (2.18), T406I (1.75)
N.A. Complete hematologic
response but no cytogenetic response
AP-10-01 3/7/2005 IM 1 E355G (;50) E355G (43.75), L341P (21.75), F496L (19.63), L428L (11.01), T315I (10.24), Y456Y (4.81)
N.A. Progression from CP to AP after 9 mo on IM
AP-10-02 4/11/2005 DAS 2 T315I (;50) T315I (42.60), F317L (1.25) T315I (42.60), F317L (1.25) Progression to MBC MBC-11-01 4/12/2010 IM 1 M351T (;100),
L248V (;30)
N.D. N.D. Loss of complete hematologic
response after 6 mo on IM MBC-11-02 8/23/2010 DAS 2 M351T (;100), F317L (;70), L248V (;20) M351T (100.00), F317L(ttc.tta) (65.52), L248V (19.45), del(248-274) (9.52), F317L(ttc.ctc)(8.52), V299L (1.99) M351T1F317L(ttc.tta) (52.60), M351T (10.30), M351T1L248V (9.29), M351T1F317L(ttc.tta)1 L248V (8.78), M351T1 F317L(ttc.ctc) (6.33), M351T1del(248-274)(4.77), M351T1F317L(ttc.tta)1del (248-274)(4.14), M351T1 V299L (1.41), M351T1 L248V1F317L(ttc.ctc) (1.19), M351T1del(248-274) 1F317L(ttc.ctc) (0.61), M351T1F317L(ttc.ctc)1 V299L (0.39), M351T1 L248V1V299L (0.19) No hematologic response MBC-12-01 3/5/2012 IM 1 F359V (;70) F359V (63.24), L387M (4.18), M351T (3.42), V379I (1.62) F359V (60.26), L387M (2.47), M351T (2.45), F359V1L387M (1.61), V379I (1.12), F359V1
Loss of complete cytogenetic response after 12 mo on IM
For SS results, mutation-relative abundance was assessed on the basis of variant peak height. In the TKI column, the TKI being administered at the time of analysis is indicated. In the Line column, the number of different lines of TKI therapy that had been administered to the patient is indicated. Disease status and response at each time point are also detailed. Response definitions as in Baccarani et al14and Vignetti et al.23
Table 3. (continued)
Code Date TKI Line Mutations by SS Mutations by UDS*
Estimated mutated
populations by UDS† Disease status and response M351T (0.87), F359V1V379I (0.50), M351T1L387M (0.10) MBC-12-02 9/24/2012 DAS 2 L387M (;60), T315A (;50), F359V (;20) L387M (57.43), T315A (57.19), F359V (16.24), T315I (8.22), F317V (3.98), F317L (1.15) L387M1T315A (55.99), F359V1 T315I (8.06), F359V (4.37), F359V1F317V (3.63), T315A (1.20), L387M1F317L (0.97), F317V (0.19), F359V1F317L (0.18), L387M1T315I (0.16), L387M1F317V (0.16), L387M (0.15)
Loss of complete hematologic response
MBC-13-01 5/28/2010 DAS 2 T315A (;100) T315A (73.75), V299L (8.19) T315A (72.40), V299L (6.84), T315A1V299L (1.35)
Loss of complete hematologic response after 6 mo on DAS MBC-13-02 12/9/2010 NIL 3 T315A (;100),
E255V (;70), G250E (;15)
T315A (92.87), E255V (69.74), G250E (12.22), E255K (1.03)
T315A1E255V (65.07), T315A (15.72), T315A1G250E (10.44), E255V (3.73), T315A1E255V1G250E (0.94), G250E (0.84), T315A1E255K (0.70), E255K (0.33) No hematologic response LBC-14-01 12/20/2011 IM 1 G250E (;40), E255V (;20) G250E (34.28), E255V (15.05), E255K (2.34), Y253F (1.10) G250E (32.91), E255V (14.09), E255K (2.13), Y253F (0.90), G250E1E255V (0.96), G250E1E255K (0.21), G250E1Y253F (0.20)
Progression to lymphoid bast crisis after 32 mo on IM
LBC-14-02 2/8/2012 DAS 2 T315I (;30) T315I (28.92) T315I (28.92) No hematologic response LBC-15-01 5/26/2011 IM 1 Y253H (;100) Y253H (99.88) Y253H (99.88) Hematologic relapse LBC-15-02 12/5/2011 DAS 2 Y253H (;50),
F317L (;50)
Y253H (54.90), F317L (54.40) Y253H1F317L (43.00), Y253H (11.90), F317L (11.40)
Hematologic relapse
LBC-16-01 3/14/2005 IM 1 E255K (;100) E255K (98.84) E255K (98.84) Progression to LBC after 9 mo on IM
LBC-16-02 4/19/2005 DAS 2 E255K (;100), T315I (;100)
E255K (99.84), T315I (99.48), L273S (1.30)
E255K1T315I (97.83), E255K (0.71), E255K1T315I1 L273S (1.30), T315I (0.35)
No hematologic response
LBC-16-03 5/23/2005 DAS 2 E255K (;100), T315I (;100)
E255K (99.53), T315I (99.53) E255K1T315I (99.53) No hematologic response LBC-17-01 11/29/2010 IM 1 L387M (;30) L387M (34.12) L387M (28.18) Loss of complete hematologic
response after 6 mo on IM LBC-17-02 2/27/2012 DAS 2 L387M (;100), T315I (;50), M318V (;50), F317L (;50), Y320N (;50) L387M (96.33), T315I (51.46), M318V (51.19), F317L (45.21), Y320N (44.79) L387M1T315I1M318V (47.90), L387M1F317L1Y320N (42.21), L387M (2.63), T315I1 M318V (1.82), F317L1Y320N (1.37), L387M1F317L (1.10), L387M1T315I1M318V1 Y320N (0.80), L387M1M318V (0.50), L387M1T315I1F317L (0.36), L387M1Y320N (0.25), L387M1T315I (0.25), L387M1T315I1M318V1 F317L (0.17), L387M1T315I1 Y320N (0.16)
Loss of cytogenetic and hematologic response
LBC-18-01 11/11/2007 IM 1 F359V (;60) F359V (57.89) F359V (57.89) Progression to LBC after 3 mo on IM
LBC-18-02 1/17/2008 DAS 2 None F317L (8.48), F317I (1.02), F359V (1.02)
F317L (8.48), F317I1F359V (1.02)
Complete hematologic response, partial cytogenetic response
Code Date TKI Line Mutations by SS Mutations by UDS* populations by UDS† Disease status and response LBC-18-03 2/12/2008 DAS 2 F359V (;100), F317I (;100) F317I (92.35), F359V (90.11), F317L (4.25) F359V1F317I (88.01), F317I (4.34), F317L (3.12), F359V1F317L (1.13), F359V (0.97)
Loss of complete hematologic response
ALL-19-01 9/27/2005 IM 1 Y253H (;100) Y253H (99.79) Y253H (99.79) Hematologic relapse after 6 mo on IM
ALL-19-02 1/3/2006 DAS 2 None P465L (2.78), I432I (1.60), T277I (1.56), E352V (1.41), A474A (1.15)
N.A. Complete hematologic and
cytogenetic response, molecularly detectable disease
ALL-19-03 3/2/2006 DAS 2 None A399V (1.58) A399V (1.58) Complete hematologic and cytogenetic response, molecularly detectable disease ALL-19-04 6/15/2006 DAS 2 Y253H (;100),
T315I (;50)
Y253H (99.70), T315I (40.29), N336S (5.39), W405R (1.89)
N.A. Hematologic relapse
ALL-20-01 1/11/2005 IM 1 M351T (;100) M351T (99.91) M351T (99.91) Hematologic relapse after 12 mo on IM
ALL-20-02 3/12/2005 DAS 2 None L370L (5.45), I432I (2.65) N.A. Complete hematologic and cytogenetic response, molecularly detectable disease ALL-20-03 1/16/2006 DAS 2 M351T (;100), F317L (;50) M351T (99.77), F317L (53.27) M351T (46.50), M351T1F317L (53.27) Hematologic relapse ALL-20-04 4/7/2006 DAS 2 M351T (;100), F317L (;100) M351T (95.46), F317L (85.32), A399T (5.64), Y353H (1.00) M351T1F317L (85.32), M351T1A399T (5.64), M351T (3.50), M351T1 F317L1Y353H (1.00) Progressive disease
ALL-21-01 5/30/2005 DAS 2 F317L (;100) F317L (99.99), M237I (2.03) F317L (97.96), F317L1M237I (2.03)
Hematologic relapse after 3 mo on DAS ALL-21-02 10/27/2005 NIL 3 F317L (;100), Y253H (;20) F317L (98.59), Y253H (17.35) F317L (81.24), F317L1Y253H (17.35) Complete hematologic response but no cytogenetic response ALL-21-03 1/16/2006 NIL 3 F317L (;100), Y253H (;20) F317L (100.00), Y253H (18.77) F317L (81.23), F317L1Y253H (18.77) Hematologic relapse ALL-21-04 3/17/2006 NIL 3 F317L (;100), Y253H (;100) F317L (100.00), Y253H (100.00)
F317L1Y253H (100.00) Progressive disease ALL-22-01 12/23/2005 IM 1 F359V (;100) F359V (99.76), M237T (2.11) N.A. Hematologic relapse after 26 mo
on IM ALL-22-02 1/29/2005 DAS 2 F359V (;100),
T315I (;100)
F359V (99.30), T315I (98.77), Y449Y (10.50)
N.A. Progressive disease
ALL-23-01 9/14/2011 DAS 2 E255K (;30), T315I (;20) E255K (24.04), T315I (19.37), G303G (1.51) E255K (20.88), T315I (16.21), E255K1T315I (3.16), G303G (1.51)
Hematologic relapse after 9 mo on DAS
ALL-23-02 10/27/2011 PON 3 T315I (;100) T315I (99.78), Y312C (1.22) T315I (98.28), T315I1Y312C (1.22)
Complete hematologic response
ALL-23-03 11/3/2011 PON 3 T315I (;100) T315I (99.83) T315I (99.83) Complete hematologic response ALL-23-04 12/15/2011 POST-SCT,
NONE
/ None None None Complete hematologic and
cytogenetic response, molecularly detectable disease ALL-23-05 1/11/2012 POST-SCT,
IM
4 E255K (;100) E255K (99.88) E255K (99.88) Complete hematologic response but loss of cytogenetic response
ALL-23-06 1/25/2012 PON 5 E255K (;100) E255K (99.36), S417S (2.21) N.A. Hematologic relapse ALL-23-07 2/8/2012 PON 5 E255K (;30) E255K (22.49) E255K (22.49) Complete hematologic response
For SS results, mutation-relative abundance was assessed on the basis of variant peak height. In the TKI column, the TKI being administered at the time of analysis is indicated. In the Line column, the number of different lines of TKI therapy that had been administered to the patient is indicated. Disease status and response at each time
Table 3. (continued)
Code Date TKI Line Mutations by SS Mutations by UDS*
Estimated mutated
populations by UDS† Disease status and response ALL-23-08 2/15/2012 PON 5 E255K (;100) E255K (99.88) E255K (99.88) Partial hematologic response ALL-23-09 3/12/2012 DAS 6 E255K (;70),
T315I (;50) E255K (76.10), T315I (57.35), Q252H (cag.cac)(14.19), Q252H (cag.cat)(7.49), G250E (1.05) E255K1T315I (51.60), E255K1Q252H (cag.cac) (13.94), E255K1Q252H (cag.cat) (7.34),T315I (5.75), E255K (2.52), E255K1 G250E (0.70), Q252H (cag.cac) (0.25), G250E (0.35), Q252H (cag. cat) (0.15) Progressive disease
ALL-23-10 3/28/2012 PON 7 E255K (;100), T315I (;100)
E255K (99.64), T315I (98.56) E255K1T315I (98.20), E255K (1.44), T315I (0.36)
Progressive disease
ALL-24-01 6/15/2011 NIL 1 Y253H (;30) Y253H (27.35), P465L (1.55) N.A. Complete hematologic and cytogenetic response, molecularly detectable disease
ALL-24-02 7/28/2011 IM 2 Y253H (;100) Y253H (99.99), R367L (3.62) Y253H (96.37), Y253H1R367L (3.62)
Complete hematologic and cytogenetic response, but 1-log increase in BCR-ABL transcript levels ALL-24-03 3/1/2012 DAS 3 None Y302S (1.62) Y302S (1.62) Complete hematologic and
cytogenetic response, no molecular assessment performed
ALL-24-04 3/29/2012 DAS 3 Y253H (;100), T315I (;100) Y253H (99.10), T315I (99.10), L273L (1.09) Y253H1T315I (98.01); Y253H1T315I1L273L (1.09) Hematologic relapse
ALL-25-01 12/2/2011 IM 1 Y253H (;20) Y253H (18.38) Y253H (18.38) Complete hematologic and cytogenetic response, molecularly detectable disease after 18 mo on IM ALL-25-02 1/18/2012 DAS 2 Y253H (;100),
T315I (;100)
Y253H (87.69), T315I (86.16) Y253H1T315I (80.53), Y253H (7.16), T315I (5.63)
Hematologic relapse
ALL-26-01 1/11/2012 IM 1 E255K (;60) E255K (54.75), F359V (13.81), T315I (3.84)
N.A. Hematologic relapse after 6 mo on IM
ALL-26-02 6/16/2012 DAS 2 T315I (;100) T315I (99.42) T315I (99.42) Progressive disease ALL-27-01 1/14/2011 IM 1 T315I (;100) T315I (99.87) T315I (99.87) Complete hematologic but not
cytogenetic response after 3 mo on IM
ALL-27-02 1/31/2011 IM 1 T315I (;100) T315I (99.74) T315I (99.74) Stable disease ALL-27-03 2/7/2011 NIL 2 T315I (;80) T315I (75.55), E255K (9.70),
E255V (1.53)
T315I (70.47), E255K (5.10), T315I1E255K (4.60), E255V (1.05), T315I1E255V (0.48)
Stable disease
ALL-27-04 2/21/2011 NIL 2 T315I (;60), E255K (;30)
T315I (53.80), E255K (25.63), E255V (1.33)
T315I (46.10), E255K (18.26), T315I1E255K (7.37), E255V (1.00), T315I1E255V (0.33) Hematologic relapse ALL-28-01 12/5/2007 IM 1 Y253H (;50), E255K (;20) Y253H (56.01), E255K (14.92), T315I (8.33), Q252H (6.32), A269T (3.57), Y253F (1.37) Y253H (52.30), E255K (14.70), T315I (5.29), Q252H (3.92), Y253H1T315I (2.93), Q252H1A269T (2.40), Y253F (1.26), Y253H1269T (0.63), A269T (0.54), Y253H1E255K (0.15), Y253F1T315I (0.11)
Hematologic relapse after 9 mo on IM
ALL-28-02 3/26/2008 DAS 2 T315I (;100) T315I (90.96) T315I (90.96) Progressive disease For SS results, mutation-relative abundance was assessed on the basis of variant peak height. In the TKI column, the TKI being administered at the time of analysis is indicated. In the Line column, the number of different lines of TKI therapy that had been administered to the patient is indicated. Disease status and response at each time
Code Date TKI Line Mutations by SS Mutations by UDS* populations by UDS† Disease status and response ALL-29-01 6/6/2012 IM POST-SCT 2 T315? T315M (30.20) T315M (30.20) Complete hematologic response, molecularly detectable disease ALL-29-02 6/20/2012 IM 2 T315? T315M (22.32) T315M (22.32) Hematologic relapse ALL-29-03 7/10/2012 IM 2 T315? T315M (30.28) T315M (30.28) Progressive disease ALL-29-04 8/1/2012 IM 2 T315? T315M (57.28), T315I (1.09) T315M (57.28), T315I (1.09) Stable disease ALL-29-05 8/22/2012 PON 3 T315?, E255V (;20) T315M (28.61), T315I (22.93), E255V (12.40) T315M (25.20), T315I (20.01), E255V (5.03), T315M1 E255V (3.41), T315I1E255V (2.92)
Progressive disease
ALL-30-01 3/30/2010 NIL 1 E255V (;40) E255V (34.70) E255V (34.70) Complete hematologic response, molecularly detectable disease after 1 mo on IM
ALL-30-02 5/12/2010 IM 2 E255V (;100) E255V (91.90), V304A (3.91), L302R (1.61), G303W (1.61)
See Figure 3 Complete hematologic response, molecularly detectable disease with 1-log increase in BCR-ABL transcript levels ALL-30-03 7/19/2010 IM 4 E255V (;50), Y253H (;50) E255V (46.50), Y253H (39.30), E255K (1.02)
See Figure 3 Hematologic relapse
ALL-30-04 9/7/2010 DAS 5 E255V (;100) E255V (91.60), T315I (2.00), E255K (1.80), K262R (1.00)
See Figure 3 Stable disease
ALL-30-05 10/5/2010 DAS 5 E255V (;50), T315I (;30)
E255V (53.00), T315I (23.00), Q252E (14.30), E255K (2.10)
See Figure 3 Progressive disease
ALL-31-01 4/4/2006 IM 1 F317L (;100) F317L (99.64) F317L (99.64) Hematologic relapse after 5 mo on IM ALL-31-02 6/6/2006 DAS 2 D276G (;50), F317L (;50), T315A (;50) T315A (51.12), F317L (45.81), D276G (44.86) F317L (33.45), T315A1D276G (32.00), T315A (17.87), F317L1D276G (11.11), D276G (1.25), T315A1 F317L (0.75), T315A1 F317L1D276G (0.50)
Hematologic relapse after transient hematologic improvement ALL-31-03 7/14/2006 IM 3 F317L (;100) F317L (99.76), R332R (4.17) F317L (95.59), F317L1R332R (4.17) Stable disease ALL-31-04 8/23/2006 IM 3 T315A (;100), G250E (;100)
T315A (100.00), G250E (90.48) T315A1G250E (90.48), T315A (9.52)
Progressive disease
ALL-31-05 9/26/2006 NIL 4 T315A (;100), G250E (;100)
T315A (99.83), G250E (99.83) T315A1G250E (99.83) Progressive disease ALL-31-06 10/24/2006 NIL 4 T315A (;100),
G250E (;60), D276G (;30), Y253H (;30) T315A (99.96), G250E (67.93), D276G (28.89), Y253H (27.21), Q252E (1.49) T315A1G250E (65.82), T315A1Y253H1D276G (26.02), T315A (3.76), T315A1G250E1D276G (2.11), T315A1Q252E (0.78), T315A1Y253H (0.48), T315A1Y253H1 D276G1Q252E (0.48), T315A1D276G (0.28), T315A1Y253H1Q252E (0.23) Progressive disease
ALL-32-01 1/6/2012 IM 2 Y253H (;100) Y253H (99.79) Y253H (99.79) Hematologic relapse
ALL-32-02 4/12/2012 DAS 3 None None None Complete hematologic and
cytogenetic response,
For SS results, mutation-relative abundance was assessed on the basis of variant peak height. In the TKI column, the TKI being administered at the time of analysis is indicated. In the Line column, the number of different lines of TKI therapy that had been administered to the patient is indicated. Disease status and response at each time point are also detailed. Response definitions as in Baccarani et al14and Vignetti et al.23
resistant mutations (E255K and Y253H) are observed. However,
the tree indicates that these derive from an unmutated haplotype
rather than on the predominant E255V background. The
final
clinically relevant substitution, the pan-resistant T315I, is observed in
cluster B, often in conjunction with E255V (and Q252E whose
possible clinical relevance is unknown). T315I thus appears to have
arisen at the base of this cluster on an E255V background, rather than
from the seq128 haplotype observed in cluster C. This observation
suggests that, as in the cases of E255K and Y253H, new TKI-resistant
mutations can arise from low frequency, possibly slow-proliferating
clones that do not represent the majority of the circulating haplotypes
at earlier time points. Interestingly, sequences 31, 38, and 104 do not
Discussion
UDS has revolutionized the way we can approach the study of
drug-resistant cellular populations. Virology is one of the
fields that has
benefited most from the possibility of highlighting
heretofore-undetectable minor mutated variants and performing haplotype
analysis, thus allowing for characterization and monitoring of
population diversity in HIV and hepatitis viruses.
24There seem to be
striking similarities between viral populations and Ph
1leukemia
populations, in that they both tend to accumulate mutations to
escape antiviral or TKI therapy, respectively. In both scenarios,
Table 3. (continued)
Code Date TKI Line Mutations by SS Mutations by UDS*
Estimated mutated
populations by UDS† Disease status and response molecularly detectable disease
ALL-32-03 8/8/2012 DAS 3 None Y253H (2.49), T315I (1.19) Y253H (1.30), Y253H1T315I (1.19)
Complete hematologic response, 2-log increase in BCR-ABL transcript levels ALL-32-04 9/17/2012 DAS 3 Y253H (;100),
T315I (;60), F317L(ttc.tta) (;20) Y253H (100.00), T315I (79.11), F317L(ttc.tta)(15.70), F317L(ttc.ctc)(4.04) Y253H1T315I ((78.77), Y253H1 F317L(ttc.tta) (15.36), Y253H1 F317L(ttc. ctc)(4.04), Y253H (1.49), Y253H1T315I1F317L(ttc. tta)(0.34)
Loss of cytogenetic response
ALL-33-01 3/27/2005 IM 1 G250E (;100) G250E (99.50) G250E (99.50) Hematologic relapse ALL-33-02 9/5/2005 DAS 2 G250E (;100),
F317L (;70)
N.D. N.D. Hematologic relapse after
a 5-mo complete hematologic response ALL-33-03 12/1/2005 NIL 3 G250E (;100),
F317L (;50), Y253H (;30) G250E (99.99), F317L(ttc.tta) (43.63), Y253H (26.36), V299L (4.84), L248R (1.89), F317L(ttc.ctc)(1.01) G250E (35.54), G250E1F317L (ttc.tta) (31.90), G250E1 Y253H (14.86), G250E1 F317L(ttc.tta)1Y253H (9.84), G250E1V299L (2.72), G250E1L248R (1.13), G250E1Y253H1 V299L (0.99), G250E1 F317L(ttc.tta)1V299L (0.77), G250E1F317L(ttc. tta)1L248R (0.76), G250E1 F317L(ttc.ctc) (0.70), G250E1F317L(ttc.tta)1 V299L1Y253H (0.36), G250E1F317L(ttc.ctc)1 Y253H (0.31) Progressive disease
For SS results, mutation-relative abundance was assessed on the basis of variant peak height. In the TKI column, the TKI being administered at the time of analysis is indicated. In the Line column, the number of different lines of TKI therapy that had been administered to the patient is indicated. Disease status and response at each time point are also detailed. Response definitions as in Baccarani et al14and Vignetti et al.23
In patient ALL-29, “T315?” denotes that 2 overlapping peaks at adjacent positions (c/t at 1091 and t/g at 1092) of codon 315 were identified in the SS chromatogram and the resulting amino acid substitution(s) could not be resolved (see supplemental Figure 9). In patients MBC-11, ALL-23, ALL-32, and ALL-33, the same amino acid changes were found to result from different nucleotide substitutions at the same codons (specified in parentheses). N.A. indicates that clonal analysis could not be possible because of multiple mutations located.450 bp apart. N.D. indicates that amplification with fusion primers was unsuccessful and the sample could not be analyzed with UDS.
ALL, Ph1acute lymphoblastic leukemia; AP, accelerated phase; CP, chronic phase; DAS, dasatinib; FISH, fluorescence in situ hybridization; IM, imatinib; LBC, lymphoid blast crisis; MBC, myeloid blast crisis; N.A., not assessable; N.D., not done; NIL, nilotinib; PON, ponatinib; SCT, stem cell transplantation.
*Cutoff set at variants$1%, see “Materials and methods” for details.
lower abundance cutoff of 1%. In 51% of the cases, minor mutations
could be recognized as poorly sensitive either to the TKI being
administered or to the previous TKI received. They most likely
corresponded either to outgrowing mutations anticipating an
imminent relapse (as for the pan-resistant T315I in samples CP-01-02,
AP-10-01, ALL-26-01, ALL-28-01, ALL-29-04) or, more rarely, to
“withdrawing” mutants not (yet) entirely deselected by the change
in TKI (as in CP-03-06, CP-04-03, CP-06-02, and CP-06-03). In
other cases, they could rather be seen as the result of
“secondary
route(s)
” toward resistance followed by some Ph
1cells as an alternative
to the one(s) leading to the dominant population(s) (as in AP-10-02,
LBC-14-01, ALL-27-03, ALL-32-04, ALL-33-03). In a not negligible
proportion of cases, however, minor mutations were either silent or
never reported in association with TKI resistance. One would expect
such mutations to be always colocalized (“passengers”) on BCR-ABL
molecules already harboring a TKI-resistant mutation (
“driver”; as
in sample CP-03-05); however, this was not always the case,
sug-gesting that, depending on the specific context, a mutant that per se
would not be so markedly insensitive to treatment may somehow, at
least temporarily, survive and expand to a certain extent, although it
will never be able to achieve dominance.
An even higher degree of complexity emerged when we tried to
reconstruct the different haplotypes in the samples harboring multiple
mutations (Table 3). In the early days of the second-generation TKI
era, one study had suggested that compound mutations might be
particularly insidious because they may be associated with enhanced
oncogenic potential and TKI insensitivity than the separate mutants
would exhibit.
11However, the clinical relevance of compound as
against polyclonal mutations in patients failing multiple TKIs has
long been underestimated. This is mainly because SS, the most
widely used method for routine BCR-ABL KD mutation screening,
3precludes the determination of whether multiple mutations are
co-located on the same BCR-ABL molecule: only SS of an appropriate
number of bacterial colonies with cloned-in BCR-ABL KD would
bypass this limitation, but the labor-intensiveness of this approach
25
F317L, Y253H1T315I, Y253H1F317L) are selectively at an
advantage over single mutants, whereas others (H396R
1F317L,
H396R1T315I, T315I1F317L) are not. On the other hand, the
same E255K
1T315I (the most frequent compound mutant
iden-tified in our samples) was found to achieve dominance in some
cases but not in others, suggesting that the patient-speci
fic context,
including number and features of coexisting populations, may shape
the
fitness of a compound mutant and a general rule cannot easily be
inferred.
Our results on the complexity of mutated populations and on
their dynamics under sequential TKI treatment concur to depict a
model in which evolution of BCR-ABL–positive cells is mainly
shaped by TKI-selective pressure (whether microenvironment and/
or the immune surveillance may also be playing a role is currently
unknown) and the
fitness of each mutated population is the net result
of an
“absolute” fitness (the ability to survive treatment depending
on the intrinsic sensitivity to the specific TKI administered) and of
a
“relative” fitness (the ability to survive the competition with all
other coexisting populations). For the majority of arising mutants,
the
fitness will luckily not be high enough to sustain clonal
ex-pansion (at least not over a certain threshold), and the population
will rather face extinction. Other mutants will expand, although the
switch to another TKI may later turn a
“fit” into an “unfit”
popu-lation and lead to an evolutionary
“dead-end”. Rare cells within
existing mutated populations will gain additional mutations (giving
rise to compound mutants), and this will be either an advantage or
a disadvantage depending on the type of mutation. Recent
whole-genome sequencing studies have challenged the longstanding model
of linear evolution of tumors through stepwise accumulation of
genetic hits in a founding clone.
27In multiple myeloma, for
ex-ample, tumor progression has been shown to proceed in a branching
rather than in a linear manner, leading to substantial clonal diversity
and coexistence of wide genetic heterogeneity.
28,29On a smaller
scale, the same seems to apply to drug-resistant BCR-ABL mutants.
Two clinical caveats derive from our
findings. We here show that
information provided by SS may not always be suf
ficient to predict
responsiveness to a TKI. SS is the currently recommended method
for BCR-ABL KD mutation analysis, and its results do influence TKI
selection
3,30-33: for example, if an imatinib-resistant patient was
found to harbor a Y253H by SS, switching to dasatinib rather than to
nilotinib should be considered, in light of the fact that this mutant
has been shown both in vitro and in vivo to be fully sensitive to
dasatinib but poorly sensitive to nilotinib.
6,7If the scenario turned
out to be more complex with additional minor mutated populations,
clinical ef
ficacy of the selected TKI might be compromised, or only
transient.
34,35Such a case should sound as a warning to the
physician and a closer monitoring could be bene
ficial. We
ac-knowledge that in very few instances the information added by UDS
would alter TKI selection: in case one of these minor mutated
populations were a T315I-positive one, for example, ponatinib might
become preferable over dasatinib.
4,36However, if multiple low-level
mutations were detected, it would become dif
ficult to predict their role
Figure 1. Relative frequency of single as opposed to compound mutants. Compound mutants harboring 2 paired mutations were almost as frequent (38.3%) as single mutants (49.6%) and were by far more frequent than triple and quadruple (they accounted for 105 of the 138 [76%] compound mutants overall identified). Mutated Ph1populations harboring 3 or 4 mutations in the same BCR-ABL molecule were occasionally detected, but in 1 case only they were found to have achieved clonal dominance over those with 1 or 2 mutations.
application of UDS in a large series of patients might ultimately
clarify this issue.
Another
“warning” from our observations is that sensitivity of
Many foresee that UDS will soon
find routine diagnostic
appli-cation, especially in the
field of hematologic malignancies where the
pivotal IRON study has recently provided
first evidence of technical
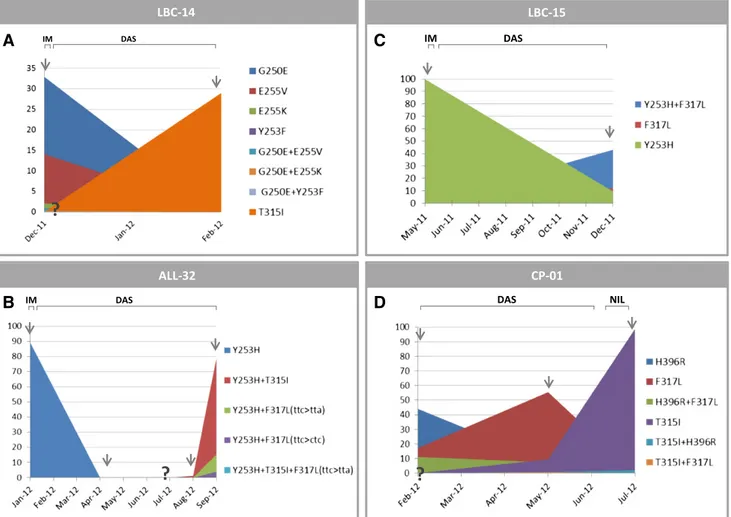
Figure 2. Mutated populations rise and fall in dominance over time in relation to therapeutic intervention. Graphical illustration of the kinetics of mutated population abundances in 4 representative cases. Arrows indicate the time points at which UDS was performed. Patient IDs are as in Table 3. (A) At the time of first relapse, 7 distinct imatinib-resistant mutated populations were detected. Dasatinib treatment cleared these mutants as quickly as in 2 months, but just as quickly a pan-resistant T315I mutant was found to have emerged. The patient achieved a transient hematologic response after 1 month but lost it shortly after detection of T315I. The question mark indicates that no T315I had been detected by UDS at the time of switchover (at a coverage of 4527 reads, suggesting that either it was present in,1/5000 transcripts, or that it was acquired some time later). (B) At the time of first relapse, a single imatinib-resistant Y253H mutant that accounted for almost 90% of BCR-ABL–positive cells was detected by SS and UDS. After 3 months of dasatinib therapy, the patient had achieved a complete cytogenetic response (no Ph1metaphases detectable in the bone marrow by standard chromosome banding analysis) although residual disease remained detectable at the molecular level (as assessed by real-time quantitative [RT-Q]-PCR for BCR-ABL transcript). Neither the Y253H (known to be substantially sensitive to dasatinib) nor other mutants were detectable any longer by UDS. After 9 months on dasatinib, the patient was found to have lost the cytogenetic response. UDS showed the coexistence of 3 distinct compound mutants where Y253H was coupled with 3 well-known dasatinib-resistant mutations (a T315I and an F317L resulting from 2 different nucleotide substitutions). It might be hypothesized that the original Y253H-positive cells were never completely eliminated by dasatinib and persisted at very low levels (undetectable by UDS) until they happened to gain a selective advantage again, although de novo acquisition of mutations by previously unmutated cells cannot be ruled out. Interestingly, Y253H and T315I were already detectable by UDS 1 month before. (C) At the time of second relapse, after 6 months of dasatinib therapy, a dasatinib-resistant F317L mutation was detected. UDS portrayed a complex scenario with 3 distinct populations where the former imatinib-resistant Y253H and the newly acquired dasatinib-resistant F317L were present alone and in combination, although the Y253H1F317L compound mutant quantitatively dominated over the F317L- and Y253H-positive ones. It might be hypothesized that the same mutation was acquired in parallel by independent populations (ie, one unmutated and one already positive for the Y253H). (D) After 6 months of second-line dasatinib treatment, during which the patient achieved a complete cytogenetic response but no molecular response, the former imatinib-resistant H396R mutant plus 2 additional populations, 1 harboring a dasatinib-resistant F317L and 1 harboring H396R1F317L, were detected. Three months later, the F317L had become the dominant one, while H396R1F317L and H396R had declined. During dasatinib therapy, a pan-resistant T315I was also acquired because at the time of switchover to nilotinib, a T315I together with H396R1T315I and F317L1T315I compound mutants were already detectable by UDS (4.44%, 0.76%, and 0.22%, respectively). As quickly as in 2 months, nilotinib treatment selected the T315I mutant that expanded, achieving almost full dominance. IM, imatinib; DAS, dasatinib; NIL, nilotinib.
Acknowledgments
Authorship
Figure 3. Neighbor joining bootstrap consensus tree (K2P distances) for nucleotide sequences recovered at 5 time points for patient ALL-30 (samples ALL-30-01 through ALL-30-05 in Table 3). The patient was initially enrolled in a clinical study testing the use of nilotinib and imatinib administered in rotation in 6-week cycles. Sample ALL-30-01 (time point 1) was collected after the first (nilotinib) cycle. Sample ALL-30-02 (time point 2) was collected after the second (imatinib) cycle. Sample ALL-30-03 (time point 3) was collected after the fourth cycle. Sample ALL-30-04 was collected after the patient had discontinued the nilotinib-imatinib rotation schedule for hematologic relapse and had received 2 weeks of dasatinib treatment. Sample ALL-30-05 was collected after 6 weeks of dasatinib treatment and a few days before the exitus. Branches with ,25% support are collapsed to polytomies. Amino acid substitutions are mapped onto the tree and shown for each sequence along with the percentage of reads that each sequence represented at each time point. “Germline” indicates the unmutated sequence. The scale bar shows substitutions per site. The colors identify the 3 sequence clusters that can be recognized (A-C; see “Further insights into BCR-ABL KD sequence evolution: a phylogenetic approach” for details).
support for the development of the UDS assay; M.C., M.B., and
G.M. coordinated the clinical and research team activities and
supervised the study; and all authors gave
final approval for
submission.
Conflict-of-interest disclosure: S.S. was a consultant for and
received honoraria from Novartis, Bristol-Myers Squibb, and Ariad.
F. Castagnetti, G.G., and G.R. were consultants for and received
honoraria from Novartis and Bristol-Myers Squibb. A.K. received
honoraria from Roche Diagnostics. T.H. and K.M.P. received
research funding from Roche Diagnostics. M.B. and G.M. were
consultants for and received honoraria from Novartis, Bristol-Myers
Squibb, Ariad, and P
fizer. M.I. is a Roche employee. The remaining
authors declare no competing
financial interests.
Correspondence: Simona Soverini, Institute of Hematology
“L. e A. Ser`agnoli”, Via Massarenti 9, 40138 Bologna, Italy; e-mail:
[email protected].
References
1. Cohen MH, Williams G, Johnson JR, et al. Approval summary for imatinib mesylate capsules in the treatment of chronic myelogenous leukemia. Clin Cancer Res. 2002;8(5):935-942. 2. Gorre ME, Mohammed M, Ellwood K, et al.
Clinical resistance to STI-571 cancer therapy caused by BCR-ABL gene mutation or amplification. Science. 2001;293(5531):876-880. 3. Soverini S, Hochhaus A, Nicolini FE, et al. BCR-ABL kinase domain mutation analysis in chronic myeloid leukemia patients treated with tyrosine kinase inhibitors: recommendations from an expert panel on behalf of European LeukemiaNet. Blood. 2011;118(5):1208-1215.
4. Cortes JE, Kantarjian H, Shah NP, et al. Ponatinib in refractory Philadelphia chromosome-positive leukemias. N Engl J Med. 2012;367(22): 2075-2088.
5. Cortes J, Lipton JH, Rea D, et al; Omacetaxine 202 Study Group. Phase 2 study of subcutaneous omacetaxine mepesuccinate after TKI failure in patients with chronic-phase CML with T315I mutation. Blood. 2012;120(13): 2573-2580.
6. Hughes T, Saglio G, Branford S, et al. Impact of baseline BCR-ABL mutations on response to nilotinib in patients with chronic myeloid leukemia in chronic phase. J Clin Oncol. 2009;27(25): 4204-4210.
7. Soverini S, Gnani A, Colarossi S, et al. Philadelphia-positive patients who already harbor imatinib-resistant Bcr-Abl kinase domain mutations have a higher likelihood of developing additional mutations associated with resistance to second- or third-line tyrosine kinase inhibitors. Blood. 2009;114(10):2168-2171.
8. Soverini S, Colarossi S, Gnani A, et al. Resistance to dasatinib in Philadelphia-positive leukemia patients and the presence or the selection of mutations at residues 315 and 317 in the BCR-ABL kinase domain. Haematologica. 2007;92(3): 401-404.
9. M ¨uller MC, Cortes JE, Kim DW, et al. Dasatinib treatment of chronic-phase chronic myeloid leukemia: analysis of responses according to preexisting BCR-ABL mutations. Blood. 2009; 114(24):4944-4953.
10. Puttini M, Coluccia AM, Boschelli F, et al. In vitro and in vivo activity of SKI-606, a novel Src-Abl inhibitor, against imatinib-resistant Bcr-Abl1 neoplastic cells. Cancer Res. 2006;66(23): 11314-11322.
11. Shah NP, Skaggs BJ, Branford S, et al. Sequential ABL kinase inhibitor therapy selects for compound drug-resistant BCR-ABL mutations
management recommendations of European LeukemiaNet. J Clin Oncol. 2009;27(35): 6041-6051.
15. Soverini S, Martinelli G, Amabile M, et al; Italian Cooerative Study Group on Chronic Myeloid Leukemia; European LeukemiaNet-6th Framework Program of the European Community. Denaturing-HPLC-based assay for detection of ABL mutations in chronic myeloid leukemia patients resistant to Imatinib. Clin Chem. 2004; 50(7):1205-1213.
16. Kohlmann A, Klein HU, Weissmann S, et al. The Interlaboratory RObustness of Next-generation sequencing (IRON) study: a deep sequencing investigation of TET2, CBL and KRAS mutations by an international consortium involving 10 laboratories. Leukemia. 2011;25(12):1840-1848. 17. Grossmann V, Roller A, Klein HU, et al.
Robustness of amplicon deep sequencing underlines its utility in clinical applications. J Mol Diagn. 2013;15(4):473-484.
18. Gianella S, Delport W, Pacold ME, et al. Detection of minority resistance during early HIV-1 infection: natural variation and spurious detection rather than transmission and evolution of multiple viral variants. J Virol. 2011;85(16):8359-8367. 19. Vandenbroucke I, Van Marck H, Verhasselt P,
et al. Minor variant detection in amplicons using 454 massive parallel pyrosequencing: experiences and considerations for successful applications. Biotechniques. 2011;51(3):167-177. 20. Ko SY, Oh HB, Park CW, Lee HC, Lee JE.
Analysis of hepatitis B virus drug-resistant mutant haplotypes by ultra-deep pyrosequencing. Clin Microbiol Infect. 2012;18(10):E404-E411. 21. Kimura M. A simple method for estimating
evolutionary rates of base substitutions through comparative studies of nucleotide sequences. J Mol Evol. 1980;16(2):111-120.
22. Gouy M, Guindon S, Gascuel O. SeaView version 4: A multiplatform graphical user interface for sequence alignment and phylogenetic tree building. Mol Biol Evol. 2010;27(2):221-224. 23. Vignetti M, Fazi P, Cimino G, et al. Imatinib plus
steroids induces complete remissions and prolonged survival in elderly Philadelphia chromosome-positive patients with acute lymphoblastic leukemia without additional chemotherapy: results of the Gruppo Italiano Malattie Ematologiche dell’Adulto (GIMEMA) LAL0201-B protocol. Blood. 2007;109(9): 3676-3678.
24. Radford AD, Chapman D, Dixon L, Chantrey J, Darby AC, Hall N. Application of next-generation sequencing technologies in virology. J Gen Virol.
27. Nowell PC. The clonal evolution of tumor cell populations. Science. 1976;194(4260):23-28. 28. Keats JJ, Chesi M, Egan JB, et al. Clonal
competition with alternating dominance in multiple myeloma. Blood. 2012;120(5):1067-1076. 29. Egan JB, Shi CX, Tembe W, et al. Whole-genome
sequencing of multiple myeloma from diagnosis to plasma cell leukemia reveals genomic initiating events, evolution, and clonal tides. Blood. 2012; 120(5):1060-1066.
30. Jabbour E, Soverini S. Understanding the role of mutations in therapeutic decision making for chronic myeloid leukemia. Semin Hematol. 2009; 46(2 suppl 3):S22-S26.
31. Jabbour E, Hochhaus A, Cortes J, La Ros ´ee P, Kantarjian HM. Choosing the best treatment strategy for chronic myeloid leukemia patients resistant to imatinib: weighing the efficacy and safety of individual drugs with BCR-ABL mutations and patient history. Leukemia. 2010; 24(1):6-12.
32. Branford S, Hughes TP. Mutational analysis in chronic myeloid leukemia: when and what to do? Curr Opin Hematol. 2011;18(2):111-116. 33. Jabbour E, Branford S, Saglio G, Jones D,
Cortes JE, Kantarjian HM. Practical advice for determining the role of BCR-ABL mutations in guiding tyrosine kinase inhibitor therapy in patients with chronic myeloid leukemia. Cancer. 2011;117(9):1800-1811.
34. Parker WT, Lawrence RM, Ho M, et al. Sensitive detection of BCR-ABL1 mutations in patients with chronic myeloid leukemia after imatinib resistance is predictive of outcome during subsequent therapy. J Clin Oncol. 2011; 29(32):4250-4259.
35. Parker WT, Ho M, Scott HS, Hughes TP, Branford S. Poor response to second-line kinase inhibitors in chronic myeloid leukemia patients with multiple low-level mutations, irrespective of their resistance profile. Blood. 2012;119(10): 2234-2238.
36. O’Hare T, Shakespeare WC, Zhu X, et al. AP24534, a pan-BCR-ABL inhibitor for chronic myeloid leukemia, potently inhibits the T315I mutant and overcomes mutation-based resistance. Cancer Cell. 2009;16(5): 401-412.
37. Ernst T, Erben P, M ¨uller MC, et al. Dynamics of BCR-ABL mutated clones prior to
hematologic or cytogenetic resistance to imatinib. Haematologica. 2008;93(2):186-192.
38. Schumacher JA, Szankasi P, Bahler DW, Ho AK, Kelley TW. A pyrosequencing-based test for
41. Willis SG, Lange T, Demehri S, et al. High-sensitivity detection of BCR-ABL kinase domain mutations in imatinib-naive patients: correlation with clonal cytogenetic evolution but not response to therapy. Blood. 2005;106(6):2128-2137. 42. Sherbenou DW, Wong MJ, Humayun A, et al.
Mutations of the BCR-ABL-kinase domain occur
43. Redaelli S, Piazza R, Rostagno R, et al. Activity of bosutinib, dasatinib, and nilotinib against 18 imatinib-resistant BCR/ABL mutants. J Clin Oncol. 2009;27(3):469-471.
44. O’Hare T, Eide CA, Deininger MW. Bcr-Abl kinase domain mutations, drug resistance, and the road
45. Kohlmann A, Martinelli G, Hofmann WK, et al. The Interlaboratory Robustness of
Next-Generation Sequencing (IRON) Study Phase II: deep-sequencing analyses of hematological malignancies performed by an international network involving 26 laboratories [abstract]. Blood. 2012;120(21):Abstract 1399.