ANNO ACCADEMICO 2016 - 2017
DIPARTIMENTO DI SCIENZE DI BASE
CORSO DI DOTTORATO DI RICERCA IN SCIENZE DI BASE E APPLICAZIONI Curriculum Scienze della Terra
XXX CICLO
Oceanic Anoxic Event (OAE) 1b (late Aptian
– early Albian): evolutionary,
palaeoecological, palaeoceanographic and
palaeoclimatic implications
SSD Geo/01
TUTOR
DOTTORANDO
Chiar.mo Prof. Rodolfo Coccioni
Dott. Serena Ferraro
CO-TUTOR
Dott. Mario Sprovieri
________________________________________________________________________
i
Abstract
The late Aptian – early Albian interval (110 – 118 Ma) represents a crucial period of pronounced biotic and climate/ocean changes. It was characterized by enhanced volcanic activity linked to the progressive opening of the Indian Ocean, increased levels of atmospheric greenhouse gases, and high climate instability. The widespread deposition of multiple prominent black shale horizons in the Northern Tethyan and North Atlantic realms is the sedimentary expression of Oceanic Anoxic Event (OAE) 1b, a major perturbation of global carbon cycle. The late Aptian – early Albian OAE 1b is also the scenario of the first major turnover in the planktonic foraminifera evolutionary history, with an event of dramatic extinction of large-sized, heavy ornamented planktonic species, and subsequent diversification of small and thin-walled taxa. Investigation of the complex nature and dynamics of oceanographic changes in response to the OAE 1b are the goals of this thesis, along with a deep analysis of the ecological stressors affecting the evolutionary behaviour of the planktonic foraminiferal community. A high-resolution study of multiple paleontological, organic and inorganic geochemical proxies (microfaunal assemblage composition, morphometry of Pa. rohri, δ13Ccarb,
TOC, CaCO3, trace elements, organic biomarkers) has been performed on the
nearly continuous and undisturbed pelagic sedimentary succession of Poggio le Guaine (Umbria-Marche Basin, central Italy). The results clearly suggest the emplacement of the Southern Kerguelen Plateau as the external driver triggering global climatic/oceanographic changes. The consequent complex feedback mechanisms among ocean, land and atmosphere, strictly controlled by the regional features, led to intermittent episodes of water column anoxia/dysoxia, inducing enhanced burial and preservation of marine organic carbon. The high environmental variability destabilized the marine ecosystems, triggering ecological stress and forcing biotic crises. The planktonic foraminifera turnover has been therefore the result of an irreversible and drastic regime shift toward more mesotrophic – eutrophic ecosystem that promoted the blooming of opportunistic/disaster species and siliceous organism as Radiolaria, which dominated the microfaunal assemblages. The comparison of the planktonic foraminifera records from the Poggio le Guaine succession and the DSDP Site 511 section chosen as “control
Abstract
________________________________________________________________________
ii
ocean section”, provided the evidence that widely separated marine ecosystems had similar response to global drivers, both experiencing relevant ecological system shift. The dwarfism of planktonic foraminifera prior the extinction turned out to be an ecological response to increasing environmental stresses rather an evolutive behaviour preceding the extinction.
Acknowledgments
Firstly, I would like to thank my supervisors, Prof. Rodolfo Coccioni of the University of Study of Urbino – Carlo Bo, and Dr Mario Sprovieri of the IAMC-CNR UOS of Capo Granitola, for their advice, support and encouragement throughout my PhD. In particular, thanks to Prof. Coccioni for sharing some of his vast knowledge of micropaleontology and for introducing me into the Cretaceous Planktonic Foraminifera world. Without his encouragement and help with forams identification much of this work could not have been accomplished. I would especially like to thank Mario for supporting my metamorphosis from mere micropaleontologist to fully-fledged palaeoceanographer. His unfailing enthusiasm for research and learning has been extremely inspiring. To the both of you thank you for helping me make what has sometimes seemed like an eclectic and abstract mix of subjects and techniques into a somewhat more orderly body of work.
I am particularly indebted to Dr. Nadia Sabatino for freely giving her time and advice in relation to this research. During my PhD Nadia was extremely patient with me, offering her help, her constant enthusiasm, guidance, support, also listening and pushing me to do things better. My sincere thank also goes to Dr. Angela Cuttitta of the IAMC-CNR UOS of Capo Granitola, who gave access to the microscopy laboratory, crucial to conduct my research.
Big thanks also go to Prof. R. Pancost and Dr. David Naafs of the OGU in the School of Chemistry, University of Bristol, for giving me the great opportunity to use of their laboratory facilities for three months. In particular, thank you to David, for showing me the ropes of Organic Geochemistry at the beginning and for being so patient with me. I would also like to thank all members of the OGU for making it such a fun and interesting place to work and for always being so willing to help. Above all, thanks to Georgia, Alexandra, Leila, Emmanuelle, Gordon, John and Cathrine for keeping me cheerful and making the lab such a pleasure to work in.
Sampling and the field observations were conducted on Poggio le Guaine (Umbria-Marche, Italy) and I am very grateful to Dr. F. Frontalini, Dr. Marianna Sideri and Dr. Carla Bucci for allowing this. They are thanked for their assistance and availability.
I am grateful to the Integrated Ocean Drilling Program for all the samples they provided for this work and to IAMC- CNR of Capo Granitola for funding this project, giving me the opportunity to carry out this multidisciplinary research. The team at IAMC-CNR of Capo Granitola have absolutely been the best collaborators I could have asked for. Always interested and willing to support my ideas and provide assistance whenever requested. I am so grateful.
A very special thank you goes to my fellow adventurers: Dr. Gemma Biondo and my “Asso” Dr. Linda Monastero. They represent the best gift my PhD gave me, wholeheartedly supporting and encouraging me every time I plunged into distress.
Acknowledgments
________________________________________________________________________
vi
They have made the PhD experience all the more enjoyable! I am also very grateful to my colleague and friend Luigi Giaramita for our lifelong friendship and for allaying all my anxieties.
Finally, my family is thanked for his continual support over the years, for having more faith in me than I do myself. Thank you to my life-partner Pietro for putting up with me for the last year or so, for keeping me smiling and for dragging me through the last 3 months of writing.
Specially to my wonderful mother, for always pushing me to be the best I can be, and for being behind me every single step of the way, no matter what I have chosen to do. This is for you.
________________________________________________________________________ vii
Table of contents
Abstract……… i Dedication……… iii Acknowledgements………. vTable of contents….………... vii
List of Figures….………. ix
List of Abbreviations……….. xiii
Chapter 1 Introduction……….. 1
1.1 The late early-Cretaceous…….………... 1
1.2 The Oceanic Anoxic Events (OAEs)……….. 2
1.3 The OAE 1b …..………... 4
1.4 The late Aptian – early Albian planktonic foraminifera turnover .. 6
1.5 Aims and structure of this thesis.……….. 8
Chapter 2 Geological setting, litho- and biostratigraphy……… 11
2.1 Poggio le Guaine and Gorgo a Cerbara sections………. 11
2.1.1 Lithostratigraphy of Poggio le Guaine section………... 14
2.1.2 Lithostratigraphy of Gorgo a Cerbara section……… 17
2.1.3 Biostratigraphy of the PLG-GC composite section………… 17
2.2 DSDP Site 511………... 19
2.2.1 Lithostratigraphy of DSDP Site 511….………. 20
2.2.2 Biostratigraphy of DSDP Site 511………. 21
Chapter 3 Materials and Methods….……… 23
3.1 Data sets and sampling strategy……….. 23
3.1.1 Poggio le Guaine and Gorgo a Cerbara sections….……….... 23
3.1.2 The morphometrical investigation on Pa. rohri: aims and sampling strategy………... 26
3.1.3 DSDP Site 511………. 27
3.2 Methods……….... 29
3.2.1 Micropaleontologycal Analysis….………. 29
3.2.2 Inorganic geochemistry……….. 30
3.2.2.1 Stable Carbon and Oxygen isotopes analysis...……… 30
3.2.2.2 Elemental geochemistry..………. 31
3.2.3 Organic Geochemistry……… 32
3.2.3.1 Total Organic Carbon (TOC) analysis ………. 32
3.2.3.2 Organic biomarkers analyses…...………. 33
Chapter 4 Results from PLG and GC sections……… 37
4.1 Planktonic foraminiferal bioevents and remarks on microfaunal assemblages……… 37
4.2 Test size variations in Pa. rohri…….……….. 38
4.3 Carbon Isotope Stratigraphy……… 40
4.4 CaCO3 content………. 40
4.5 Total Organic Carbon content of PLG section……… 41
4.6 Major and trace elements………. 42
viii
4.8 Biomarkers identified and their distribution in Poggio le Guaine
section ……….. 49
4.9 Biological Source of Organic Matter………...……… 50
4.9.1 N-alkanes parameters……….. 50
4.9.2 Isoprenoids………. 53
4.9.2.1 Acyclic isoprenoids….……… 53
4.9.2.2 Cyclic aryl isoprenoids.………... 59
4.9.3 Steranes……….. 60
4.9.4 Hopanes…..………... 62
4.10 Thermal Maturity Parameters and Their Use ……….………….. 63
4.10.1 Pr/n-C17 and Ph/n-C18 ……….. 64
4.10.2 Steranes 20S/(20S+20R) isomerization ratio ……….. 64
4.10.3 Hopanes parameters……….. 65
Chapter 5 Results from DSDP Site 511….………... 69
5.1 Identification of bioevents and comments on the assemblages….. 69
5.2 Test size variations in Pa. rohri..……… 71
5.3 Carbon isotope data……….. 72
5.4 Total Organic Carbon Content…..……….. 72
Chapter 6 Discussions……… 75
6.1 The emplacement of the Southern Kerguelen Plateau as trigger for the OAE1b ………. 75
6.1.1 The Southern Kerguelen Plateau……… 75
6.1.2 Mercury chemostratigraphy as a powerful tool for recognising worldwide LIP impact………. 76
6.2 The palaeoceanographic evolution of the OAE 1b...……….. 78
6.3 The late Aptian – early Albian record of PLG ….……….. 80
6.3.1 Major contributors to the organic matter during the OAE1b 80 6.3.2 Photic Zone Euxinia in Western Tethys Ocean during the late Aptian – early Albian OAE1b ….……… 82
6.3.3 The methanogenic Archaea biomass in the Western Tethys Ocean during the OAE 1b……….. 83
6.4 The PLG record of the late Aptian – early Albian regime shift …. 84 6.4.1 Evolution of the Jacob sub-event..……… 88
6.4.2 The “mute zone”…...………. 93
6.4.3 An interval of ecological regime shift ………..……… 93
6.4.4 The Kilian sub-event…..………... 95
6.4.5 The new regime……….. 95
6.5 The impact of the environmental changes on planktonic community: a view on an ecological regime shift..………... 99
6.5.1 The planktonic foraminiferal response to the OAE1b at PLG section …... 100
6.5.2 The size-record of Pa. rohri at the South Atlantic Ocean... 104
Chapter 7 Conclusions……… 107
________________________________________________________________________
ix
List of figures
Number Title Page
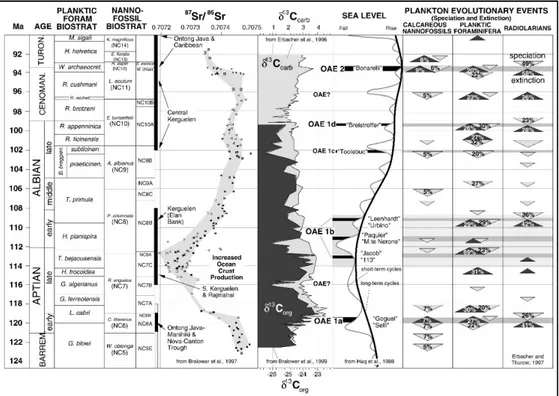
Fig. 1.1 The late early-Cretaceous record of major black shales and oceanic anoxic events (OAEs) in the context of the carbon isotopic record (Erbacher et al., 1996; Bralower et al., 1999), changing global sea level (Haq et al., 1988), seawater chemistry (Bralower et al., 1997]), and plankton evolutionary events. (From Leckie et al., 2002).
3
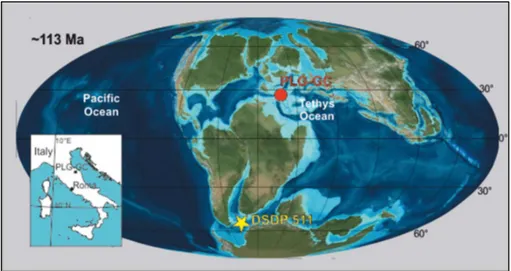
Fig. 2.1 Palaeogeographic map at ~113 Ma modified after Huber and Leckie (2011) showing the location of the Poggio le Guaine (PLG) and Gorgo a Cerbara section (red dots), and of DSDP Site 511 (yellow star).
11
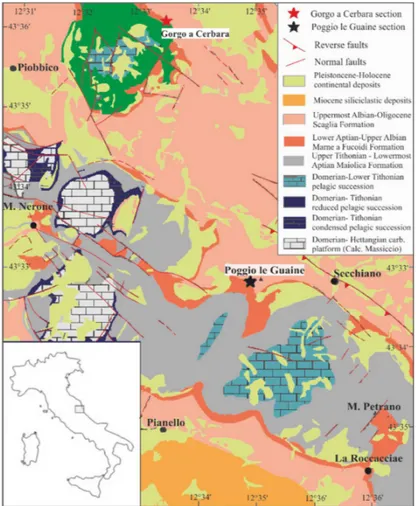
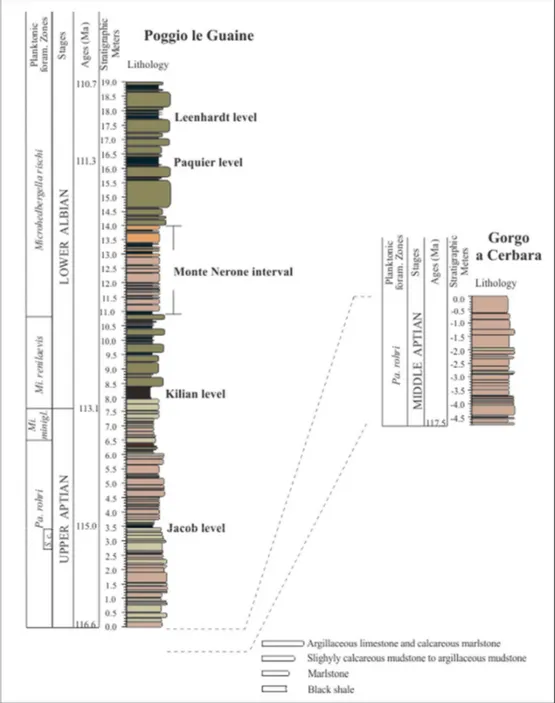
Fig. 2.2 Schematic geological map (modified from Satolli et al., 2008) of the study area and location of the studied section. 12 Fig. 2.3 Stratigraphy of the studied interval at Poggio le Guaine and Gorgo
a Cerbara sections. Biostratigraphic and age data are from Coccioni et al. (2004) and Coccioni personal communications.
13
Fig. 2.4 The Poggio le Guaine outcrop (from Coccioni et al., 2014). 15 Fig. 2.5 a: Detail of the Kilian black shale level showing the characteristic
very fine laminations. b: small smudges and inclusions of black mud in strata below and above the Kilian black shale level.
16
Fig. 2.6 Alternation of marls, calcareous marls and argillaceous limestones of the Paraticinella rohri Zone at Gorgo a Cerbara section.
17
Fig. 2.7 Actual ubication of the DSDP Site 511 (red dot) and main physiographic features of the area.
19
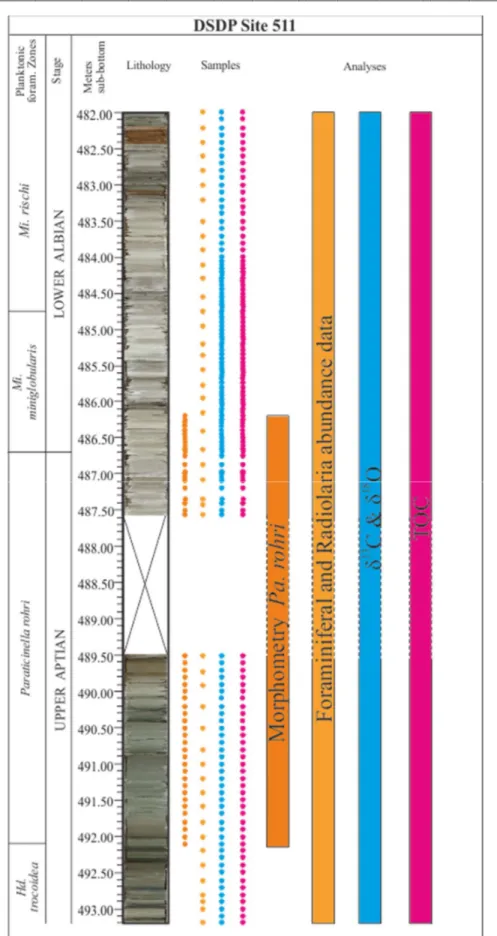
Fig. 2.8 Biostratigraphic scheme and photographs of the upper Aptian – early Albian cored interval from DSDP Site 511.
21
Fig. 3.1 Graphical scheme of data sets collected during the three-years doctoral research and samples positioning along the composite-log Gorgo Cerbara – Poggio le Guaine
25
Fig.3.2 Graphical scheme of data sets collected and sampling strategies adopted for the Core DSDP Site 511.
28
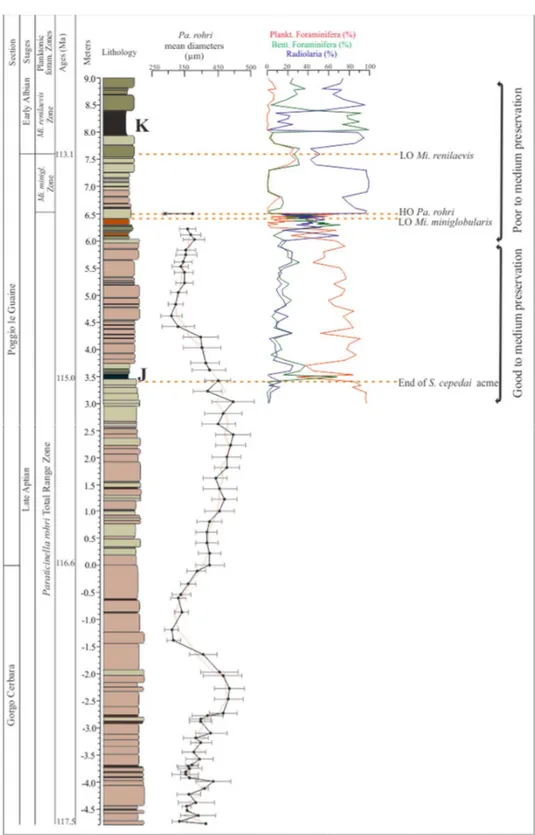
Fig. 4.1 Mean diameters of Pa. rohri along the composite section of PLG-GC and relative foraminiferal and radiolarian abundance through the target interval.
39
Fig. 4.2 CaCO3 (%), TOC (%), and δ13C depth profiles from the “target
interval” of Poggio le Guaine Section.
List of figures
________________________________________________________________________
x
Number Title Page
Fig. 4.3 Depth profile of Mn, V, Ni, Fe, Cd and Cr /Al ratios from Poggio le Guaine section.
43
Fig. 4.4 Depth profile of Co, Cu, Zn, Pb /Al ratios and of V/Cr and
V/(V+Ni) ratios from Poggio le Guaine section. 44
Fig. 4.5 Depth profile of Ti, Mg, K, Zr /Al ratios from Poggio le Guaine section.
45
Fig. 4.6 Depth profile of Ba and P /Al from Poggio le Guaine section. 47 Fig. 4.7 Hg concentrations, total organic carbon (TOC) and Hg/TOC,
Hg/Fe, Hg/Al depth profiles along PLG section.
48
Fig. 4.8 Partial GC-MS gas-chromatogram (m/z 71.1) of apolar fraction from sediment extract of black shales samples of PLG section.
51
Fig. 4.9 Plots of TAR and CPI n-alkanes ratios along the stratigraphic succession of PLG.
52
Fig. 4.10 Plots of pristane and phytane concentrations, Pr/Ph, Pr/n-C17 and
Pr/n-C18 along the PLG section.
55
Fig. 4.11 Scatter log plots of Pr/n-C17 versus Ph/n-C18. 56
Fig. 4.12 Plots of PMI, TMI and C16- and C18-aryl isoprenoids along the
studied section of PLG.
57
Fig. 4.13 Partial GC-MS gas-chromatogram (m/z 71.1) of apolar fraction from sample 4.70 m of the PLG section.
59
Fig. 4.14 Peaks of C16- and C18-aryl isoprenoids in the partial GC/MS
gas-chromatogram (m/z 133.1) of apolar fraction from sediment extract of black shales samples of PLG section.
60
Fig. 4.15 GC/MS gas-chromatograms (m/z 217.1) showing the peaks relative to C27, C28 and C29 5αααS-R isomers.
61
Fig. 4.16 Ternary diagram showing the relative abundances of C27, C28, C29
regular steranes in the apolar fractions of Poggio le Guaine section determined by gas chromatography / mass spectrometry (M+ 217).
62
Fig. 4.17 Mass chromatogram (m/z 191.1) showing the full range hopane series C29 to C32 detected in the apolar fraction of sediments
extracts of PLG section.
63
Fig. 5.1 Depth profiles of TOC content, δ13C, mean diameters of Pa. rohri
and relative abundances of planktonic, benthic foraminifera and Radiolaria at DSDP Site 511.
List of figures ________________________________________________________________________
xi
Number Title Page
Fig. 6.1 Pie charts showing the mean biomarker composition of apolar fractions from the Poggio le Guaine section.
81
Fig. 6.2 The multiproxy-oriented division of the sedimentary target interval in 5 major phases on the basis of the inorganic and organic geochemical proxies.
86
Fig. 6.3 Major inorganic and inorganic geochemical, and micropalaeontological features of the sedimentary interval encompassing the Jacob sub-event at Poggio le Guaine (3.00 – 4.10 m).
90
Fig. 6.4 Major inorganic and inorganic geochemical, and micropalaeontological features of the “mute zone” sedimentary interval at Poggio le Guaine.
91
Fig. 6.5 Major inorganic and inorganic geochemical, and micropalaeontological features of the sedimentary interval encompassing the planktonic foraminiferal turnover at Poggio le Guaine.
92
Fig. 6.6 Major inorganic and inorganic geochemical, and micropalaeontological features of the sedimentary interval encompassing the Kilian sub-event at Poggio le Guaine.
97
Fig. 6.7 Major inorganic and inorganic geochemical, and micropalaeontological features of the upper sedimentary interval at PLG section.
98
Fig. 6.8 Stratigraphy of the studied interval at PLG plotted against morphometric changes of Pa. rohri through the 0.00 m – 6.50 m interval of PLG section, and relative abundance of planktonic foraminifera and Radiolaria from 3.00 m to 9.00 m.
103
Fig. 6.9 Stratigraphy of the studied interval at DSDP Site 511 plotted against morphometric changes of Pa. rohri.
________________________________________________________________________ xiii
List of Abbreviations
µA Microampere µg Microgram µl Microliter µm Micrometre40Ar/30Ar Ratio of Argon-40 to Argon-30
Å Ångströms
AABI Aptian Albian Boundary Interval
AS Average Shale
BaSO4 Barite
BF Benthic Foraminifera
CaCO3 Calcium carbonate
CH4 Methane
CIE Carbon Isotopic Excursion
CKP Central Kerguelen Plateau
cm Centimetres
CNR Council of National Research
CO2 Carbon dioxide
CPI Carbon Preference Index
δ13C Ratio of carbon-13 to carbon-12 relative to VPDB
DCM Dichloromethane
DSDP Deep Sea Drilling Program
E East
eV Elettronvolt
g Gram
GC Gorgo a Cerbara
GC-MS Gas chromatography – mass spectrometry
h Hour H2O Water H2O2 Hydrogen peroxide H2S Hydrogen sulfide H3BO3 Boric acid HCl Hydrochloridric acid Hd. Hedbergella HF Hydrofluoric acid HgS Mercuric sulphide
HNO3 Nitric acid
HO Highest Occurrence
IAMC Institute for marine and coastal environment
ICP-OES Inductively coupled plasma optical emission spectrometer
km Kilometres
kyr Thousand years
Lat. Latitude
LIP Large Igneous Plateau
LO Lowest Occurrence
Long. Longitude
m Meter
List of Abbreviations ________________________________________________________________________ xiv m/z Mass-to-charge ratio M+ Molecular ion Ma Mega annum
MAC Most Abundant Compound
mbsf Meters Below Sea Floor
mbsl Meters Below Sea Level
MeHg Methylmercury MeOH Methanol Mi. Microhedbergella min Minute minigl. miniglobularis ml Millilitre mm Millimetre MS Mass Spectrometry
Myr Million years
N North
N2 Nitrogen gas
n-Cx Normal alkane with x atoms of carbon
ng Nanogram
NKP Northern Kerguelen Plateau
OAE Oceanic Anoxic Event
ODP Ocean Drilling Program
OGU Organic Geochemistry Unit
OM Organic Matter
OMZ Oxygen minimum layer
Pa. Paraticinella
pCO2 Partial pressure of atmospheric carbon dioxide
PF Planktonic Foraminifera
Ph Phytane
PLG Poggio le Guaine
PLG-GC Poggio le Guaine – Gorgo a Cerbara composite section PMI 2,6,10,15,19-pentamethylicosane
ppb Parts per billion ppm Parts per million
Pr Pristane
RDS Relative standard deviation
S South
Sect. Section
SiO2 Silica
STO Ocean stagnation model
TAR Terrigenous / aquatic n-alkanes ratio
TE Trace Element
TEX86 Tetraether index of tetraethers containing 86 carbon atoms
TIC Total Ion Current
TLE Total Lipid Extract
TM Trace Metal
TMI 2,6,15,19-tetramethylicosane
TOC Total Organic Carbon
v/v Volume (of solute) per volume (of solvent)
________________________________________________________________________
1
Chapter 1
Introduction
1.1 The late early-Cretaceous time
The late early-Cretaceous (~120-90 Ma) is generally considered as the period of most extreme greenhouse conditions in the Earth’s history. It was characterized by sea surface temperatures 5°C warmer than the present time, absence of polar ice-caps, low thermal latitudinal gradients and the sea level 50-170 m higher than today (Barron, 1983; Sellwood et al., 1994; Huber et al., 1995; Price et al., 1998; Fassel and Bralower, 1999; Hay, 2008). It was a time of considerable changes in plate tectonics, continental rifting, and volcanism associated with the rapid breakup of Gondwana into African and South American plates (Larson, 1991, Tarduno et al., 1991; Arthur et al., 1991; Erba and Larson, 1991; Bralower et al., 1994). Large volcanic episodes led to the formations of seamount chains, continental flood basalts and production of the so-called Large Igneous Plateau (LIP), as Ontong Java, Kerguelen, and Caribbean Plateau (Hays and Pitman, 1973; Schlanger et al., 1981), which affected ecological, climatic, and oceanic conditions across the planet (Föllmi, 2012). The late early-Cretaceous greenhouse climate was probably caused by increased levels of atmospheric greenhouse gasses as mantle CO2, methane
(CH4) and water vapor (H2O) due to extensive submarine volcanic degassing
(Arthur et a., 1985; Weissert and Lini, 1991; Huber, et al., 1995; Price, et al., 1998; Hay, 2008; Madhavaraju, et al., 2013; Millán, et al., 2014). Several events of volcanic CO2 release into the atmosphere linked to the emplacement of LIP have
been inferred from pronounced negative shifts of both carbon and strontium isotope compositions of marine carbonates associated with the main Cretaceous OAEs (Jenkyns, 2010; Erba, 2004; Wagner et al., 2007; Erba et al., 2010; Barral et al., 2017). The largest event of CO2 release events in terms of magnitude of carbon
isotope excursions was related to OAE 1b and lasted ca. 25 kyr (Erba, 2004; Wagner et al., 2007; Barral et al., 2017).
Several studies suggest that the late early-Cretaceous climate was far from stability, and the upper Aptian and the Aptian–Albian transition interval was
Chapter 1: Introduction
________________________________________________________________________
2
characterized by global cooling and possible formation of ice-caps (Weissert and Lini, 1991; Pirrie et al., 1995; Mütterlose et al., 2009; McAnena et al., 2013). Evidence of cool climate comes from i) information of stable isotopes and detection of poleward expansion of vegetational provinces and thermophilic organisms (e.g., Kauffman, 1973; Vakhrameev, 1991; Tarduno et al., 1998; Bice and Norris, 2002; Huber et al., 2002; Wilson et al., 2002; Norris et al., 2002; Barral et al., 2017), ii) evidence of dropstones and glendonites deposition occurred at high latitudes (Kemper and Schmitz, 1981; Price and Nunn, 2010), iii) proof of extreme glacio-eustatic sea level drop based on subsurface seismic and core data (Maurer et al., 2013), iv) signal of relevant variations in calcareous nannofossil assemblages (Mütterlose et al., 2005).
1.2 The Oceanic Anoxic Events (OAEs)
The late early-Cretaceous climate and ocean dynamics promoted episodic deposition of anoxic sediments by effect of intense oceanic periods of dysoxia-anoxia, referred as Oceanic Anoxic Events (OAEs; Schlanger and Jenkyns, 1976). These were generally short-lived (<1 Myr) intervals of increased organic carbon burial in marine sediments, marked by the widespread deposition of dark-coloured, laminated, organic-carbon-rich shales (the so-called “black shales”), and the preferential removal of 12C from the ocean and atmosphere compartments, inducing
relative positive carbon isotopic excursion (tipically 1.0-2.5‰) in biogenic carbonate (Schlanger and Jenkyns, 1976; Ryan and Cita, 1977; Arthur and Premoli Silva, 1982; Arthur et al., 1990; Erbacher and Thurow, 1997; Wilson et al., 1998; Erbacher et al., 2001; Leckie et al., 2002; Erba 2004; Pacton et al., 2007; Jenkyns, 2010; Trabucho Alexandre et al., 2010; Huber and Leckie, 2011; Millán et al., 2014). Some of these black shales horizons are synchronous and have a supra-regional or even global distribution, as the early Aptian Selli Event (OAE 1a), and the Cenomanian/Turonian Bonarelli level (OAE 2) (e.g., Arthur et al., 1990; Bralower et al., 1994; Leckie et al., 2002). Others regionally and locally distributed black shales are common in the Aptian to Albian sedimentary successions of the Northern Tethys and the Northern and Central Atlantic Oceans, as the late Aptian – early Albian OAE 1b and the upper Albian OAE 1c and 1d (e.g. Tornaghi et al., 1989; Bréhéret, 1994, 1997; Leckie et al., 2002; Herrle et al., 2004; Tiraboschi et
Chapter 1: Introduction ________________________________________________________________________
3
al., 2009). These latter horizons are partly characterized by a cyclic pattern organization and have been interpreted as a result of changes in seasonality and monsoonal activity confined to certain regions (e.g. de Boer, 1982; Herbert and Fischer, 1986; Erba, 1992; Bellanca et al., 1996; Herrle, 2002; Friedrich et al., 2003; Galeotti et al., 2003; Herrle et al., 2003a,b; Tiraboschi et al., 2009).
Although the mechanisms responsible for OAEs has been strongly debated and are not yet definitely understood, there is no doubt that they significantly contributed to changes and evolution of the biological marine community, especially particularly in the planktonic assemblages (Fig. 1.1). Microfossil and organic geochemical records suggest drastic change in assemblages of marine organisms during OAEs, associated to dramatic biotic turnovers on planktic protists (Erbacher et al., 1998; 1999; Kuypers et al., 2002; Leckie et al., 2002; Dumitrescu and Brassell., 2005; Okano et al., 2008).
Fig. 1.1. The late early-Cretaceous record of major black shales and oceanic anoxic events (OAEs) in the context of the carbon isotopic record (Erbacher et al., 1996; Bralower et al., 1999), changing global sea level (Haq et al., 1988), seawater chemistry (Bralower et al., 1997), and plankton evolutionary events. (From Leckie et al., 2002).
Chapter 1: Introduction
________________________________________________________________________
4
1.3 The OAE 1b
The Oceanic Anoxic Event 1b replicates many features of the late early-Cretaceous in terms of dynamics of climate, tectonics, sea level, lithofacies and marine plankton. It is shaped by 4 black shale horizons that straddle the Aptian/Albian boundary (named Jacob, Kilian, Paquier and Leenhardt), probably linked to shorter-term perturbations of the carbon cycle (Arthur and Premoli Silva, 1982; Bréhéret et al., 1986; Bréhéret and Delamette, 1987; 1989; Bréhéret, 1988; 1994; 1997 Premoli Silva e Sliter, 1999; Leckie et al., 2002; Huber and Leckie, 2011; Sabatino et al., 2015). The overall duration of the OAE 1b has been estimated 3.8 Myr by Coccioni et al. (2014) based on Grippo et al. (2004) and Huang et al. (2010) studies. This multiple event is associated with cooling interval and sea level fall in the latest Aptian and later, sea level rise and global warming during the early Albian (Leckie et al., 2002; McAnena 2013), documented as the break point between the end of a positive δ13C excursion in the latest Aptian and the beginning
of a pronounced negative shift of δ13C in the early Albian (Weissert and Lini, 1991;
Herrle et al., 2004).
The black shale horizons of the OAE 1b are enriched in organic matter deposited under dysoxic-anoxic conditions and correlate with negative excursions in the δ13Ccarb record, interrupted by brief periods of oxygenation and pelagic carbonate
deposition (Moullade et al. 2011; Coccioni et al., 2014; Kennedy et al., 2014; Sabatino et al., 2015). The black shales of the OAE 1b do not have global distribution, being documented only in Northern Tethys and North-Central Atlantic palaeo-domains; this is also due to unavailable samples from Tethyan and Pacific crust, that was significantly subducted (Li et al., 2016). The lithological and geochemical signatures, as well as the number of black shale levels, vary geographically and can be clearly attributed to different palaeoceanographical settings, variations in the source of OM or diagenetic effects (e.g., Bralower et al. 1999; Erbacher et al. 2001; Kuypers et al. 2002; Herrle et al. 2004; Tsikos et al. 2004). Multiple proxies have been used to investigate OAE 1b intervals: C-O and Sr isotopes, microfossil assemblages, Tex86, TOC, CaCO3, trace metals on sediment
and foraminiferal test, molecular biomarker (e.g. Bralower et al., 1999; Erbaker et al., 1999, 2001; Kuypers et al., 2002; Ludvigson et al., 2010; Huber and Leckie,
Chapter 1: Introduction ________________________________________________________________________
5
2011; Trabucho Alexandre et al., 2011; Coccioni et al., 2014; Herrle et al., 2004; McAnena et al., 2013; Hu et al., 2014; Millán et al., 2014; Sabatino et al., 2015). To date, the Jacob, Kilian, Paquier and Leenhardt anoxic sub-events are considered the record of the regional short-term carbon isotope responses to the global OAE 1b, superimposed on a long-term disturbance of carbon isotope signature of the carbon reservoirs in the global ocean-atmosphere system.
The uppermost Aptian black shale horizon of the OAE 1b is known as the Jacob sub-event and its duration has been estimated 40 ky by Huang et al. (2010). It was interpreted as a “detrital OAE”, induced by land-derived organic matter (Erbacher et al., 1996; Bralower et al., 1993; Leckie et al., 2002). It has been documented only in the Vocontian basin and in Central Italy, where it is referred as 113 level (Herrle, 2002; Friedrich et al., 2005; Coccioni et al., 2012; 2014). However, Coccioni et al. (2014) suggest a possible expression of the Jacob sub-event in the North Atlantic (DSDP Site 545), on the basis of the negative CIEs reported by McAnena et al. (2013). The Jacob sub-event falls in the Paraticinella rohri Zone of Coccioni et al. (2014), corresponding to the Ticinella bejaouensis Zone of Herrle (2002) and Herrle et al. (2004), and to the Paraticinella rohri Zone of Petrizzo et al. (2012).
The Kilian level is the second sub-event of the OAE 1b, and it falls within the Aptian/Albian boundary. It records a 120 kyr-long perturbation documented in the Vocontian Basin, Central Italy, and North and Central Atlantic Ocean (Huang et al., 2010; Trabucho-Alexandre et al., 2011; Petrizzo et al., 2012; Coccioni et al., 2014; Kennedy et al., 2014; Sabatino et al., 2015). According to Herrle (2002) and Herrle et al. (2004), the Kilian level falls in the Hedbergella planispira Zone, whereas Petrizzo et al. (2012), Coccioni et al. (2014) and Kennedy et al. (2014) consider the Kilian level as spanning from the top of the Mi. miniglobularis Zone to the lower part of the Mi. renilaevis Zone.
The lower Albian black shales of the Paquier sub-event is documented in Vocontian basin, Central Italy, North and Central Atlantic Ocean, Pacific Ocean and Mexico (Bréhéret 1983; 1994; Tribovillard and Gorin 1991; Bralower et al. 1999; Erbacher et al. 1999; 2001; Herrle et al. 2003b; 2004; Tsikos et al. 2004; Wagner et al. 2008; Trabucho Alexandre et al. 2011; Coccioni et al., 2014; Sabatino et al., 2015). It has been interpreted as formed by deposition of marine organic
Chapter 1: Introduction
________________________________________________________________________
6
matter and controlled by rising sea level (Herrle et al. 2004; Friedrich et al. 2005; Browning and Watkins 2008; Wagner et al. 2008; Huber and Leckie 2011; Huber et al. 2011; Trabucho Alexandre et al. 2011). Its thickness varies in different sedimentary sequences (e.g. 1.63 m in the Vocontian Basin, 46 cm at ODP Hole1049C) and it lies in the middle part of the Hedbergella planispira Planktonic Foraminiferal Zone (currently the Microhedbergella rischi planktonic foraminiferal Zone of Huber and Leckie 2011).
Finally, the Leenhardt sub-event has been documented only in the Vocontian basin and in Central Italy (Bréhéret, 1994; Herrle, 2002; Coccioni et al., 2014; Sabatino et al., 2015). According to Herrle (2002) and Herrle et al. (2004), the Leenhardt level occurs in the upper part of the Hedbergella planispira Planktonic Foraminiferal Zone (currently the Microhedbergella rischi planktonic foraminiferal Zone of Huber and Leckie, 2011). In analogy with the Paquier level, also the Leenhardt sub-event is considered as “productivity-induced OAE” (Leckie et al., 2002).
Confined only to the Poggio le Guaine section in Central Italy, the Monte Nerone interval comprises several thin levels of dark to black shales, whose equivalents have not been correlated in other sections.
1.4 The late Aptian – early Albian planktonic foraminifera turnover
The late Aptian – early Albian OAE 1b represents a hinge period of biological events on marine biota, recording a major turnover in marine flora and fauna, mainly reflected in changes in the belemnite, radiolarian, and benthic foraminifera taxa, radiation and diversification of planktonic foraminifera (PF) and silicoflagellates, and diversification and crisis within the calcareous nannofossils (Fig. 1.1) (Bralower et al., 1999; Aguado et a., 1999; Leckie et al., 2002). Several studies documented this crucial evolutionary period, even if the continuous sedimentation across the Aptian – Albian Boundary Interval (AABI) is rare, as it is often marked by unconformity (e.g., Amedro, 1992) or dissolution (e.g., Leckie, 1984; Tornaghi et al., 1989) in deeper water sections, or ecological collapse in shallow carbonate-platform sections, providing further evidence of a global environmental perturbation at the boundary level (e.g., Föllmi et al., 2006, Iba and
Chapter 1: Introduction ________________________________________________________________________
7
Sano, 2007). Papers by Huber and Leckie (2011), Petrizzo et al. (2012), and Coccioni et al. (2014) represents reference works for the late Aptian – early Albian planktonic foraminiferal turnover and provide a robust biostratigraphic framework.
Planktonic foraminifera evolved since the Middle Jurassic and their evolution in the late early-Cretaceous period records short episodes of elevated rates of turnover alternating with longer times of relatively diminished rates or stasis. According to Premoli Silva and Silter (1999), the early Cretaceous evolutionary history of PF could be divided into three phases: a first diversification phase in the early Valanginian to the latest Aptian, with continuous diversification pattern temporally interrupted by a single moderate turnover near the Selli Event (OAE 1a). A second evolutionary interval that encompasses the late Aptian - early Albian boundary and records higher diversification rates, and the third phase from the middle Albian to the end of the Cretaceous. Therefore, the AABI records the first and most significant species turnover in the evolutionary history of PF, with the 69% of the late Aptian species becoming extinct and a speciation rate of 23%, for a total of 92% species turnover (Fig. 1.1; Leckie et al., 2002). This turnover resulted in the net change from latest Aptian assemblages dominated by large-sized (mean diameters >250 µm), robust, and coarsely ornamented species, to early Albian assemblages comprised only of minute (mean diameters <100 µm), weakly calcified forms that lack ornamentation (Leckie, 1989; Tornaghi and others, 1989; Erbacher et al., 1999; Premoli Silva and Sliter, 1999; Leckie et al., 2002; Herrle and Mutterlose, 2003; Huber and Leckie, 2011; Petrizzo et al., 2012; Coccioni et al., 2014).
Notably, Radiolaria show strikingly similar patterns of evolutionary turnover to the planktic foraminifera (Erbacher et al., 1996; Aguado et al., 1999; Leckie et al., 2002), and the highest rates of turnover in both organisms occur at or near the major OAEs (Fig. 1.1). Instead, calcareous nannofossils undergone to rapid turnover only at OAE 1a in the early Aptian and OAE 2 at the Cenomanian/Turonian boundary (Fig. 1.1; Leckie et al., 2002).
Chapter 1: Introduction
________________________________________________________________________
8
1.5 Aims and structure of this thesis
The late Aptian / early Albian OAE 1b represents a crucial period of pronounced biotic and climatic/ocean changes. It is indisputable that this OAE induced major perturbations in the oceanic environment and severe disturbance of the biosphere which, in turn, triggered the ecological stress forcing biotic crises. Despite the number of studies reported from literature, the nature and dynamics of oceanographic changes in response to the OAE 1b are still poorly detailed and understood, as well as the role and modes of ecological stressors on the evolutionary behaviour of planktonic foraminiferal community.
Thus, the main aim of this research is to provide additional information and knowledge about the potential relationship between the Oceanic Anoxic Event 1b (OEA 1b) and the first major planktonic foraminiferal turnover occurring at the late Aptian – early Albian interval. This objective will be accomplished using an innovative and multiproxy approach based on high resolution inorganic and organic geochemical analyses, together with micropaleontological and morphometrical investigations of the Poggio le Guaine section, an expanded and well stratigraphically constrained sedimentary succession from the Umbria-Marche Basin (Western Tethys paleo-domain). The late Aptian – early Albian sedimentary sequence from DSDP Site 511 will be used as “control section” to compare the microfaunal signals.
To achieve the overall aim of this thesis, the following specific objectives have been addressed:
i) Investigate the environmental perturbations linked to the OAE 1b, by reconstructing the evolution of oceanic anoxic conditions leading to the Jacob and Kilian black shales deposition, as well as the subsequent gradual restoring of normal oceanic oxic conditions.
ii) Investigate “if” and “how” the regional palaeoceanographic setting amplifies or mitigated the effects of global environmental changes. iii) Assess the key features of the planktonic foraminifera evolutive turnover
and discriminate which signals could represent biotic responses due to basin-scale factors.
Chapter 1: Introduction ________________________________________________________________________
9
iv) Provide new insights into the process which control the intermittent black shale deposition during the OAE 1b.
In a nutshell, Chapter 1 presents a general introduction on late early-Cretaceous climate and a brief review of the state of the art of knowledge on OAEs and in particular on OAE 1b.
Chapter 2 outlines the geological setting of the three sedimentary successions selected for this study, also providing the lithostratigraphic description and the biostratigraphic frameworks for each of them.
Chapter 3 describes the sampling strategies adopted in this study and provides a scheme of the micropaleontological and geochemical dataset produced. The detailed description of the used analytical techniques is also reported.
Chapter 4 offers details about the results of investigations conducted on PLG and GC sections, whereas the results of DSDP Site 511 are described in Chapter 5.
Chapter 6 provides the overall discussion that tie together the main results of this study, attempting to draw conclusions about the climate and ocean evolution and triggers of the OAE 1b, the major environmental changes linked to this multi-event, and the response of the planktonic foraminifera Pa. rohri, (considered as representative of Aptian taxa) to the environmental changes.
________________________________________________________________________
11
Chapter 2
Geological setting, litho- and biostratigraphy
2.1 Poggio le Guaine and Gorgo a Cerbara sections
The Umbria-Marche Basin is a Triassic to Messinian extensional basin developed in the northern offshore of the continental margin of the Apulia block, in the southwestern part of Tethys ocean. This basin experienced the pre-orogenic deformation linked to the northward movement of the Adria continental microplate from Africa relative to northern Europe, such as extensional normal faulting (Marchegiani et al., 1999) that resulted in the deposition of upper Jurassic – lower Miocene pelagic strata above the Triassic to lower Jurassic carbonate platforms. During the Neogene, the succession underwent tectonic inversion linked to the Alpine-Himalayan orogeny, and became part of the foreland fold-and-thrust belt of the Umbria Marche Apennines of central Italy. The Cretaceous sedimentary sequence of the Umbria-Marche Basin is now exposed in the outer part of the arcuate NE-verging northern Apennine fold and thrust belt, and it has been subdivided into four discrete formations: the Maiolica (upper Tithonian – lower Aptian), Marne a Fucoidi (lower Aptian – upper Albian), Scaglia Bianca (upper Albian – lowest Turonian) and Scaglia Rossa (lowest Turonian to middle Eocene) Formations.
Fig. 2.1. Palaeogeographic map at ~113 Ma modified after Huber and Leckie (2011) showing the location of the Poggio le Guaine (PLG) and Gorgo a Cerbara section (red dots), and of DSDP Site 511 (yellow star).
Chapter 2: Geological setting, litho- and biostratigraphy
________________________________________________________________________
12
The Poggio le Guaine (PLG) section (lat. 43°32’29.06” N, long. 12°34’51.09” E; Fig 2.1) is situated on the eastern limb of the Monte Nerone anticline, 500 m southwest of the PLG relief, 6 km west of the town of Cagli (Marche Region) (Fig 2.2).
Fig. 2.2 Schematic geological map (modified from Satolli et al., 2008) of the study area and location of the studied section.
The Aptian – Albian succession of PLG belongs to the Marne a Fucoidi Formation and it deposited at well above the calcite compensation depth, at middle to lower bathyal depths (1000-1500 mbsl) (Coccioni, 1990), in a relatively isolated pelagic basin at ⁓20°N paleolatitude over the southern margin of the western Tethys Ocean (Coccioni et al., 2012, 2014). It consists primarily of pale reddish to dark reddish, and pale olive to greyish olive argillaceous limestones and calcareous marlstones, marlstones, slightly calcareous mudstones to argillaceous mudstones intercalated with several organic–rich black shales, some of which have been identified as the regional to global sedimentary expression of the anoxic sub-events of the OAE1b (Coccioni et al. 1987a,b; 1989a,b; 1990ab; 2006; 2012; 2014; Coccioni and
Chapter 2: Geological setting, litho- and biostratigraphy ________________________________________________________________________
13
Battistini 1989; Erba et al. 1989; Coccioni 1996; Leckie et al. 2002; Trabucho Alexandre et al. 2011; Petrizzo et al. 2012; 2013; Kennedy et al. 2014; Sabatino et al., 2015).
Fig. 2.3. Stratigraphy of the studied interval at Poggio le Guaine and Gorgo a Cerbara sections. Biostratigraphic and age data are from Coccioni et al. (2014) and Coccioni personal communications. Colours were estimated by visual comparison of samples with the Munsell color chart (Munsell, 1907). Dashed line indicates the stratigraphic relationship between the PLG and GC sections.
The Gorgo a Cerbara section (lat. 43°36’01” N, long. 12°33’16” E, Fig. 2.1) is located in the northeastern part of the umbro-marchean Ridge, 4 km east of the town
Chapter 2: Geological setting, litho- and biostratigraphy
________________________________________________________________________
14
of Piobbico (Marche Region), along the Candigliano River (Fig. 2.2). The section crops out in the bed of the Candigliano River east of Monte Nerone, by the km 41.800 of the “Apecchiese” State Road N. 257 and belongs to the Maiolica, the Marne a Fucoidi, the Scaglia Bianca and the Scaglia Rossa Formations (Fig. 2.3). The Gorgo a Cerbara section has been proposed for the GSSP stratotype of the Barremian – Aptian boundary (Erba et al., 1996; Channell et al., 2000; Gradstein et al., 2012) and detailed magnetostratigraphy, chemostratigraphy, cyclostratigraphy, and biostratigraphy has been established by several authors (e.g. Herbert et al., 1995; Channell et al., 1995, 2000; Speranza et al., 2005; Tejada et al., 2009; Stein et al., 2011 Bralower et al., 1989, Coccioni et al., 1992, 2006, 2012; Erba, 1994, 1996; Patruno et al., 2015; Unida and Patruno, 2015; Li et al., 2016).
2.1.1 Lithostratigraphy of Poggio le Guaine section
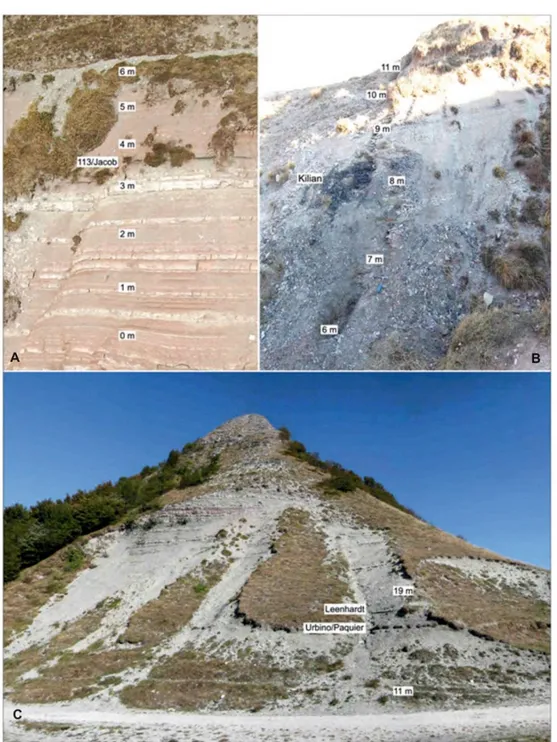
The studied outcrop covers a 19 m thick succession of late Aptian – early Albian marine sediments with no physical evidence of unconformable surfaces, thus basically confirming the stratigraphic continuity of the section. Contacts between different lithotypes are sharp and planar, calcite veins are extremely rare, and no macroscopic diagenetic minerals were observed. Stratigraphic positions of samples are expressed in terms of distance from the base level (Figs. 2.3, 2.4).
The lower part of the section, from 0.00 to 3.40 m, is mainly composed by reddish argillaceous limestone and calcareous marlstone levels with thickness ranging from few centimetres up to 30 cm. The stiffer intercalated greenish-white limestone strata create prominent morphological break in the outcrop. Few thin layers of dark and soft marlstones occur at 0.5 m, 1.0 m, 1.4 m, 1.55 m, and 2.55 m (Fig. 2.4a).
At 3.46 m an abrupt contact marks the deposition of the organic rich black-shale level of the Jacob sub-event. This blackish interval is 10 cm-thick and does not show evidence of inner lamination. The Jacob level passes upward to soft dark greenish argillaceous marlstones, strongly laminated, with total thickness of 8 cm. A monotonous series of pale reddish argillaceous and marly limestones starts at 3.65 m, without main sedimentary change for about 2.36 m. The only interruption are the sporadic beds of greyish marly limestones whose thickness do not exceed 10 centimetres.
Chapter 2: Geological setting, litho- and biostratigraphy ________________________________________________________________________
15
Fig 2.4. The Poggio le Guaine outcrop. A: lower part of the section from 0 to 6 m; B: section from 6 to 11 m; C: section from 11 to 19 m. Stratigraphical meters and the location of black-shale horizons are shown. (from Coccioni et al., 2014).
At about 6.00 m the lithology becomes gradually more clay-rich, and thin bedded, dark green and brown coloured argillaceous marlstones span over 40 centimetres (Fig. 2.4b). From ⁓6.50 m, the succession is characterised by argillaceous limestones with upward chromatic change from pale reddish to mainly pale olive levels. Also the thickness of the single strata changes in parallel with colour, increasing from initial 2-5 cm up to 20 cm at the quote of 7.30 m. Above this
Chapter 2: Geological setting, litho- and biostratigraphy
________________________________________________________________________
16
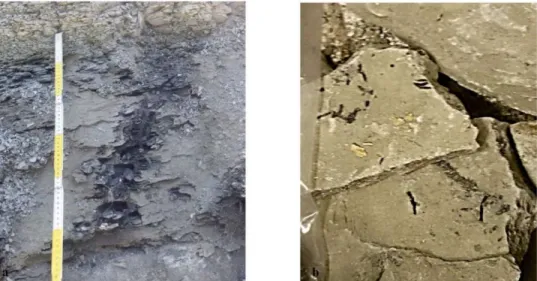
interval, the 40 cm-thick (from 7.97 m to 8.37 m) black shales of the Kilian sub-event are characterized by very fine laminations (Fig. 2.5a), without evidence of bioturbation. Interesting, strata from 10 cm below and above the Kilian level contain small smudges and inclusions of black muds without isorientation (see Fig. 2.5b). Above the sharp boundary with the Kilian level, a rhythmic alternation of dark olive-greyish calcareous mudstone strata and blackish mud and shale horizons occurs, and the frequency of the muddy and shale layers increase upward.
Fig. 2.5. a: Detail of the Kilian black shale level showing the characteristic very fine laminations. b: small smudges and inclusions of black mud in strata below and above the Kilian black shale level.
The “Monte Nerone” interval (10.99 - 13.93 m) consists of about 3 m-thick alternation of pale reddish slightly calcareous mudstones, argillaceous mudstones and black shales. From 14.00 m upward, argillaceous limestones show again the grey-greenish coloration, and show decimetric thicknesses (Fig. 2.4c). The lithological expression of the Paquier sub-event is a 25cm-thick interval of organic-rich black shales (from 16.12 m to 16.37 m), distinctly laminated and with bituminous appearance. Between ca 16.38 m to 17.70 m grey-greenish argillaceous limestones are interrupted by sporadic beds of black clays thinner than 4.5 centimetres. From 17.71 m to 18.00 m, the 29cm-thick black shale of the Leenhardt sub-event is found. The lower part of the level (ca 10 cm) does not show any lamination despite the upper portion that shows an overall waxy and fissile appearance. Finally, from 18.00 m to the top of the studied section, the succession continues with grey-greenish argillaceous limestone strata interbedded with few levels of dark muds and shales.
Chapter 2: Geological setting, litho- and biostratigraphy ________________________________________________________________________
17
2.1.2 Lithostratigraphy of Gorgo a Cerbara section
The studied interval of the Gorgo a Cerbara section (4.80 meters) belong to the Marne a Fucoidi formation and it is dominated by bioturbated dark-red marlstones and thick beds of red marly limestones (Figs. 2.3 and 2.6). Red-brownish calcareous shales occur in thin layers which are more common from -4.80 m to -3.70 m. Two centimetric layers of green-grey-coloured marly limestones interrupt the monotonous series of reddish lithologies at -2.00 and -2.80 meters. The correlation with the PLG section is based on the biostratigraphic observations on planktonic foraminifera assemblages carried out by Prof. Coccioni (personal communications).
Fig. 2.6. Alternation of marls, calcareous marls and argillaceous limestones of the Paraticinella rohri Zone at Gorgo a Cerbara section. Scale bars is 50 cm.
2.1.3 Biostratigraphy of the PLG-GC composite section
The plankton foraminifera biostratigraphy of the uppermost Aptian–lower Albian sedimentary sequence exposed at the Poggio le Guaine was reported in detail by Coccioni et al., (2014). Based on the biozonal schemes of Huber and Leckie (2011) and of Petrizzo et al. (2012), the authors identified different major events that, along
Chapter 2: Geological setting, litho- and biostratigraphy
________________________________________________________________________
18
with minor bioevents, allowed the subdivision in 4 biozones. The terminology of lowest occurrence (LO) and highest occurrence (HO) is here used to delineate the appearance and disappearance of taxa. The major bioevents identified at the PLG section are:
1) HO of Paraticinella rohri at 6.50 m (= Ticinella bejaouaensis in Herrle et al. 2004, and Paraticinella eubejaouensis in Huber and Leckie 2011, and McAnena et al. 2013);
2) LO of the planktonic foraminifera Microhedbergella renilaevis at 7.6 m; 3) LO of the planktonic foraminifera Microhedbergella rischi at 10.8 m. The minor bioevents identified are:
1) HO of the planktonic foraminifera Pseudoplanomalina cheniourensis at 1.9 m; 2) LO of the benthic foraminifera Pleurostomella subnodosa at 2.3 m;
3) acme of the planktonic foraminifera Schackoina cepedai from 2.7 m to 3.4 m; 4) LO of the planktonic foraminifera Microhedbergella miniglobularis at 6.42 m; 5) LO of the planktonic foraminifera Microhedbergella praeplanispira at 11.53 m;
6) the LO of the planktonic foraminifera Microhedbergella pseudoplanispira at 12.1 m.
The horizons corresponding to the 3 main bioevents have been used as horizons boundary of the following planktonic foraminiferal biozones:
1) the Paraticinella rohri Total Range Zone (that is the Ticinella bejaouaensis Zone of Robaszynski and Caron 1995, and the Paraticinella eubejaouensis Zone of Huber and Leckie 2011), from the base of the section to the HO of Pa. rohri at 6.50 m (see Appendix 1);
2) the Microhedbergella miniglobularis Interval Zone spans from the HO of Pa. rohri to the LO of Mi. renilaevis recorded at 7.60 m (see Appendix 1);
3) the Microhedbergella renilaevis Partial–range Zone corresponding to the stratigraphic interval from the LO of Mi. renilaevis to the LO of Mi. rischi (see Appendix 1), and lastly
4) the Microhedbergella rischi Total–range Zone, comprising the stratigraphical interval from the LO of Mi. rischi to the top of the section (see Appendix 1).
The lowest occurrence of Pa. rohri at -4.8 m in the Gorgo a Cerbara section was identified by Coccioni (unpublished biostratigraphic data).
Chapter 2: Geological setting, litho- and biostratigraphy ________________________________________________________________________
19
Estimated ages for the studied section are inferred after Grippo et al. (2004), Huang et al. (2010), Ogg and Hinnov (2012) (GTS 2012), and Ogg et al. (2016) (GTS 2016).
2.2 DSDP Site 511
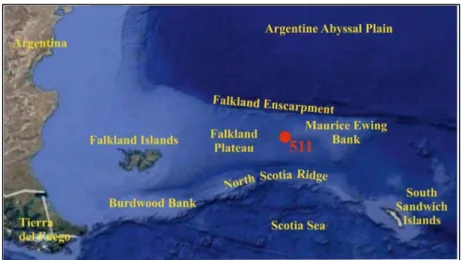
Cretaceous cores from DSDP Leg 71 Site 511 (51°00.28′S, 46°58.30′W; Fig. 2.1) were drilled on the back slope of a cuesta-type ridge in the basin province of Falkland Plateau (southwest Atlantic Ocean), about 10 km south of Maurice Ewing Bank (Ludwig et al., 1983; Plancq et al., 2014; Fig. 2.7, Tab 2.1).
Fig. 2.7 Actual ubication of the DSDP Site 511 (red dot) and main physiographic features of the area.
The Falkland Plateau extends eastwards off southernmost South America, and is bounded by the Falkland Island Platform to the west, the narrow ridge of Falkland Escarpment to the north and by the Falkland Trough and North Scotia Ridge to the south. The occidental portion of the plateau is a segment of oceanic crust (or thinned continental crust) overlaid by a 4-6 km thick sediment wedge, gently dipping southward. During the Jurassic to middle Cretaceous this site was located at about 60°S in a relatively narrow est-west trending ocean basin that had limited or no connection with the South Atlantic (Hay et al., 1999; Huber and Leckie, 2011). Paleowater depth has been estimated to have been between 100-400 m (Basow and Krashenninikov, 1983). Open marine conditions were probably established by the early Albian, and rapid subsidence leaded to a progressive deepening of the basin resulting in the deposition of pelagic clays rich in planktonic fossils (Huber et al., 1995).
Chapter 2: Geological setting, litho- and biostratigraphy
________________________________________________________________________
20
Tab. 2.1. Technical data of the DSDP Site 511 coring DSDP Site 511 Leg 71 (15 – 21 January 1980) Coordinate 51° 00.28’S, 46°58.30’W Water depth 2586 m Penetration 632 m Number of Core 70 Meters cored 632 Meters recovered 385.62 Percentage recovered 61 2.2.1 Lithostratigraphy of DSDP Site 511
The sediments assigned to upper Aptian – early Albian interval of the DSDP Site 511 (Core 55 Sect. 2 – 6 and Core 56 Sect. 1-3, from 482.00 to 493.20 m sub-bottom) correspond to the Unit 5 descripted by Ludwig et al. (1981). The lithology is mainly composed of light-grey to dark grey claystone and mudstone with subordinate amounts of brownish mudstone. In many cases, colours appear to grade from the lightest to the darkest (Fig 2.8), suggesting some gradational environmental change. The darker intervals that rhythmically occur in Core 56 Sect. 2 and 3, coincide with higher content of clay and in place are very fissile.
The moderate to intense bioturbation is a common feature to most samples, and mainly consist of burrows filled with matrix of lighter colour compared to that of the surrounding sediment.
Pyrite is widespread in most of the samples, in the form of macro-aggregates of prismatic crystals, scattered loose aggregate of octahedral micro-crystals, small framboidal spheres, or as long solid or hollow rods which resemble the pyritic “worm tube” described by Siesser and Rogers (1976).
Layers of skeletal carbonate macro-debris, principally pelecypods occur frequently as muddy microcoquinas. Single, thin, whole pelecypod valves (e.g. Aucellina) occur as well throughout the unit, and a small ryncholite was also found in Core 55 Sect. 5 interval 5.0-8.0 cm (485.76 msb). Almost all the samples contain calcite in the form of mollusc shell prims which are probably from Inoceramus, and that are often concentrated in thin bands.
Chapter 2: Geological setting, litho- and biostratigraphy ________________________________________________________________________
21
Fig. 2.8. Biostratigraphic scheme and photographs of the upper Aptian – early Albian cored interval from DSDP Site 511. The interval comprises sediments from Core 56 Section 3, 70-72 cm to Core 55 Section 2, 50-51.5 cm. (From Ludwig et al., 1983; Huber and Leckie, 2011).
2.2.2 Biostratigraphy of the DSDP Site 511
The biostratigraphic framework adopted in this study for the DSDP Site 511 is based on the reference scheme proposed by Huber e Leckie (2011). On the basis of a sampling resolution varing from 1-150 cm, the authors identified the LO of Pa. eubejaouaensis (= Pa. rorhi in this study and Ticinella bejaouaensis of Herrle et al., 2004; see Appendix 1) at 491.23 mbsf. This horizon marks the base of the Pa. eubejaouaensis Taxon Zone, characterized by the occurrence of the nominated taxon along with several specimens of Pa. transitoria, Hedbergella excelsa, Hd. aptiana, Hd. praelippa e few specimen of Hd. infracretacea. The LO of Microhedbergella miniglobularis is recorded at 486.70 mbsf (see Appendix 1), and
Chapter 2: Geological setting, litho- and biostratigraphy
________________________________________________________________________
22
hence Pa. eubejaouaensis and Mi. miniglobularis co-occur in a very short stratigraphic interval, which is similar to observation made by Coccioni et al. (2014) at Poggio le Guaine (Umbria-Marche Basin). The upper boundary of the biozone is marked by the HO of Pa. eubejaouaensis at 486.14 mbsf, coinciding with the biotic turnover level of planktonic foraminifera and in coincidence of which Huber and Leckie (2011) place the Aptian/Albian boundary. From this horizon upward, PF assemblages decrease in maximum diameters and species diversity. The overlaying Mi. miniglobularis Zone spans from the HO of Pa. eubejaouaensis to the LO of Mi. rischi at 484.75 mbsf (see Appendix 1). This ⁓1 m -thick biozone comprises the evolutionary transition from Mi. miniglobularis to Mi. renilaevis, and the extinction of Hd. praelippa. The stratigraphic interval from the LO of Mi. rischi to the highest studied sample (482.00 mbsf) belongs to the Mi. rischi Partial-range Zone. In the lower part Mi. miniglobularis decreases in abundance and then becomes extinct, while Mi. renilaevis becomes increasingly abundant.
The high-resolution micropaleontological observations conducted in this study and the low abundances of planktonic foraminifera along the sedimentary sequence, may slightly change the exact position of some bio-events respect to those reported by Huber and Leckie (2011), as the case of the LO of Pa. eubejaouaensis, (at 491.23 mbsf for Huber and Leckie (2011), at 492.10 mbsf in this study).
________________________________________________________________________
23
Chapter 3
Materials and Methods
3.1 Sampling strategy and data sets
3.1.1 Poggio le Guaine and Gorgo Cerbara sections
This study stays in a framework of three decades of dedicated and detailed stratigraphic research on the Poggio le Guaine section (Arthur and Premoli Silva 1982; Coccioni and Cocon 1987; Coccioni et al. 1987a; 1987b; 1989a,b; Erba, 1988; Coccioni and Battistini 1989; Erba et al., 1989; Tornaghi et al. 1989; Coccioni, 1990; Coccioni et al. 1990a; 1990b; 1991; 1992; Coccioni and Galeotti 1993; Ingram et al. 1994; Coccioni 1996; Baudin et al. 1998; Coccioni et al., 2006; 2012; Fiet and Masure 2001; Satolli et al. 2008; Tiraboschi et al. 2009; Turchyn et al. 2009; Coccioni et al., 2014; Sabatino et al., 2015). This offered the opportunity to start with a large pre-existing dataset and i) to implement knowledge by increasing sampling resolution in specific intervals and ii) enriching the dataset with a new spectrum of chemical/micropaleontological analyses.
The scheme in Figure 3.1 offers a graphical view of the micropaleontological and geochemical dataset produced for the composite section Poggio le Guaine – Gorgo Cerbara.
The main aim of this study was to investigate the potential relationship between the environmental evolution associated to the Oceanic Anoxic Event 1b (OEA 1b) and the first major planktonic foraminiferal turnover occurring at the late Aptian – early Albian interval. To achieve that, new investigation, at high resolution, of the environmental changes potentially related to the Oceanic Anoxic Event 1b (using a multiproxy and innovative approach) provided new constrain for reconstructing the palaeoceanographic evolution of the studied geological interval in term of i) variations in deep-water oxygenation and productivity, and ii) the role of ecological stressors on the evolutionary behaviour of planktonic foraminiferal community.
The stratigraphic interval encompassing the PF turnover (from 3.00 m to 9.00 m) was chosen as primary “target interval” for all the geochemical investigation. The δ13C and δ18O isotope stratigraphy, and CaCO3 content provided by previous works
Chapter 3 Materials and Methods
________________________________________________________________________
24
of Coccioni et al. (2014) and Sabatino et al., (2015) cover the entire section of Poggio le Guaine at centimetric resolution (from 5 cm to 1 cm in proximity of crucial levels), and therefore they didn’t require any implementation. To assess the correct correspondence between the previously logged section and the new one, all the data were re-calibrated by correlating markers beds (e.g. black shales levels).
Elemental geochemistry analyses (Al, Ba, Cd, Co, Cr, Cu, Fe, Hg, K, Mg, Mn, Ni; P, Pb, Sr, Ti, V, Zn, Zr) were carried out for the “target interval” with resolution ranging from 10 to 2 cm, in order to improve the lower sampling resolution reported by Sabatino et al. (2015) for this interval. Samples comprise black-shales of Jacob and Kilian sub-events, marly limestones and argillaceous marlstones.
The biomarkers investigation was carried out on the Poggio le Guaine section. In the absence of previous data in literature, a total of 59 samples was selected along the 19 m-thick section, in order to fully reconstruct the palaeoceanographycal changes linked to all the sub-events of the OAE 1b. Higher resolution was adopted in the “target interval”, with sample spacing from 2 cm in black shales levels to 20 cm in the argillaceous limestone – marlstone intervals. An average resolution of 60 cm was adopted for the marly limestone from 0.00 to 3.00 meters. These represent “control samples” with low contents of organic matter and recording the environmental conditions predating the onset of the OAE 1b. In the upper part of the section, from 9.00 m to 19.00m, samples were taken from the organic-rich black-shale levels.
A higher resolution with respect to the previously reported TOC dataset (Coccioni et al., 2014; Sabatino et al., 2015) was achieved by analysing further 64 samples from the “target interval” and from the specific black shale level in the upper part of the section. More specifically, black-shales of the Jacob and Kilian sub-events were sampled every 2 cm and marly limestones and marls of the “target interval” were selected every 10 cm. From 9.00 and 19.00 meters, samples were selected in order to identify a good correspondence with the samples used for the organic biomarkers analysis.
Chapter 3 Materials and Methods ________________________________________________________________________
25
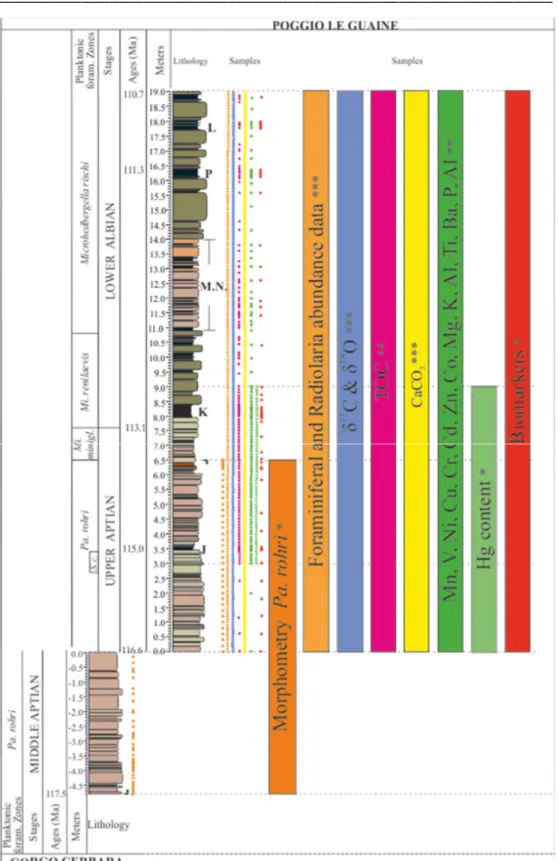
Fig. 3.1. Graphical scheme of data sets collected during the three-years doctoral research and samples positioning along the composite-log Gorgo Cerbara – Poggio le Guaine. Keys to symbols and abbreviations: J: Jacob sub-event; K: Kilian sub-event; M.N.: Monte Nerone black-shales interval; P: Paquier sub-event; L: Leenhardt sub-event; Up arrow: LO of Pa. rohri; Down arrow: HO of Pa. rohri; *: new dataset produced in this study; **: data set from Coccioni et al. (2014) and Sabatino et al. (2015) implemented in this study; ***: data set from Coccioni et al. (2014) and Sabatino et al. (2015).
Chapter 3 Materials and Methods
________________________________________________________________________
26
Finally, the planktonic and benthic foraminiferal and radiolarian assemblages were investigated along the “target interval”. This allowed the positioning along the section of the major foraminiferal bioevents previously identified by Coccioni et al. (2014). The documentation of magnitude and rate of microfaunal turnover across the AABI is based on micropaleontological observations conducted on the target interval with a resolution of 1 sample every 4 cm, and on high resolution abundance data reported in Coccioni et al. (2014).
3.1.2 The morphometrical investigation on Pa. rohri: aims and sampling strategy
After the assessment of the palaeoenvironmental framework and the definition of the turnover event in the microfaunal assemblaeges, it was necessary identify a planktonic foraminifera taxon which would best represent the effect of biotic crisis, until the final extinction, of the late Aptian, and also permitting worldwilde stratigraphic correlations. Among all the possible candidates, Paraticinella rohri best fitted specific requisites. In particular, Pa. rohri is a large-sized, heavy ornamented, and thick-walled taxon (see Appendix 1), very abundant in most of PLG samples, and its presence is reported in several coeval sections such as the Vocontian Basin (Southeastern France; Petrizzo et al., 2012), the North (ODP Sites 1049, DSDP Site 390 and 39, ODP Site 545; Huber and Leckie, 2011) and South (DSDP Sites 511; Huber and Leckie, 2011) Atlantic Ocean, and the South Indian Ocean (ODP Site 763, Huber and Leckie, 2011).
Morphometric analyses were carried out on picked specimens of Pa. rohri going backwards from its highest occurrence (HO) at 6.50 m in the section. The sampling strategy for picking was one sample every 20 cm, in order to ensure an average temporal resolution of ⁓20 ky based on the age model and sedimentation rates estimated by Coccioni et al. (2014). In proximity of significant morphological and/or abundance changes, sample frequency was enhanced until 1 cm (e.g. from 6.23 to 6.50 m). The 4.8 m belonging to the middle Aptian of Gorgo Cerbara section were also analysed for picking of Pa. rohri specimens, allowing to complete and fully describe the total range of this taxon, from its lowest occurrence (LO at -4.8 m at Gorgo Cerbara) to its extinction (HO at 6.5m at PLG). The sampling criteria in GC section were identical to those adopted for PLG section: minimum resolution