https://doi.org/10.1051/0004-6361/201936989 c ESO 2019
Astronomy
&
Astrophysics
L
ETTER TO THEE
DITORDetection of a high-redshift molecular outflow in a primeval
hyperstarburst galaxy
?
G. C. Jones
1,2, R. Maiolino
1,2, P. Caselli
3, and S. Carniani
41 Cavendish Laboratory, University of Cambridge, 19 J. J. Thomson Ave., Cambridge CB3 0HE, UK
e-mail: [email protected], [email protected]
2 Kavli Institute for Cosmology, University of Cambridge, Madingley Road, Cambridge CB3 0HA, UK 3 Centre for Astrochemical Studies, Max-Planck-Institute for Extraterrestrial Physics, Giessenbachstrasse 1,
85748 Garching, Germany
4 Scuola Normale Superiore, Piazza dei Cavalieri 7, 56126 Pisa, Italy
Received 25 October 2019/ Accepted 19 November 2019
ABSTRACT
We report the discovery of a high-redshift, massive molecular outflow in the starburst galaxy SPT 0346-52 (z = 5.656) via the detected absorption of high-excitation water transitions (H2O 42,3−41,4 and H2O 33,0−32,1) with the Atacama Large
Mil-limeter/submillimeter Array (ALMA). The host galaxy is one of the most powerful starburst galaxies at high redshift (star for-mation rate; SFR ∼ 3600 M year−1), with an extremely compact (∼320 pc) star formation region and a SFR surface density
(ΣSFR ∼ 5500 M year−1kpc−2) five times higher than “maximum” (i.e. Eddington-limited) starbursts, implying a highly transient
phase. The estimated outflow rate is ∼500 M year−1, which is much lower than the SFR, implying that in this extreme starburst the
outflow capabilities saturate and the outflow is no longer capable of regulating star formation, resulting in a runaway process in which star formation will use up all available gas in less than 30 Myr. Finally, while previous kinematic investigations of this source revealed possible evidence for an ongoing major merger, the coincidence of the hyper-compact starburst and high-excitation water absorption indicates that this is a single starburst galaxy surrounded by a disc.
Key words. galaxies: high-redshift – galaxies: starburst – ISM: jets and outflows
1. Introduction
Massive galactic outflows in the early universe have been invoked as a key mechanism to regulate or even quench star formation in galaxies (e.g. Muratov et al. 2015; Hayward & Hopkins 2017), and are therefore possibly responsible for the population of massive, passive, and old galaxies, some of which are already in place at z ∼ 2−4 (e.g. Glazebrook et al. 2017; Schreiber et al. 2018;Morishita et al. 2019;Merlin et al. 2019; Santini et al. 2019). Massive, quasar-driven outflows have been detected at z ∼ 6, but they have turned out not to be as effective as expected (Maiolino et al. 2012;Cicone et al. 2015;Bischetti et al. 2019). Massive outflows driven by star formation (either by supernovae or radiation pressure) have been more difficult to detect at high z. While the ionised component has been detected in large samples of high-z star forming galaxies, the cold molec-ular or atomic component (which generally accounts for most of the mass in the outflows) has been much more difficult to trace and there are only a few detections at high z reported to date (George et al. 2014;Spilker et al. 2018).
Cold outflows have been detected in local galaxies using a number of tracers, including CO (e.g.Cicone et al. 2014,2015; Fluetsch et al. 2019), [C II] (e.g.Maiolino et al. 2012;Janssen et al. 2016;Bischetti et al. 2019), OH (e.g.Fischer et al. 2010; Sturm et al. 2011;González-Alfonso et al. 2017), and H2O (e.g. González-Alfonso et al. 2010). Within this context, high-level ? Callibrated datacubes are only available at the CDS via
anony-mous ftp to cdsarc.u-strasbg.fr(130.79.128.5) or viahttp: //cdsarc.u-strasbg.fr/viz-bin/cat/J/A+A/632/L7
water transitions are particularly interesting, as they trace gas that must be very dense and warm in order to populate these levels (e.g.Apostolovski et al. 2019), which are typically found in the cores of compact starbursts.
In order to explore the dense and warm molecular outflow in the starburst galaxy SPT 0346-52 at z= 5.656, we used band 7 of the Atacama Large Millimeter/submillimeter Array (ALMA) to observe the two high-level water transitions H2O 42,3−41,4 (νrest= 2264.14965 GHz, EU∼ 432 K) and H2O 33,0−32,1(νrest= 2196.345756 GHz, EU ∼ 410 K). SPT-S J034640-5204.9 (here-after SPT 0346-52) is a strongly lensed dusty starforming galaxy (DSFG) first studied in the ALMA survey ofWeiß et al.(2013) andVieira et al.(2013) who targeted bright sources detected by the South Pole Telescope survey. Detailed lens modelling shows that the galaxy is magnified by µ= 5.6±0.1 (Spilker et al. 2016), while a source-plane reconstruction reveals indications for either an ongoing major merger or a disturbed rotating disc (Spilker et al. 2015). Spectral energy distribution (SED) modelling yields a massive star formation rate (SFR= 3600 ± 300 M year−1;Ma et al. 2016) and further observations have found substantial [C II] (L[C II] = (5.0 ± 0.7) × 1010L ; Gullberg et al. 2015) and CO (LCO(2−1)= (2.4 ± 0.2) × 108L ;Aravena et al. 2016) emission. However, X-ray, radio, and H2O observations indicate that this source is mainly powered by star formation, with no evidence for a powerful active galactic nucleus (AGN) at any wavelength (Ma et al. 2016;Apostolovski et al. 2019).
In this work, we present new ALMA observations of SPT 0346-52 in band 7, further constraining the size of the compact starburst and revealing H2O 42,3−41,4 and 33,0−32,1
absorption, which are interpreted as signatures of massive out-flows. We assume (ΩΛ,Ωm, h)= (0.692, 0.308, 0.678) through-out (Planck Collaboration XIII 2016). At this distance, 1 arcsec corresponds to 6.033 proper kpc at the redshift of SPT 0346-52 (z= 5.656).
2. Observations and data reduction
Our ALMA band 7 observations were taken between 4 and 11 October, 2016, using 40–43 antennas in configuration C40-7. Out of 3.23 h of total observation time, 1.95 h were on-source. The complex gain, bandpass, and flux calibrators were J0425-5331, J0538-4405, and J0334-4008, respectively. These data were calibrated by ALMA staff following the standard pipeline. Our frequency range was covered by two sidebands, each composed of two spectral windows (SPWs) made of 128 chan-nels, each of them 15.625 MHz wide. Both sidebands are tuned to the redshifted frequencies of water lines, specifically: H2O 42,3−41,4 (redshifted to 340.167 GHz) and H2O 33,0−32,1 (redshifted to 329.980 GHz).
Continuum subtraction was performed in uv-space (CASA uvcontsub) using all line-free channels (i.e. excluding ±750 km s−1from the expected frequency, assuming z= 5.656; Aravena et al. 2016). While the continuum in each sideband changes by ∼1−2% over its corresponding frequency range, we still assume a flat continuum. Continuum subtraction that allowed for a slope in the continuum resulted in nonphysical slopes, and therefore undersubtraction of continuum. We emphasise that the water absorption lines in both the northern and southeastern components are detected clearly regardless of the continuum subtraction method.
Using the CASA task tclean, the continuum-subtracted data in each sideband were used to create spectral data cubes with channels of 15.6 MHz (14 km s−1) and natural weighting in order to balance the root mean square (RMS) noise level and resolu-tion. Since the atmospheric transmission varies strongly across the lower band (i.e. between 0.3 and 0.6 for 2.0 mm precip-itable water vapour), the RMS noise level per channel ranged from 0.2 to 0.5 mJy beam−1. The RMS noise level of the upper band is relatively constant at 0.2 mJy beam−1 per channel. A continuum image was created using the line-free channels that were used for continuum estimation, multifrequency synthesis, and natural weighting. In order to maximise signal recovery, the image was cleaned interactively, resulting in a restoring beam of 0.1400× 0.1200at a position angle of ∼ − 50◦, and an RMS noise level of 0.25 mJy beam−1.
3. Results and evidence for molecular outflow
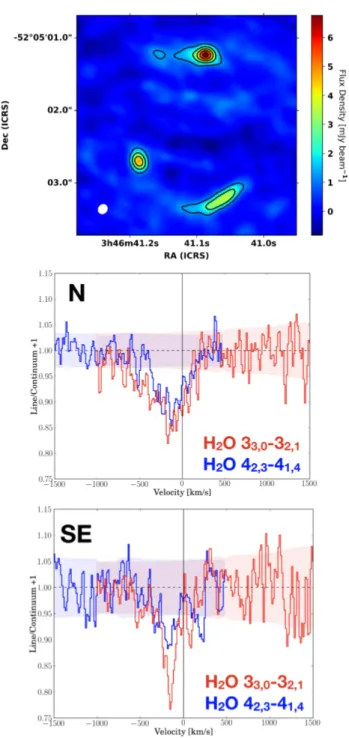
The underlying continuum emission (at λrest ∼ 130 µm, due to emission from warm dust heated by the radiation of young stars) is clearly detected and resolved in three lensed images (top panel of Fig. 1), consistent with previous observations (Vieira et al. 2013;Gullberg et al. 2015;Spilker et al. 2015). We detect clear absorption associated with the two water transitions at the loca-tion of the two strongest continuum images of the galaxy (i.e. the northern and southeastern; middle and bottom panels of Fig.1), but no absorption feature is detected in the third image, which however has much lower surface brightness in continuum and therefore the associated spectrum is more noisy. At the northern and southeastern component the water absorption is centred on the peak of the two continuum images and is not resolved.
To ease interpretation of the water absorption line features, we primarily consider the strongest absorption, H2O 33,0−32,1
Fig. 1.ALMA Band 7 continuum emission and H2O absorption. Top
panel: ALMA band-7 continuum emission. Contours are in steps of 5 × (σ= 0.25 mJy beam−1). Centre panel: H
2O 33,0−32,1and H2O 42,3−41,4
absorption profiles for the northern (strongest) lensed image. The CO-derived redshift of the host galaxy is denoted by a vertical line. Bottom panel: H2O 33,0−32,1and H2O 42,3−41,4absorption profiles for
the southeastern lensed image. The RMS noise level spectra are shown as shaded areas.
in the northern image. The bottom of the absorption feature is blueshifted by ∼170 km s−1 with respect to the local standard of rest traced by the centroid of the emission transitions of CO (Aravena et al. 2016;Dong et al. 2019), [C II] (Litke et al. 2019), and water emission lines associated with lower-energy transi-tions, as illustrated in Fig.2. The data for each of these emis-sion profiles were taken from the ALMA pipeline products, and the emission profiles shown here were extracted over an aper-ture containing all three images, while the water absorption pro-file was extracted from a compact region. The propro-file of the
Fig. 2. Water absorption profile for the northern lensed image com-pared with the total [C II] 158µm (Litke et al. 2019), CO(8–7) (Dong
et al. 2019), CO(2–1) (Aravena et al. 2016), and water emission profiles
integrated over all three images. The H2O 20,2−11,1and 21,1−20,2
emis-sion profiles were taken from ALMA archival data (2013.1.00722.S and 2015.1.00117.S, respectively). All spectra were normalised to their peak/dip and the velocity zero scale is set to zCO = 5.6559, shown by
the black dotted line. The minimum of the water trough (z= 5.6522) is shown by the blue dash-dotted line.
absorption is clearly asymmetric, with a blue wing extending to −500 km s−1with respect to the absorption dip.
It should be noted that after taking velocity-dependent dif-ferential lensing into account, the intrinsic CO(8–7) spectrum was shown to be more symmetric (Dong et al. 2019). How-ever, this differential lensing effect can only affect the extended, low-excitation emission lines, but not the compact (unresolved), high-excitation H2O absorption profile.
An asymmetric blueshifted (by 500 km s−1) absorption pro-file as seen here, especially for a transition that requires extreme gas conditions (extremely high densities, high temperatures, and high column densities, which cannot be associated with tidal fea-tures or satellite galaxies), can only be explained in terms of a dense molecular outflow along the line of sight ( González-Alfonso et al. 2010,2017;Fischer et al. 2010;Sturm et al. 2011; Spilker et al. 2018).
4. Analysis
4.1. Hyperstarburst nature of SPT 0346-52
The far-infrared (FIR) continuum emission (tracing star forma-tion) in the northern image is spatially resolved and has a beam-deconvolved size of (0.34 ± 0.03)00× (0.19 ± 0.02)00. Taking the velocity-independent continuum magnification factor (Spilker et al. 2016) of µ= 5.6 ± 0.1 into account, this corresponds to a source-plane half width at half max (HWHM) of 0.32 ± 0.02 kpc. Using the SFR derived from a fit to SED constructed of multi-ple IR/submillimeter continuum measurements (Ma et al. 2016) (SFR = (3.6 ± 0.3) × 103M year−1) and including a factor of 0.5 to scale the total SFR to the fraction of FIR flux contained within the full width at half max (FWHM)1, we find a SFR
den-sity of ΣSFR = (5.5 ± 0.9) × 103M year−1kpc−2. This value
1 This factor of 0.5 was derived by numerically integrating an elliptical
Gaussian with unity amplitude over all space, and dividing this value by the integral of the same elliptical Gaussian over all space where its value was ≥0.5.
is larger than the previously derived ∼4.2 × 10³M year−1kpc−2 (Hezaveh et al. 2013) and (1.5 ± 0.1) × 103M
year−1kpc−2(Ma et al. 2016), due to our new constraints from our high-resolution imaging. This surface density of star formation is a factor of five times higher than that of “maximum” (i.e. Eddington-limited) starbursts (ΣSFR,EL∼ 103M year−1kpc−2; Thompson et al. 2005).
This extreme surface density of SFR may potentially be an indication that the IR radiation is actually powered by an AGN, however there is no evidence for an AGN at any wavelength, not even in the hard X-ray Chandra observations, which at this red-shift sample energies out to 60 keV (Ma et al. 2016). In princi-ple, the AGN could be completely Compton thick (i.e. absorbed by a column of gas larger than 1025cm−2). However, the SED, including IR bands, is better fit using a pure starburst model than a composite starburst and AGN model (Ma et al. 2016). More-over, the lack of radio emission is fully consistent with what is expected by the SFR, and leaves little room for any contribu-tion to the bolometric luminosity from a heavily Compton thick, obscured quasar.
4.2. Kinematic nature of SPT 0346-52
Previous observations of the extended [C II], CO, and H2O emis-sion from SPT 0346-52 (Litke et al. 2019; Dong et al. 2019; Apostolovski et al. 2019) and their associated source-plane reconstruction suggested evidence for an ongoing merger of two galaxies, separated by ∼500 km s−1and 1 kpc in the source plane. Namely, they revealed asymmetric double-peaked emission, a non-uniform velocity gradient, and a “bridge” of emission con-necting the two sources.
However, a full multi-channel gravitational lens analysis revealed that while the CO(8–7) profile appears asymmetric, this is only due to differential lensing, and it is intrinsically sym-metric (Dong et al. 2019). In addition, a simple rotating disc is expected to present two emission peaks at high velocity, with a lower-significance bridge connecting them (e.g. North et al. 2019). With this in mind, the current kinematics of this source are not sufficient to distinguish between a double merger and a single rotator (Bois et al. 2011;Simons et al. 2019).
One point that breaks this degeneracy is the finding that the very compact continuum emission tracing the hyper-Eddington starburst is located between the two [C II] peaks (Fig.3), coinci-dent with the peak of velocity dispersion. Moreover, our detec-tion of high-excitadetec-tion, compact water absorpdetec-tion is coincident with this continuum peak. The small spatial extent of tion requires a compact continuum source. The water absorp-tion lines detailed in this work (H2O 42,3−41,4and 33,0−32,1) are associated with ortho-H2O upper levels that are at an energy of Eu/kB ∼ 400 K above ground, and therefore they require high temperatures, high gas densities (nH> 106cm−3), and high column densities (NH > 1024cm−2) to be observable (van der Tak et al. 2007; González-Alfonso et al. 2012). Furthermore, the lower levels, which must be populated in order to see our lines in absorption, have El/kB ∼ 300 K, underlining the need for high-excitation gas to be able to see our lines. These con-ditions (extremely compact source, hyper-Eddington starburst, and extremely high column densities of warm gas) are seen only in the cores of some extreme ultra-luminous infrared galaxies (ULIRGs;González-Alfonso et al. 2010,2012), and cannot be associated with a tidal bridge of diffuse gas between two merg-ing galaxies (Schirm et al. 2016).
These findings show that the merger interpretation cannot hold. Due to the high redshift and excitation of this source, it
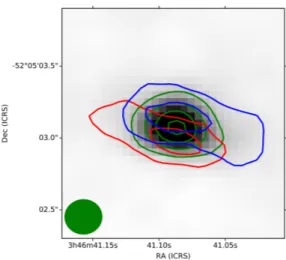
Fig. 3. Red and blue halves of the [C II] emission in red and blue contours respectively, together with the rest-frame 158 µm continuum in green and greyscale (Litke et al. 2019). Data were taken from the ALMA archive and passed through the automatic CASA calibration pipeline. A flat continuum was fit to the uv-space data using all line-free channels, and this continuum was subtracted using the CASA task
uvcontsub
. The continuum image was created with natural weight-ing usweight-ing the continuum model subtracted from the full cube, while the line cube was created with the continuum-free visibilities. No lens-ing correction has been applied (i.e. images are image-plane). [C II] contours are shown at 5, 10σ, where 1σ= 0.13 Jy beam−1km s−1, and0.16 Jy beam−1km s−1 for red and blue, respectively. Continuum
con-tours are shown at 10, 20, 30, 40σ, where 1σ= 0.47 mJy beam−1. The
continuum peak is clearly located between the red and blue [C II] peaks. The synthesised beam of the continuum image is shown by the filled green ellipse in the lower left.
is likely a rotating disc undergoing a number of minor merg-ers, resulting in a galaxy similar to the simulated z = 6.18 “disturbed disk” ofKohandel et al.(2019). This would explain the strong, compact central continuum emission and central dense and warm outflow, as associated with the starbursting core of the galaxy. In addition, the asymmetric double horned profile (see Fig. 6 of Kohandel et al.), which however becomes sym-metric when corrected for differential lensing (Dong et al. 2019), and PV diagrams of [C II] (Litke et al. 2019) can be explained in terms of a galactic disc (or even a ring).
4.3. Outflow model
In order to interpret the water absorption profile, we created a simple spherical outflow model and examined its predicted spec-trum. In this model, a spherical continuum emitter is surrounded by a shell of outflowing gas which we assume to feature a con-stant mass outflow rate (i.e. related velocity and density profiles). The optical depth at each radius is then determined and used to derive the fraction of emitted photons at a given frequency blocked by each parcel of gas. By performing this calculation at all locations in the outflowing shell, we create an absorp-tion spectrum normalised by the total continuum level. Assum-ing a range of shell widths and a velocity and density profile, a Bayesian inference code (MultiNest; Feroz & Hobson 2008) was used to explore a wide parameter space (i.e. outflow veloc-ity dispersion, inner optical depth, and launch velocveloc-ity) to find the best-fit parameters2.
2 The spherical outflow model used to fit the observed spectrum is
available athttps://github.com/gcjones2/SphOut. See appendix for more details.
Fig. 4.Molecular outflow rate as a function of SFR for galaxies with
detected molecular outflows. The range and average of best-fit outflow rates of SPT 0346-52 for three possible shell widths are shown, assum-ing zCO and SFRSED = (3.6 ± 0.3) × 103M year−1(Ma et al. 2015).
The molecular outflow detected in this work is in the most powerful starburst. Additional data include both low-redshift sources (Fluetsch
et al. 2019) and the higher-redshift galaxies XID2028 (z= 1.593;Brusa
et al. 2018), SMM J2135 (z= 2.326;George et al. 2014), zC400528
(z= 2.387;Herrera-Camus et al. 2019), APM08279+5255 (z = 3.912;
Feruglio et al. 2017), and SPT2319-55 (z= 5.293;Spilker et al. 2018).
A representative uncertainty for all low-redshift sources (±0.3 dex) is shown for one such source. Outflows driven by AGNs are shown by diamonds, while those driven by starbursts are shown by star symbols. Each object is coloured according to its redshift.
Since the current data suggest that this source is a sin-gle, rotating galaxy rather than a pair of merging galaxies, we adopt zCOas the source redshift (where zCO is taken from the centroid of the CO profile). Exploring a range of shell widths (i.e. dR/RCONT = 3, 19, and 10, following the geometries obta-ined byGonzález-Alfonso et al.(2010,2012,2017), and assum-ing that the CO-based redshift traces the rest-frame of the galaxy, these parameters yield possible total mass outflow rates in the range ˙M ∼ 100−900 M year−1, with an average value of ˙M ∼ 500 M year−1.
When the results are compared to local galaxies and other high-redshift outflows, it is apparent that the molecular outflow in SPT 0346-52 is the one observed in the galaxy with the highest SFR, by a large factor (Fig.4).
Outflow rate can also be quantified in terms of the ratio of the rate of mass expelled by the outflow to the SFR (i.e. the outflow mass loading factor, η). If we take the zCOmass outflow rate val-ues and assume SFRIR = (3.6 ± 0.3) × 103M year−1(Ma et al. 2016), then we find a mass loading factor of η ∼ 0.03 − 0.28. An earlier SED fit (Ma et al. 2015) yielded a larger value of SFRSED= (4.5 ± 1.0) × 103M year−1, which would result in an even smaller mass loading factor of η = ˙M/SFR= 0.02 − 0.22. For all assumed shell widths and SFRs, we find a significant out-flow, with a mass-loading factor well below unity.
One may argue that, given that the CO, [C II], and (low-level) H2O emission lines trace the rotating disc, their centroid may not provide an accurate measurement of the systemic velocity. One possibility is that the dip of the water absorption traces the sys-temic velocity of the core of the galaxy. If one adopts the dip of the water absorption as the rest-frame of the galaxy, then the inferred outflow rate drops by more than one order of magnitude,
making an even stronger case that in this galaxy the mass-loading factor of the starburst-driven outflow is well below unity. Outflows of local star forming galaxies show a mass-loading factor of order unity while those hosting a powerful AGN often have a loading factor significantly higher than unity (Cicone et al. 2014;Fluetsch et al. 2019), as illustrated in Fig.4. The outflow loading factor in SPT 0346-52 is not well constrained (i.e. η = 0.03 − 0.28, possibly even lower), but it is well below unity. Most likely, for this hyperstarburst galaxy, whoseΣSFRis more than five times above the Eddington limit, its capability of driving an outflow has saturated and the outflow rate does not follow the same scaling with SFR as in other galaxies. The impli-cation is that the outflow does not have the same “regulatory” effect as in other less extreme star forming galaxies (lower SFR, less compact, and lower ΣSFR). As a consequence this galaxy is probably in a runaway phase, in which star formation is pro-ceeding at a high rate and high efficiency, consuming all of the available gas in less than ∼30 Myr (Litke et al. 2019). If there is no accretion of fresh gas from the intergalactic medium (IGM) then this galaxy will quickly turn into a passive galaxy, which will evolve into the population of passive galaxies observed to be already in place at z ∼ 2−4.
It is interesting that, contrary to many standard scenarios, “uneffective” outflows (uneffective in their “ejective” mode) could be a new route to rapidly quench star formation in a galaxy, in the sense that this type of outflows allows star formation to enter into a runaway process and to consume gas at an even higher rate than usual. The key role of the outflow may how-ever be to dump energy into the halo, thereby keeping it hot, and preventing the accretion of fresh cold gas which could restart star formation.
5. Conclusions
Here we present new ALMA observations in band 7 of SPT 0346-52, a strongly lensed starburst galaxy at z = 5.656, characterised by an SFR of 3600 M year−1.
Thanks to our higher angular resolution relative to previous observations, we can measure more accurately measure the size of the continuum emission (and therefore of the star forming region), which turns out to have a half-light radius of 320±20 pc. This results in an extremely high surface density of star for-mation rate of ΣSFR = 5500 M year−1kpc−2, which is more than five times higher than in a “maximum” starburst (i.e. an Eddington-limited starburst), indicating that this galaxy must be in a highly transient phase.
Furthermore, the data reveal H2O 42,3−41,4 and 33,0−32,1 absorption, with asymmetric blueshifted profiles, which are unambiguous signatures of a massive nuclear outflow, with velocities up to 500 km s−1. Using a spherical outflow model, we find a mass outflow rate of ∼100−900 M year−1, imply-ing a mass loadimply-ing factor η much smaller than unity. An out-flow mass loading factor of unity is what is observed in most other star forming galaxies and is what is required by models to “regulate” star formation. In this extreme galaxy the outflow, despite being very massive, is not vigorous enough to regulate star formation. As a consequence, star formation will proceed in a runaway mode, at a high rate and high efficiency, consuming all of the available gas in less than ∼30 Myr, and therefore rapidly quenching star formation. If not replenished with fresh gas from the IGM, the galaxy will then evolve into the population of pas-sive galaxies seen already in place at z ∼ 2−4.
Finally, our results show that the previous interpretation of a major merger for the kinematics of this source is untenable.
The compact continuum with very dense and warm outflowing gas must be the core of a single compact starburst galaxy, while emission lines (CO, [C II]) are likely tracing a gaseous disc (or ring) in the host galaxy.
Acknowledgements. This paper makes use of the following ALMA data: 2013.1.00722.S, 2015.1.00117.S, and 2016.1.01313.S. ALMA is a partnership of ESO (representing its member states), NSF (USA) and NINS (Japan), together with NRC (Canada), MOST and ASIAA (Taiwan), and KASI (Republic of Korea), in cooperation with the Republic of Chile. The Joint ALMA Observatory is operated by ESO, AUI/NRAO and NAOJ. G.C.J. and R.M. acknowledge ERC Advanced Grant 695671 “QUENCH” and support by the Science and Technol-ogy Facilities Council (STFC). We thank Justin Spilker for useful comments.
References
Apostolovski, Y., Aravena, M., Anguita, T., et al. 2019,A&A, 628, A23
Aravena, M., Spilker, J. S., Bethermin, M., et al. 2016,MNRAS, 457, 4406
Bally, J. 2016,ARA&A, 54, 491
Bischetti, M., Maiolino, R., Carniani, S., et al. 2019,A&A, 630, A59
Bois, M., Emsellem, E., Bournaud, F., et al. 2011,MNRAS, 416, 1654
Brusa, M., Cresci, G., Daddi, E., et al. 2018,A&A, 612, A29
Buchner, J., Georgakakis, A., Nandra, K., et al. 2014,A&A, 564, A125
Carr, C., Scarlata, C., Panagia, N., & Henry, A. 2018,ApJ, 860, 143
Castor, J. I. 1970,MNRAS, 149, 111
Cicone, C., Maiolino, R., Sturm, E., et al. 2014,A&A, 562, A21
Cicone, C., Maiolino, R., Gallerani, S., et al. 2015,A&A, 574, A14
Dong, C., Spilker, J. S., Gonzalez, A. H., et al. 2019,ApJ, 873, 50
Feroz, F., & Hobson, M. P. 2008,MNRAS, 384, 449
Feruglio, C., Ferrara, A., Bischetti, M., et al. 2017,A&A, 608, A30
Fischer, J., Sturm, E., González-Alfonso, E., et al. 2010,A&A, 518, L41
Flagey, N., Goldsmith, P. F., Lis, D. C., et al. 2013,ApJ, 762, 11
Fluetsch, A., Maiolino, R., Carniani, S., et al. 2019,MNRAS, 483, 4586
George, R. D., Ivison, R. J., Smail, I., et al. 2014,MNRAS, 442, 1877
Glazebrook, K., Schreiber, C., Labbé, I., et al. 2017,Nature, 544, 71
González-Alfonso, E., Fischer, J., Isaak, K., et al. 2010,A&A, 518, L43
González-Alfonso, E., Fischer, J., Graciá-Carpio, J., et al. 2012,A&A, 541, A4
González-Alfonso, E., Fischer, J., Spoon, H. W. W., et al. 2017,ApJ, 836, 11
Gullberg, B., De Breuck, C., Vieira, J. D., et al. 2015,MNRAS, 449, 2883
Hayward, C. C., & Hopkins, P. F. 2017,MNRAS, 465, 1682
Herrera-Camus, R., Tacconi, L., Genzel, R., et al. 2019,ApJ, 871, 37
Hezaveh, Y. D., Marrone, D. P., Fassnacht, C. D., et al. 2013,ApJ, 767, 132
Huber, M. C. E., & Sandeman, R. J. 1986,Rep. Prog. Phys., 49, 397
Janssen, A. W., Christopher, N., Sturm, E., et al. 2016,ApJ, 822, 43
Karska, A., Kristensen, L. E., van Dishoeck, E. F., et al. 2014,A&A, 572, A9
Kohandel, M., Pallottini, A., Ferrara, A., et al. 2019,MNRAS, 487, 3007
Litke, K. C., Marrone, D. P., Spilker, J. S., et al. 2019,ApJ, 870, 80
Ma, J., Gonzalez, A. H., Spilker, J. S., et al. 2015,ApJ, 812, 88
Ma, J., Gonzalez, A. H., Vieira, J. D., et al. 2016,ApJ, 832, 114
Maiolino, R., Gallerani, S., Neri, R., et al. 2012,MNRAS, 425, L66
Mangum, J. G., & Shirley, Y. L. 2015,PASP, 127, 266
Melnick, G. J., Tolls, V., Neufeld, D. A., et al. 2008,ApJ, 683, 876
Merlin, E., Fortuni, F., & Torelli, M. 2019,MNRAS, 490, 3309
Morishita, T., Abramson, L. E., Treu, T., et al. 2019,ApJ, 877, 141
Muratov, A. L., Kereš, D., Faucher-Giguère, C.-A., et al. 2015,MNRAS, 454, 2691
North, E. V., Davis, T. A., Bureau, M., et al. 2019,MNRAS, 490, 319
Planck Collaboration XIII. 2016,A&A, 594, A13
Prochaska, J. X., Kasen, D., & Rubin, K. 2011,ApJ, 734, 24
Rupke, D. S., Veilleux, S., & Sanders, D. B. 2005,ApJS, 160, 115
Santini, P., Merlin, E., Fontana, A., et al. 2019,MNRAS, 486, 560
Scarlata, C., & Panagia, N. 2015,ApJ, 801, 43
Schirm, M. R. P., Wilson, C. D., Madden, S. C., & Clements, D. L. 2016,ApJ, 823, 87
Schreiber, C., Glazebrook, K., Nanayakkara, T., et al. 2018,A&A, 618, A85
Simons, R. C., Kassin, S. A., Snyder, G. F., et al. 2019,ApJ, 874, 59
Sobolev, V. V. 1960,Moving Envelopes of Stars(Harvard Univ. Press) Spilker, J. S., Aravena, M., Marrone, D. P., et al. 2015,ApJ, 811, 124
Spilker, J. S., Marrone, D. P., Aravena, M., et al. 2016,ApJ, 826, 112
Spilker, J. S., Aravena, M., Béthermin, M., et al. 2018,Science, 361, 1016
Sturm, E., González-Alfonso, E., Veilleux, S., et al. 2011,ApJL, 733, L16
Thompson, T. A., Quataert, E., & Murray, N. 2005,ApJ, 630, 167
van der Tak, F. F. S., Black, J. H., Schöier, F. L., Jansen, D. J., & van Dishoeck, E. F. 2007,A&A, 468, 627
Vieira, J. D., Marrone, D. P., Chapman, S. C., et al. 2013,Nature, 495, 344
Appendix A: Spherical outflow model
A.1. Model overview
In order to convert our observed absorption profile to physical values (e.g. density, velocity, ˙M), we first consider a spherical outflow with a set inner radius (RIN) and thickness (dR) around a continuum source of radius RCONT. Next, we assume that the inner continuum source radiates isotropically, with no limb dark-ening. This results in three types of observed spectral features: the continuum emission from the inner source, H2O absorption by shell material between this source and the observer, and H2O emission from the entire shell.
We require that the mass outflow rate is constant for all posi-tions in the outflow (i.e. ρAv = ρ4πr2v = constant;Scarlata & Panagia 2015;Carr et al. 2018), which implies ρ ∝ 1/(r2v), and may be stated as:
v(r) = vo r RIN !γ (A.1) ρ(r) = ρo r RIN !−γ−2 , (A.2)
where γ is a constant. Adopting Gaussian units, the optical depth of an outflow at radius r for a photon of a given transition of water may be given by (Sobolev 1960;Castor 1970;Prochaska et al. 2011;Scarlata & Panagia 2015;Carr et al. 2018):
τ(r) = πe2fluλluρl(r) mecmH2O|dv/dr| = τo r RIN !−2γ−1 (A.3) τo= πe2f luλluρloRIN mecmH2Ovoγ , (A.4)
where fluis the oscillator strength, λluis the wavelength of this transition, and ρl(r) is the number density of water molecules in the lower state. We note that this form assumes a large velocity gradient, a central isotropic emitter, and negligible stimulated emission.
The fraction of photons blocked by a parcel of gas is given by:
B= 1 − e−τ(r). (A.5)
Each photon from the IR source will only interact with an H2O molecule when the Doppler-shifted frequency of the photon is equal to the resonant frequency of a transition, meaning that the approaching hemisphere of the outflow will be blueshifted, and the receding half redshifted. We focus only on the transi-tion of H2O 33,0−32,1. Because we assume spherical symmetry, the physical space to explore may be described by only two vari-ables: the distance from the centre of the IR source, measured in the plane of the sky (rsky), and the position in the shell, as mea-sured parallel to our line of sight (zshell). We split the domain of rsky into small segments, examine each value of zshell, and use Eq. (A.5) to calculate the fraction of incident radiation that is absorbed by each cell. We then account for the symmetry of our model by multiplying this cell radiation fraction by the frac-tion of the continuum source that is subtended by this value of rsky (i.e. 2rskydr/Rin2), and we add this contribution to the total spectrum.
Since the outflow is certainly highly turbulent, we also con-sider a velocity dispersion σv by convolving our continuum-normalised spectrum with a 1D Gaussian.
A.2. Model implementation
Due to the arguments in the main text, we believe that the rest-frame of the redshift is most likely that traced by the CO-based redshift (zCO = 5.656), but will also consider the effects of assuming the redshift of the red component of [C II] emission (z[C II],R= 5.6594;Litke et al. 2019).
While any value of γ would satisfy mass conservation (Eqs. (A.1) and (A.2)), we require decreasing velocity and den-sity as a function of radius (i.e. −2 < γ < 0), and thus assume γ = −1.
While it is also possible to fit for the shell thickness (dR), these fits yields poor constraints. The resolution of the data is insufficient to directly observe the spatial extent of the out-flow. However, detailed modelling of local ULIRGs similar to SPT 0346-52 (i.e. very compact) suggest dR/RCONT values of ∼3 for NGC 4418 and ∼19 for Arp 220 (González-Alfonso et al. 2017). Since the central cores of both of these sources exhibit the necessary temperature for the upper level of our transitions (∼350−400 K), we explore the effects of the value of dRRCONT= 3, 19, and the intermediate case of 10.
In order to account for the emission, the four emission profiles of [C II] 158µm (Litke et al. 2019), CO(8–7) (Dong et al. 2019), CO(2–1) (Aravena et al. 2016), and H2O 20,2−11,1 and 21,1−20,2 (2013.1.00722.S and 2015.1.00117.S, respec-tively) were averaged and binned to the same velocity reso-lution as our observations. This average emission profile was added to the convolved spectrum, with a scaling factor. How-ever, this scaling factor was highly uncertain, and was usually quite small. Because of this, we assume that the emission is negligible.
There are several additional parameters that we do not con-sider, including the ratio of the continuum source radius to the shell inner radius (i.e. the size of the hollow region inside the shell) and aperture (as a fraction of the total source radius) of our observations. As the aperture becomes smaller than unity, the amount of flux that is absorbed at small negative veloci-ties decreases. Since we observe a large amount of absorption at these velocities, we assume that both values are unity. In addi-tion, it is possible to consider a biconic outflow rather than a spherical outflow, but if azimuthal symmetry is assumed, then any change in the conic opening angle would result in lower absorption at small negative velocities. In summary, we assume that the inner boundary of the shell is coincident with the outer surface of the continuum source, and consider the entire spheri-cal outflow shell.
We apply this model to the best spectrum for SPT 0346-52: H2O 33,0−32,1for the northern component. Using the Bayesian inference code MultiNest (Feroz & Hobson 2008) and its python wrapper (PyMultiNest;Buchner et al. 2014), we fit for the fol-lowing free parameters: the velocity at the interior surface of the shell (v◦), the optical depth constant (τo), and the FWHM of the convolving Gaussian (σv).
Since we have no initial information on the geometry of the outflow, our prior probability distributions are rela-tively broad. We adopt log-uniform distributions for v◦ and σv (100−103.5km s−1), and a log-uniform for τo in the range 10−8−100.
We may estimate the mass outflow rate of the shell by assum-ing the simple form (Rupke et al. 2005):
˙
M= 4πr2ρv. (A.6)
Due to our assumption of mass conservation in the outflow, this value is constant for all radii inside the outflow. Next, we may
estimate the density of water in each lower state by inverting equationA.4: ρH2O,l(RIN)= τomecmH2Ovoγ πe2f luλluRIN · (A.7)
Adopting a density ratio of XH2O = ρH2O/ρtotal and assuming
a Boltzmann distribution (Mangum & Shirley 2015), the total density can be written as:
ρtotal= ρH2O XH2O =ρH2O,lQrote El kT XH2Ogl , (A.8)
where ρtotal is the total matter density of the outflow, Qrot is the rotational partition function, and glis the degeneracy of the lower state. We may determine flu using (Huber & Sandeman 1986):
flu= (1.4992)λ2Aul gu gl
, (A.9)
where λ is measured in centimetres, gu = gl = 7, and Aul = 0.06616 s−1. Combining these expressions, we find:
˙ M=4RINτomecmH2Ov 2 oQroteEl/kT e2f luλluXH2Ogl · (A.10)
Since the water absorption is unresolved, we assume an upper size limit of the beam size (∼0.1300 = 0.8 kpc). Adopting a magnification factor of µ= 5.6 ± 0.1 (Spilker et al. 2016) for this compact source, this corresponds to a source-plane radius of RIN= 0.07 kpc.
If we assume that the outflow is dominated by H2, then we may approximate XH2O ∼ ρH2O/ρ ∼ (mH2O/mH2)(NH2O/NH2) ∼
9χH2O, where χH2O = NH2O/NH2 is the abundance of water
with respect to H2. This abundance varies by environment: χH2O ∼ 0.5 × 10
−7 for star forming regions in the Milky Way (Flagey et al. 2013) and χH2O ∼ 10
−6 for the warm, extended components of local ULIRGs (González-Alfonso et al. 2010, 2012), although these values are model dependent. Much higher water abundances of χH2O ∼ 10
−4have been found for shock-heated gas in protostellar outflows (Melnick et al. 2008), but lower abundances have been derived for the outflow as a whole (e.g. χH2O ∼ 3 × 10
−7;Karska et al. 2014;Bally 2016). Since SPT 0346-52 is an extreme ULIRG, we adopt the same abun-dance inferred for local ULIRGS (χH2O∼ 10
![Fig. 2. Water absorption profile for the northern lensed image com- com-pared with the total [C II] 158µm ( Litke et al](https://thumb-eu.123doks.com/thumbv2/123dokorg/4780653.48312/3.892.67.427.121.400/water-absorption-profile-northern-lensed-image-pared-litke.webp)