Establishment and characterization
of a new spontaneously
immortalized ER
−
/PR
−
/HER2
+
human breast cancer cell line,
DHSF‑BR16
Stefania Nobili
1,6,7, Antonella Mannini
2,7, Astrid Parenti
1, Chiara Raggi
2, Andrea Lapucci
1,
Giovanna Chiorino
3, Sara Paccosi
1, Paola Di Gennaro
4, Vania Vezzosi
5, Paolo Romagnoli
2,
Tommaso Susini
1& Marcella Coronnello
1*Invasive ductal carcinoma (IDC) constitutes the most frequent malignant cancer endangering women’s health. In this study, a new spontaneously immortalized breast cancer cell line, DHSF‑BR16 cells, was isolated from the primary IDC of a 74‑years old female patient, treated with neoadjuvant chemotherapy and disease‑free 5‑years after adjuvant chemotherapy. Primary breast cancer tissue surgically removed was classified as ER−/PR−/HER2+, and the same phenotype was maintained by DHSF‑BR16 cells. We examined DHSF‑BR16 cell morphology and relevant biological and molecular markers, as well as their response to anticancer drugs commonly used for breast cancer treatment. MCF‑7 cells were used for comparison purposes. The DHSF‑BR16 cells showed the ability to form spheroids and migrate. Furthermore, DHSF‑BR16 cells showed a mixed stemness phenotype (i.e. CD44+/CD24−/low), high levels of cytokeratin 7, moderate levels of cytokeratin 8 and 18, EpCAM and E‑Cadh. Transcriptome analysis showed 2071 differentially expressed genes between DHSF‑BR16 and MCF‑7 cells (logFC > 2, p‑adj < 0.01). Several genes were highly upregulated or downregulated in the new cell line (log2 scale fold change magnitude within − 9.6 to + 12.13). A spontaneous immortalization signature, mainly represented by extracellular exosomes‑, plasma membrane‑ and endoplasmic reticulum membrane pathways (GO database) as well as by metabolic pathways (KEGG database) was observed in DHSF‑BR16 cells. Also, these cells were more resistant to anthracyclines compared with MCF‑7 cells. Overall, DHSF‑BR16 cell line represents a relevant model useful to investigate cancer biology, to identify both novel prognostic and drug response predictive biomarkers as well as to assess new therapeutic strategies.
Breast cancer is the most common and lethal cancer in women worldwide1. Tumor and patient characteristics
are classical factors that drive breast cancer therapy and predict prognosis together with the status of specific biomarkers, such as estrogen receptor (ER), progesterone receptor (PR) and human epidermal growth factor receptor 2 (HER2). These biomarkers contributed to the classification of five major subtypes of breast cancer: Luminal A (i.e. ER positive (ER+)/PR positive (PR+), HER2 negative (HER2−); Luminal B (i.e. ER+/PR+, HER2+
or HER2− with high levels of Ki-67); Triple-negative/basal-like (i.e. ER−/PR−, HER2−); HER2-enriched (i.e.
ER−/PR−, HER2+), and Normal-like (ER+/PR+, HER2− with low levels of Ki-67), being the triple-negative subtype
predictive off the worst prognosis.
OPEN
1Department of Health Science, Section of Clinical Pharmacology and Oncology, University of Florence, viale
Pieraccini, 6, 50139 Florence, Italy. 2Department of Experimental and Clinical Medicine, University of Florence,
Florence, Italy. 3Fondazione Edo ed Elvo Tempia Valenta, Biella, Italy. 4Plastic and Reconstructive Surgery Unit -
Regional Melanoma Referral Center - Tuscan Tumor Institute (ITT), Santa Maria Annunziata Hospital, Bagno a Ripoli, Florence, Italy. 5Department Organizational Structure (SOD) of Pathological Histology and Molecular
Diagnostics, AOU Careggi, Florence, Italy. 6Present address: Department of Neurosciences, Imaging and Clinical
Sciences, “G. d’Annunzio” University, Chieti, Italy. 7These authors contributed equally: Stefania Nobili and
However, breast cancer is a very heterogeneous disease as evidenced by genetic and gene expression profiling studies2 that further subclassify the above reported molecular subtypes. In particular, gene expression studies
have further refined the ability to predict response to chemotherapy and prognosis by developing breast cancer genomic profiles (e.g. Oncotype DX) that can be used in selected cases3.
Overall, HER2 is amplified and overexpressed in 25–30% of human breast cancers. Although HER2+ breast
cancer patients have a worse prognosis compared with HER2− cancer patients, the availability of the anti-HER2
monoclonal antibody trastuzumab has changed the natural history of this tumor, thus significantly improving the overall survival of HER2+ breast cancer patients4. However, at least 85% of HER2+ overexpressing breast
cancer is ER− and PR− at baseline5, thus preventing patients from undergoing hormonal therapy. On this basis,
it is clear the need to identify new drugs as well as novel targets useful for the treatment of hormone receptor negative breast cancer.
Although it is well known the relevance of the complex interplay between cancer cells and tumor microen-vironments in tumor response to treatment, in vitro studies based on established tumor cell lines still represent the starting point to design powerful in vivo and translational clinical studies6. Several established breast cancer
cell lines, representative of the different mammary tumor subtypes7, are available and are commonly used to
investigate breast cancer heterogeneity as well as breast cancer sensitivity to different drugs or to identify new potential pharmacological targets8–10.
Thus, the availability of additional appropriate cellular models may significantly improve the knowledge on breast cancer molecular heterogeneity, the discovery of new biomarkers useful in predicting drug response or to be used as drug targets.
Tumor established cell lines have often been obtained through immortalization protocols that may cause the selection of subpopulations with transformed phenotypes no longer representative of the original cancer tissue11.
In this paper, we report the isolation and characterization of a spontaneously immortalized breast cancer cell line, a very rare phenomenon in primary breast cancer cultures, that shows human telomerase reverse transcriptase (h-TERT) expression levels similar to those of MCF-7 cell line, isolated in 197310 by a pleural effusion of breast
cancer, and that represents a classical in vitro model for the study of breast cancer features, including sensitivity/ resistance to anticancer treatments.
Our breast cancer cell line, named DHSF-BR16 (i.e. Department of Health Science of Florence-Breast16), was derived from a patient affected by ER−/PR−, HER2+ primary IDC. We compared DHSF-BR16 with MCF-7 cells
(ER+/PR+, HER2−) under identical culture conditions to highlight their molecular and functional differences
in order to carefully characterize the biological properties of DHSF-BR16 cells and identify genes or pathways potentially relevant for new therapeutic strategies.
Thus, by establishing and characterizing this new cell line, our aim was to provide the scientific community with a new cellular model useful to further investigated human breast cancer.
Materials and methods
Patient information.
The patient was a 74 years old female affected by locally advanced IDC. Prior to chemotherapy and subsequent surgery, the patient underwent needle biopsy. The histological diagnosis was infiltrating breast carcinoma with weak (< 1%) ER staining (clone SP1), negative for PgR (clone 1E2), 60% cells positive for Ki-67 (clone MIB1) and HER2 positive with intense staining > 10% (score 3+). Thus, the patient underwent neoadjuvant chemotherapy including liposomal doxorubicin and cyclophosphamide followed by paclitaxel and trastuzumab. Trastuzumab was also administered in the post-operative setting. A partial clinical and radiographic response was documented after neoadjuvant treatment with a 50% reduction of the tumor diameter. As a surgical procedure a quadrantectomy with sentinel node biopsy and removal of 2 additional I level axillary lymph nodes was performed. The histological and biological characteristics of the tumor were the following: high grade (G3) IDC not otherwise specified, ER−/PR−, HER2+ 40% (color intensity score 3+), 60%of cells positive for Ki-67 (i.e. highly proliferating tumor). The pathological stage evaluated post-neoadjuvant chemotherapy was: ypT1c; ypN0 (sn)(mol). The patient is disease-free 5-years after adjuvant chemotherapy. The patient gave her written informed consent to the use of part of the surgical specimen for the study purposes. The study was approved by the local ethics committee of the Careggi Hospital, University of Florence (Firenze, Italy), and all the relative procedures were performed in accordance with SOPs (Standard Operating Procedures) and relevant guidelines and regulations of the Careggi Hospital, University of Florence (Firenze, Italy).
Tissue non‑enzymatic processing.
Tissue samples (primary tumor histologically confirmed to be not significantly contaminated by normal tissues, necrotic tissues and lymphocytes, and histologically normal tis-sue adjacent to the tumor), were rapidly frozen in liquid nitrogen. Within 30 min from surgery, a tumor tistis-sue portion, was placed in Advanced DMEM/F12 medium with 5% fetal bovine serum (FBS) (Gibco), 2 mM glu-tamine and an antibiotic/antifungal solution (Gibco) containing 10,000 units/mL of penicillin, 10,000 µg/mL of streptomycin, and 25 µg/mL of amphotericin B, and immediately transferred to the laboratory for subsequent processing. Tumor tissue was manually separated from adipose areas using sterile scalpel and was minced into pieces < 1 mm3 with sterile scissors; the pieces were placed in a sterile microblade-equipped polyethylenecham-ber, medicon (Becton–Dickinson) with medium mentioned above. When the medicons were inserted into the Medimachine (Becton–Dickinson), the fragments came into contact with the blades and were dissociated from four to five times for 20 s at a constant speed < 100 r.p.m12. Medium containing recovered cells was filtered by
porous polyester membranes (Becton–Dickinson). After filtration, cells were washed and transferred into a 1 mL plate and observed under an inverted microscope (Leitzs, Germany) in order to check the presence of organoids; subsequently organoids were separated from the other cellular fractions by centrifugation at 700 rpm for 2 min. Pellet, suspended in complete culture medium, was incubated at 37 °C in a humidified atmosphere at 5% CO2.
After 24 h, organoids and single cells started the attachment process, and the supernatant, loaded in organoids and non-adherent cells, was transferred on a new plate. This operation was repeated every 48–72 h to get a cel-lular culture ever cleaner and to increase the number of available celcel-lular samples. Differential trypsinization was used to get rid of the fibroblasts13. Briefly, cells were incubated with trypsin for a 1 min, until detachment
of fibroblasts. Then, fibroblasts were discarded and the dish was washed 2–3 times with Advanced DMEM/F12 medium before adding fresh complete medium to the cells. Cultures were observed daily for cell growth and the medium was changed every three days (Supplementary Fig. S1).
Establishment of the DHSF‑BR16 cell line.
DHSF-BR16 cell line, initiated from the primary IDC, took 24 months to establish in Advanced DMEM/F12 medium added with 3% FBS, 2 mM glutamine, and with-out antibiotic/antifungal solution. Cell subconfluence was achieved within 10 days and subculture ratio was 1:3/1:5. Cell aliquots were frozen under liquid nitrogen in different passages. Freezing medium was composed of Advanced DMEM/F12 medium/FBS/DMSO 40/50/10% (v/v). The recovery of cells and their adhesion to the flask after thawing were slow.Cytogenetic analysis.
Growing cultures were harvested for karyotypic analysis. Optimal numbers of cells in mitosis were obtained by adding colchicine in a final concentration of 0.16 µg/mL of colture medium and incubated at 37 °C. After cell collection, the conventional protocol for chromosome preparation was applied14.Flow cytometry.
All samples were acquired by a FACSCanto flow cytometer (Becton Dickinson) and for each sample 20,000 events were acquired and analyzed by FCS 6 Express software (De Novo Software).DNA index. To evaluate the DNA index, unfixed DHSF-BR16 cells and human lymphocytes obtained from a
health volunteer were stained with a Propidium Iodide (PI) staining technique15. The DNA index was calculated
as the ratio of DHSF-BR16 cells and peripheral blood diploid (2n) lymphocytes G0/G1 fluorescence channels.
According to Ross et al.16, a DNA index of 1.0 is indicative of diploidy whereas a ratio ranging from 0.85 to 1.9 is
indicative of ipo- or hyper-diploidy, respectively.
Evaluation of duplication time and cell cycle progression. These growth parameters have been evaluated in the
same experiment by cell counting and PI staining, respectively, according to the procedures described in Coron-nello et al.17.
Expression of CD44/CD24 antigens. The expression of CD44 and CD24 surface antigens was measured after
DHSF-BR16 and MCF-7 cell staining with CD44 and CD24 antibodies (Thermo Fisher), according to the manu-facturer’s instructions (Supplementary Methods).
Detection of reactive oxygen species (ROS). ROS production was evaluated using
2′,7′-dichlorodihydrofluores-cein diacetate (DCFH-DA, Kodak)18. Fresh stock solution of 2 mM (w/v) DCFH-DA in ethanol was prepared
and kept at − 20 °C in the dark until the use. Briefly, cells were incubated with DCFH-DA solution (10 µM) at 37 °C for 1 h in a humidified atmosphere with 5% CO2. After washing, the fluorescence of cells was acquired by
FACS (i.e. λex 488 nm, λem 530 nm).
Electron microscopy.
Cells were rinsed in saline (0.1 mol/L phosphate buffer, pH 7.4, 380 mOsm/L) and fixed with 2% formaldehyde and 2.5% glutaraldehyde in 0.1 mol/L cacodylate buffer, pH 7.4, osmicated and embedded in Epon. 1 µm-thick-sections, unstained or stained with alkaline toluidine blue, were observed by light microscopy, and about 70 nm-thick sections were observed by a JEM 1010 electron microscope (Jeol), at 80 kV, upon staining with gadolinium acetate followed by lead citrate or bismuth subnitrate19. The imageswere acquired by a digital camera MegaView III (Soft Imaging System GmbH) connected to a computer (Dell) equipped with a dedicated software (Soft Imaging System, AnalySIS 3.1 version; https:// www. scien tistl ive. com/ conte nt/ 9182).
Enzymatic and fluorescent immunocytochemistry.
The analysis of ER, PR, and HER2 status was performed by an immunoenzymatic technique associated with immunofluorescence on a cellular spot obtained from the established cells (see details in Supplementary Methods). Cells were labeled with a large panel of anti-bodies (i.e. epithelial markers), including anti-ER/PR and anti-HER2 antianti-bodies, and analyzed by a Leica DMLB light microscope equipped for epifluorescence (Leica Microsystems GmbH) for a qualitative analysis20.Fluorescent in situ hybridization (FISH).
The amplification of HER2 by FISH analysis was carried out according to ASCO/CAP HER-2 2018 guidelines21.Tumor spheroid‑based migration on matrix protein.
Generation of spheroids. The hanging dropstechnique according to Insphero (InSphero AG) manufacturer’s instructions was used. Single DHSF-BR16 and MCF-7 cells were seeded at various cell densities (ranging from 1000 to 8000) into special hanging drop culture plates. In order to obtain optimal spheroids (200–300 µm) without central necrotic area after 4 days of culture, an inoculum of 2000 cells/well was used. MCF-7 culture conditions are described in Supplementary Methods.
Migration method. Cell migration was studied by using tumor spheroids. 200–300 μm-spheroids were
trans-ferred into gelatin-coated flat-bottomed 96-well plates (a single spheroid/well) with addition of culture medium (T0). Cell migration was recorded every 24 h for a total period of 144 h. We obtained images using an inverted
Leitz microscope (Leitz Corporation, Stuttgart, Germany), equipped with a 6MP Digital Camera (CCD vision sensor, square pixels of 4.4 µm side length, 1600 × 1200 pixel resolution, 8-bit grey level) (TiEsseLab, Italy). The ISCapture software (version 3.6.9.1; http:// www. tiess elab. com) was used to obtain 2D morphological parameters (diameter, perimeter, area) as well as to select morphologically homogeneous spheroids and to measure degree of the migration in the time22.
Gelatinase activity by zymography.
Gelatinase MMP2 and MMP9 activity, involved in matrix remod-eling and tumor cell invasion, was measured as reported in Paccosi23, by quantitative densitometry (seeSup-plementary Methods).
RNA preparation.
Total RNA was extracted from primary tumor and normal tissues and from DHSF-BR16 and MCF-7 cells with the RNeasy kit (Qiagen) according to the manufacturer’s instructions. The RNA concen-tration and quality were measured using an optical NanoDrop ND1000 spectrophotometer (Thermo Scientific). The RNA integrity was assessed by the Agilent 2100 Bioanalyzer (Agilent Technologies Inc.), according to the product user guide. All RNA samples used in this study had the 260/280 ratio > 1.9 and an RNA Integrity Num-ber (RIN) from 5 to 9.Quantitative real‑time PCR (RT‑qPCR).
Total RNA (500 ng) from primary tumor and normal tissues and from DHSF-BR16 and MCF-7 cells were transcribed to cDNA with a High-Capacity cDNA Reverse Tran-scription Kit (Applied Biosystems).Changes in the mRNA expression level of 38 candidate genes selected on the basis of their biological role in cancer, were detected using FAST SYBR-Green PCR Master Mix and the ABI ViiA 7 System (Applied Biosys-tems). Ribosomal 18S RNA (rRNA) and glyceraldehyde 3-phosphate dehydrogenase (GAPDH) were used as a normalizer for h-TERT and all the other candidate genes, respectively.
The fold difference (2−ΔΔCt) was calculated using the ΔCt of MCF-7 as control. All reactions were performed
in triplicate. Primers used for RT-qPCR are listed in Supplementary Table S1.
Microarray expression profiling.
Transcriptome analysis was performed on RNA samples of DHSF-BR16 and MCF-7 cells obtained from three independent pellets as reported above .Gene expression profiling was carried out using the one-color labelling method: labelling, hybridization, slide washing and scanning were performed following the manufacturers protocols (Agilent Technologies). Briefly, mRNA from 100 ng of total RNA was amplified, labeled with Cy3 and purified with columns. Labeled samples (600 ng) were hybridized on Agilent Human Gene Expression 8 × 60 K v3 microarrays. After 17 h, slides were washed and scanned using the Agilent Scanner version C (G2505C, Agilent Technologies). The fluores-cence intensities of scanned images were extracted and pre-processed by Agilent Feature Extraction Software (v10.7.3.1).
Bioinformatic analysis. Differential expression analysis was performed by using the R Bioconductor
reposi-tory (http:// www. bioco nduct or. org) limma package. Raw intensities were background corrected and normalized with the quantile function. Signals from replicate probes were averaged. Differentially expressed genes (DEGs) were retrieved by combining linear models with empirical Bayes analysis and modified t test raw p values were adjusted for multiple testing by using Benjamini–Hochberg procedure.
Functional analysis. DAVID software (Database for Annotation, Visualization and Integration Discovery; http:// david. abcc. ncifc rf. gov/) for functional enrichment analysis of the DEGs in DHSF-BR16 cells compared with MCF-7 cells was used. Over-represented Biological Processes, Cellular Components and Molecular Func-tions of the Gene Ontology (GO) database, as well as KEGG pathways were retrieved by setting to 0.01 the threshold of the enrichment p-value.
Drug sensitivity assay.
The best cell inoculum density for the determination of doxorubicin sensitivity was preliminarily defined by the sulforhodamine B (SRB) assay17. Briefly, DHSF-BR16 cells were seeded onto96-well microplates (Sarstedt) at a density of 1.0, 1.5, 2.0, 3.0 × 10⁴ cells/well. After 24 h of incubation at 37 °C in
a humidified atmosphere with 5% CO2, the culture medium was replaced with fresh medium and doxorubicin
was added at final drug concentrations varying from 3 × 10⁻⁸ to 1 × 10⁻⁴ M. After 72 h of incubation, the assay
was terminated by the addition of cold TCA and the cells were stained according to the procedure reported in Coronnello et al.17 to determine the IC
50 values. After choosing the optimal cell density, the sensitivity of
DHSF-BR16 and MCF-7 cells (same cell density/well) to epirubicin, docetaxel and paclitaxel was evaluated at pharmacological concentrations ranging from 1 nM to 10 µM for epirubicin and from 0.003 nM to 0.1 µM for taxanes. The pharmacological sensitivity of the study cell line was compared with that of the MCF-7 reference line and was indicated by the resistance index (RI) obtained from the ratio between the IC50 values of the two
cell lines for each individual drug. Respect to MCF-7 line, RI values higher than 1 indicate resistance of DHSF-BR16 cells to the tested drug and values lower than 1 indicate drug sensitivity. Cytotoxicity data are represented as mean ± standard error (SE).
Statistical analysis.
Student t-test was used for pairwise comparison. Statistical analysis was performed by GraphPad version 5 (Graph Pad Prisme Software Inc., La Jolla, CA) or as specified in the previous paragraphs, p values < 0.05 were considered statistically significant.Results
h‑TERT expression, cytogenetic, morphologic and growth characteristics of DHSF‑BR16
cells.
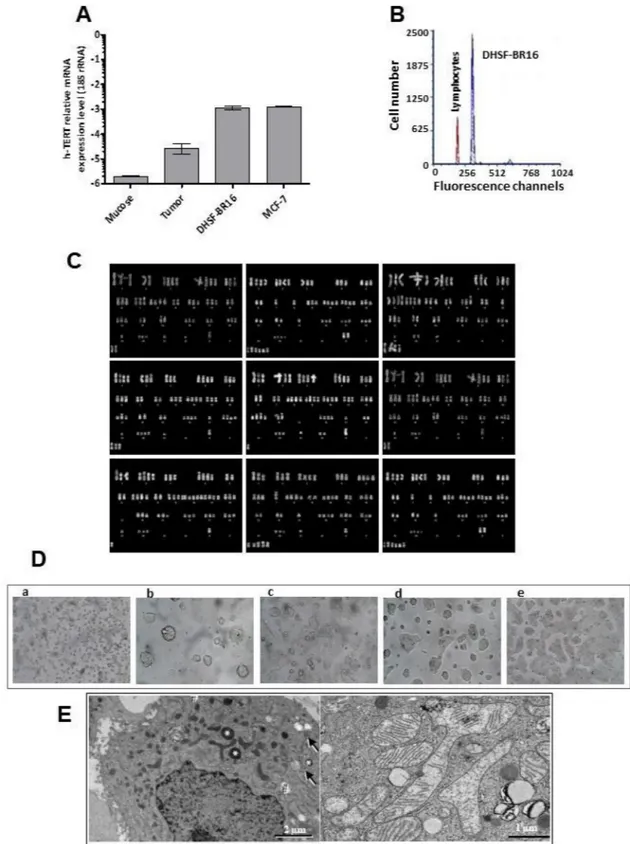
As a first approach, we analyzed the expression of the h-TERT gene, a component of the immortaliza-tion signature by RT-qPCR. Results showed low or lack of h-TERT expression levels in the primary tumor and in normal tissue, respectively. Conversely, high levels of h-TERT mRNA were observed in DHSF-BR16 and, as expected, in MCF-7 cells that are known to endogenously express this gene (Fig. 1A).FACS analysis showed that DHSF-BR16 cells had a DNA index of 1.6, thus indicating a relevant percentage of aneuploid tumor cells (Fig. 1B), in agreement with cytogenetic findings (Fig. 1C).
The modal chromosome number of the DHSF-BR16 cell line was 56, with a range of 49–63 chromosomes/cell. The DHSF-BR16 karyotype (Fig. 1C) was characterized by numeric alterations and the presence of unidentifiable marker chromosomes. Several chromosomes were absent, and others were clearly under- or over-represented.
The DHSF-BR16 cell line displayed an epithelial morphology with patchy appearance, as compact multi-layered colonies (Fig. 1D). DHSF-BR16 cells rarely became confluent and many materials, potentially of secre-tory origin, and some cellular debris were present in the culture supernatant. DHSF-BR16 cells were required to be split every 10 days: a longer period implicated a strong adhesion to the flask, making also more difficult the detachment (Fig. 1D, e). After 24 h seeding (Fig. 1D, b), many spontaneous spheroids and viable cells were in suspension, and the percentage of adherent cells was 25%.
The morphology of DHSF-BR16 isolated cells was studied by electron microscopy (Fig. 1E). Isolated cells were 10–15 µm in diameter, had a round or oval nucleus often with shallow indentations, loose chromatin and large nucleolus. The cell surface expanded into many short microvilli. Mitochondria were round up to 300 nm wide or elongated up to ~ 1 µm, occasionally branched. There were occasional very large mitochondria, with a variable amount of cristae.
The DHSF-BR16 cells progression through the cell cycle phases as a function of the time was studied (Sup-plementary Fig. S2). Interestingly, the highest percentage of cells under division (G2M 13.7%) was reached
within 48 h; in the later times, the slowdown in proliferation was confirmed by a moderate and constant mitotic activity which ensured a constant proliferative potential. The duplication time was evaluated as reported in Supplementary Fig. S2.
Remarkable ROS generation in DHSF‑BR16 cells.
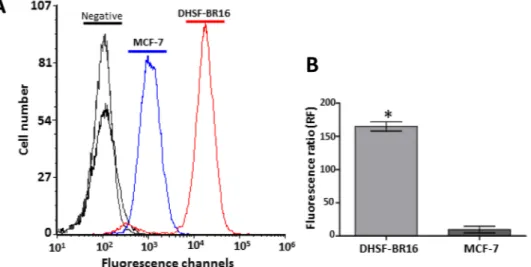
Due to the fundamental role of ROS in cancer initiation, development and progression, the basal oxidative stress of DHSF-BR16 cells was evaluated by FACS analysis and compared with that of MCF-7 cells (Fig. 2). The ROS generation was about 17-fold higher in DHSF-BR16 than in MCF-7 cells, as shown by the Fluorescence Ratio (FR) value (FR 165 and 9.6, respectively).DHSF‑BR16 cell molecular setting and biomarker characterization.
To evaluate the long-term maintenance of the molecular setting (i.e. ER−/PR−/HER2+) of the primary tumor, the immunoenzymatic andimmunofluorescent analyses were repeated on a cellular spot obtained from DHSF-BR16 cells kept in culture for about 2 years, confirming the ER−/PR−/HER2+ phenotype in DHSF-BR16 cells, and the ER+/PR+/HER2−
phenotype, belonging to MCF-7 cells (Fig. 3A). Also, the amplification of HER2 has been further evaluated by FISH analysis (Figure S3), and the HER2 positive phenotype of DHSF-BR16 cells as well as the HER2 negative phenotype of MCF-7 cells has been confirmed.
DHSF-BR16 and MCF-7 cells were also characterized for cytokeratins (CKs) (i.e. CK5/6, CK7, CK8 and 18), EpCAM and E-Cadh expression by fluorescent immunocytochemistry (Fig. 3B). Compared to MCF-7 cells, the DHSF-BR16 cells showed a strong expression of CK7 (13 times), a low expression of CK8 and CK18 (< 1), and lack of expression of CK5/6, in both cell lines (data not shown). Finally, E-Cadh and EpCAM fluorescence in DHSF-BR16 cells was moderate, although higher than that reported in MCF-7, (i.e. 1.4 and 2.3 fold increase, respectively) (Fig. 3C).
Concerning the expression of CD44/CD24 cell-surface markers (Fig. 3D), FACS analysis revealed 43.4% of CD44+/CD24− cells in the DHSF-BR16 cell line (56.6% of CD44+/CD24low). In contrast, MCF-7 cells showed
2.9% of CD44+ /CD24− cells (46.7% of CD44+/CD24low). Also, DHSF-BR16 cells displayed a higher fluorescence
intensity of CD44 compared to MCF-7 cells.
Migration and invasivity.
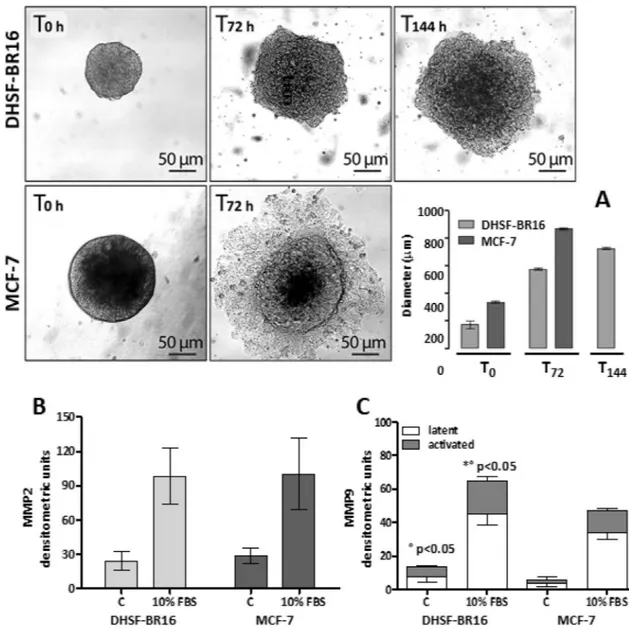
200–300 µm spheroids were transferred to gelatin (1:100) coated plates. In Fig. 4, we reported representative images of DHSF-BR16 and MCF-7 spheroid migration processes, and the graph (Fig. 4A) with the evaluation means of the spheroid diameters, measured at various times of the migra-tion test. DHSF-BR16 migrating cells exhibited a very compact and multi-layered migramigra-tion pattern, reaching a diameter comparable to that of MCF-7 cells (about 800 µm) at 144 h. MCF-7 spheroid cell dissemination was rapid with a dispersed and monolayered migration pattern.MMP2 and MMP9 activities have been compared in DHSF-BR16 and MCF-7 cells. Gelatin zymography of both cell lines supernatants showed a constitutive release of the latent isoform of MMP2 (band at 72 kDa), which increased following 10% serum stimulation (Fig. 4B). No statistical differences in MMP2 activity were observed. The latent MMP9 isoform (92 kDa) was detected in both cell lines, although at a lesser extent, which increased after serum stimulation (Fig. 4C). Interestingly, both the latent and the activated MMP9 isoforms of DHSF-BR16 were significantly increased (p < 0.05) compared to those of MCF-7 cells.
Figure 1. h-TERT gene expression, cytogenetic, morphologic and growth characteristics of DHSF-BR16 cells. (A) mRNA expression levels of h-TERT in DHSF-BR16 and MCF-7 cells, breast cancer tissue and the corresponding normal tissue. (B) Aneuploidy of DHSF-BR16 cells by the DNA analysis. DHSF-BR16 and human peripheral blood lymphocytes G0/G1 fluorescence channel is 318 and 195, respectively. (C) Representative karyotype from DHSF-BR16
cell line with different number of chromosomes, various chromosomal rearrangements and unidentifiable marker chromosomes. Chromosome analysis was performed at 10th and 30th passages with similar findings. (D) First subculture of DHSF-BR16 established cell line: (a) cells splitted; (b) 1 day from split; (c) 4 days from split; (d) 7 days from split; (e) 10 days from split, showing patchy appearance. × 40 magnification (a), × 200 magnification (b–e). (E) DHSF-BR16 cell morphology by electron microscopy: left, isolated cell, with short, sparse microvilli on the cell surface. Asterisks: electron dense lysosomes; hashtags: lipid droplets; arrows: arrays of glycogen particles; right, mitochondria round or elongated up, occasionally branched. There were very large mitochondria, elongated and more than 3 µm long and with irregular dilations up to 2 µm, with variable amount of cristae.
Transcriptome analysis.
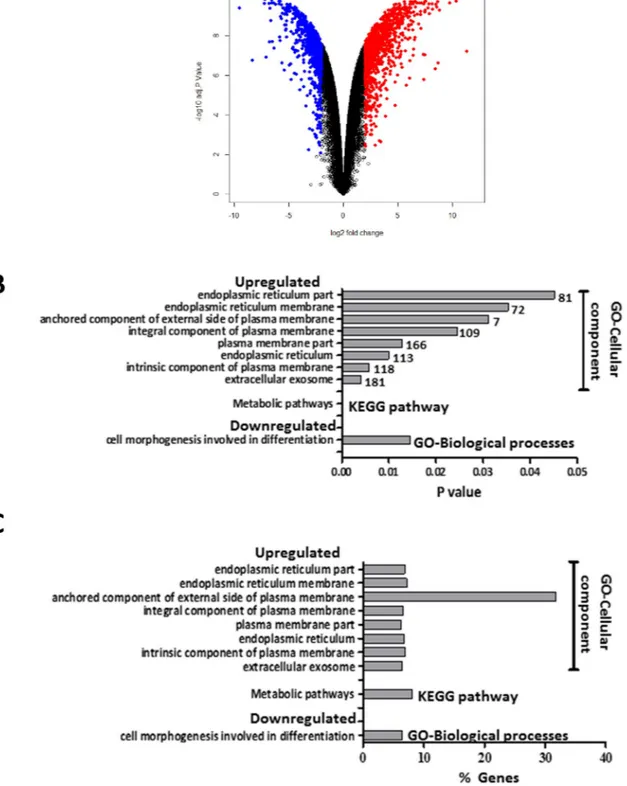
A total of 58,201 genes were successfully evaluated in both cell lines. Overall, 2071 (3.6%) out of 58,201 genes were differentially expressed (logFC > 2, p-adj < 0.01) in DHSF-BR16 cells com-pared with MCF-7 cells (Supplementary Table S2). In particular, 1214 genes were upregulated and 857 genes downregulated in DHSF-BR16 cells compared with MCF-7 cells. The magnitude of fold changes (in log2 scale) was within − 9.6 to + 12.13 (Fig. 5). Interestingly, among DEGs, a relevant number of genes involved in oxida-tive metabolism (e.g. GSTP1, CYP4Z1, AKR1B10) and in different pathways affecting breast cancer behavior (WNT5A), was observed.Functional enrichment analysis of DEGs.
DEGs between DHSF-BR16 and MCF-7 cells were subjected to KEGG pathways and GO terms functional enrichment (Supplementary Table S2, Fig. 5B,C). KEGG pathway analysis revealed metabolic pathway (hsa: 01100) as the most significant pathway among genes upregulated in DHSF-BR16 cells whereas no pathway with significant functional terms was observed among downregu-lated DHSF-BR16 genes. GO analyses of the DEGs showed that cell morphogenesis involved in differentiation (GO:0000904) was the most enriched biological process term overrepresented among genes downregulated in DHSF-BR16. Among genes upregulated in DHSF-BR16, no enriched biological process term reached statisti-cal significance. Among genes upregulated in DHSF-BR16, extracellular exosome (GO:0070062) was the most enriched term under cellular components followed by intrinsic component of plasma membrane (GO:0031226), plasma membrane part (GO:0044459), endoplasmic reticulum (GO:0005783), integral component of plasma membrane (GO:0005887), endoplasmic reticulum membrane (GO:0005789), anchored component of external side of plasma membrane (GO:0031362), endoplasmic reticulum part (GO:0044432). Among genes downregu-lated in DHSF-BR16, no enriched cellular component term reached statistical significance. Finally, no molecular function term reached statistical significance either among down- or up-regulated genes in DHSF-BR16.Quantitative real‑time PCR of candidate genes.
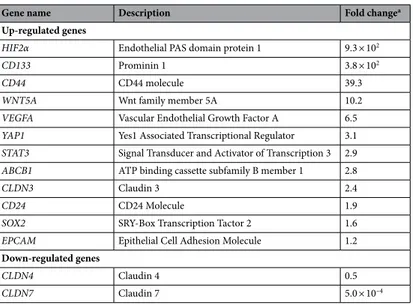
Among 38 candidate genes, selected according to their biological role in cancer initiation and progression, a total 14 genes were found to be differentially expressed between DHSF-BR16 and MCF-7 cell lines (Table 1, Supplementary Fig. S4). In particular, 12 genes were significantly up-regulated in DHSF-BR16 cells compared with MCF-7 cells, and 2 down-regulated. Up-regulated genes were CD133 (p < 0.0001) that belong to the embryonic stem cell proliferation pathway, EpCAM (p < 0.0001), CD44 (p = 0.0362) and CLDN3 (p < 0.0001) that belong to the cell–cell adhesion and junction pathways, SOX2 (p < 0.0001), YAP1 (p < 0.0001), STAT3 (p < 0.0001), and HIF2α (p < 0.0001) that belong to the transcriptional regulatory pathway, CD24 involved in the pathway of modulation-growing and differentia-tion of B cells (p < 0.0001), VEGFA that is associated to the epithelial-mesenchymal transidifferentia-tion (EMT) pathway (p = 0.0034), WNT5A that belongs to the differentiation pathway (p = 0.0002), and ABCB1 that belongs to the ABC transporter pathway (p = 0.0006). CLDN4 and CLDN7 both involved in the cell–cell adhesion and junction pathways were instead found to be down-regulated in DHSF-BR16 cells (p < 0.0001 for both genes).Sensitivity to anticancer drugs.
Since the primary tumor underwent standard neoadjuvant chemother-apy based on anthracyclines and taxanes, sensitivity/resistance of DHSF-BR16 cells to a panel of cytotoxic drugs commonly used in the treatment of breast cancer (i.e. doxorubicin, epirubicin, paclitaxel and docetaxel) was evaluated and compared with that of MCF-7 cells.Figure 2. ROS generation in DHSF-BR16 and MCF-7 cells. In the presence of ROS, DCFH-DA is converted
to a fluorescent compound. (A) Fluorescence curves are representative of three experiments. (B) Fluorescence Ratio between mean fluorescence intensity (MFI) of DCFH-DA-treated cells and negative samples. The results are presented as mean ± SE of three replicates. *p < 0.0001.
Preliminary tests with different cell densities indicated a variability in IC50 values when cell density exceeds
15,000 cells/well, and therefore this latter cell density was selected to perform cytotoxicity studies (Supplementary Fig. S5). Cytotoxicity curves are shown in Supplementary Fig. S6.
Results reported in Table 2 show that both cell lines are more sensitive to epirubicin than doxorubicin, although DHSF-BR16 cells were more resistant to doxorubicin and epirubicin, compared with MCF-7 (RI values 3.8 and 1.5, respectively). Both cell lines were highly sensitive to taxanes mainly to paclitaxel although DHSF-BR16 cells were more sensitive than MCF-7 cells (RI 0.34 for docetaxel and 0.31 for paclitaxel).
Discussion
We reported the establishment and characterization of a novel breast cancer cell line, named DHSF-BR16, derived from an ER−/PR−/HER2+ primary invasive ductal breast carcinoma of a female patient, still alive and
disease-free 5 years from adjuvant chemotherapy. The above clinical molecular profile was maintained in the developed tumor cell line.
We were particularly interested in investigating the biological characteristics of the developed cell line. For this purpose and supported by highly informative studies24,25, we used the well known in vitro model MCF-7 as
comparator. In fact, we exploited the opposite phenotypic setting of MCF-7 cells compared with the DHSF-BR16 cells to highlight the biological and molecular differences between the two tumor cell lines.
Results showed that the main phenotypic characteristic of this tumor model was the spontaneous cell immor-talization, together with other relevant features such as the observed high oxidative stress, and the stemness profile. Furthermore, we examined the sensitivity/resistance of DHSF-BR16 cells to anticancer drugs and the gene-expression pattern by transcriptome analysis, to better highlight some crucial molecular features of this new in vitro tumor model.
Cell immortalization is a long-standing recognized hallmark of cancer26. The spontaneous immortalization is
a quite rare event since primary cultures, after a few duplication cycles, commonly lose their replicative capability. In agreement with telomerase reactivation, an important prerequisite for achieving immortalization, we found a higher expression of h-TERT mRNA levels in DHSF-BR16 cells compared to primary tumor and normal tissues. Interestingly, the expression of h-TERT in DHSF-BR16 cells was comparable to that of the stabilized MCF-7 cells. Telomerase enzyme can be partially responsible for the observed cancer cell survival, due to its important role not only in telomere elongation but also in functions related to key genes involved in proliferation, apoptosis, DNA damage response27, and differentiation28.
The DHSF-BR16 spontaneous immortalization signature was mainly represented by genes of the extracellular exosomes pathway, plasma membrane and endoplasmic reticulum membrane pathways, according to the GO database as well as by those related to metabolic pathways according to the KEGG database.
A peculiar feature observed in DHSF-BR16 cells was represented by a very high basal oxidative stress, despite a low cell death. In fact, the high levels of oxidative stress in DHSF-BR16 cell line did not confer a high sensi-tivity to anthracyclines compared with the MCF-7 cell line, that did not display the same ROS levels. We can hypothesize that the high level of oxidative stress observed in DHSF-BR16 cells may be partially due to the neoadjuvant treatment received by the patient, based on anthracyclines and trastuzumab29: such treatment
could have selected tumor cells resistant to the oxidative stress. In addition, based on results of Indran et al.30,
the h-TERT overexpression could have potentiated the anti-oxidant defense systems, enabling cells to elude death stimuli. The remarkable ROS production in DHSF-BR16 cells could be related to the presence of many elongated mitochondria, sometimes very large, detected by electron microscope examination. Furthermore, since the overexpression of h-TERT and the oxidative stress increase cancer stem cell subpopulation (CSC)31, and
CSC subpopulation is identified by CD13332 and CD44+/CD24− phenotype, it is notable that DHSF-BR16 cells
showed an up-regulation of CD133 and a CD44+/CD24−/low mixed phenotype, confirming the stemness profile.
In addition, from a pathophysiological point of view it is accepted that ROS impact the cellular energy metabolism by regulating key metabolic enzymes as well as metabolic pathways (e.g. glycolysis, pentose phos-phate pathway, tricarboxylic acid cycle)33.
In keeping with this, our functional enrichment analysis of DEGs between DHSF-BR16 and MCF-7 cells evidenced a statistically significant difference related to genes involved in metabolic pathways (KEGG pathway
Figure 3. Fluorescent immunocytochemistry and FACS analysis of cell-surface markers, CD44 and CD24
in DHSF-BR16 and MCF-7 cells. (A) Immunocytoenzymatic (a,c,e) and immunocytofluorescence (b,d,f) analyses of ER, PR, and HER2 receptors expression in DHSF-BR16 and MCF-7 cells, respectively. Analyses were performed on cytospins with the following anti-human Abs: estrogen receptor (ER) (rabbit, clone SP1); progesterone receptor (PR) (rabbit, clone 1E2); HER2 (rabbit, clone 4B5) (original × 400 magnification); (B) Analyses were performed on cytospins fixed in cold acetone and with the following anti-human Abs: CK7 (rabbit, clone SP52); CK5/6 (mouse, clone D5/16B4). Other primary human Abs tested are: CK8 (mouse, clone N1C1), CK18 (mouse, clone N2C2), EpCAM (mouse, clone N3C3) and E-Cadh. Nuclei were labeled with DAPI nuclear stain. (original 400 × magnification); (C) the immunofluorescence signal quantification was performed using FIJI software; for each antibody, the fluorescence ratio based on the DHSF-BR16 and MCF-7 fluorescence value was calculated. (D) Flow cytometric representative plots of receptor profile (CD44/CD24) expression measured in DHSF-BR16 and MCF-7 cultured in adherent conditions. The percentages refer to the sample stained with Abs (red) and overlayed on the negative sample (black); (E) proportion of cancer stem cells with CD44+/CD24− profile; results are the means ± SD of at least 3 experiments. An anti-CD24 (PE conjugate, clone
SN3) and an anti-CD44 (APC conjugate, clone IM7) were used.
analysis). In particular, genes involved in metabolic pathways were upregulated in DHSF-BR16 cells compared with MCF-7 cells.
Overall, these findings suggest that favorable in vitro growth conditions contributed to activate the phenotype of spontaneous immortalization.
Recently, in MCF-7 and MDA-MB231 cells, it has been shown that CD44 expression is closely related to the hypoxia-inducible factor-2α (HIF-2α), suggesting an important role of HIF-2α in maintaining stemness34.
This transcript is highly upregulated in our cell model, according to both transcriptome and RT-qPCR analyses. Interestingly, Bai et al.34 also investigated the effects of HIF-2α silencing on the formation of mammospheres in
MDA-MB231 cells, confirming its role in the efficiency of mammosphere formation. These data contribute to further highlight the stem traits of DHSF-BR16 cells, due to their ability to form mammospheres and to migrate, although through a different fashion, from MCF-7 cells. The non-radial and multi-layered modality of migra-tion could be accounted for by signaling pathways that regulate various forms of movement, involved in tumor metastasis35. The invasion test results in DHSF-BR16 cells showed that latent and activated MMP9 isoforms were
higher than those of MCF-7 cells. MMP9 has been demonstrated to correlate with more aggressive subtypes of breast cancer36 and to modulate metastatic cascade and immune response in the same tumor37. These findings
suggest, as expected from a theoretical point of view, that the phenotype of the developed tumor cell model might be more aggressive than MCF-7 cells. However, these aspects warrant further investigation.
The immunofluorescence analysis highlighted the absence of CK5/6, thus further confirming that new cell model does not represent the basal-subtype, whereas the high expression of CK7 has been associated with
Figure 4. Migration and MMPs activities. Representative brightfield images of DHSF-BR16 and MCF-7
spheroid migration process, at T0, T72 and T144 h (intermediate time images not shown). (A) The graph shows
the evaluation means of the spheroid diameters at the selected times. Data are the mean ± ES of at least three measurements. Images were obtained by using an inverted Leitz microscope , equipped with a 6MP Digital camera (CCD vision sensor, square pixels of 4.4 μm side length, 1600 × 1200 pixel resolution, 8-bit grey level) ). In (B) (MMP2) and (C) (MMP9), isoforms under basal conditions and FBS stimulation.
Figure 5. Volcano-plot of differentially expressed genes (DEGs) between DHSF-BR16 and MCF-7 cells. (A)
DEGs were retrieved by combining linear models with empirical Bayes analysis. Modified t test raw p values were adjusted for multiple testing by using Benjamini–Hochberg procedure. Red dots and blue dots represent upregulated and downregulated DEGs, respectively. Black dots, no differential expression. Based on logFC > 2 and p-adj < 0.01, a total of 1214 upregulated and 857 downregulated genes were identified. The magnitude of fold changes (log2 scale) was within − 9.6 to + 12.13. (B) Number of genes included in the significantly upregulated or downregulated pathways, based on the GO and KEGG enrichment analysis. Grey bars indicate the magnitude of statistical significance. Numbers at the end of grey bars represent the number of genes for each pathway. (C) Percentages of genes included in the significantly upregulated or downregulated enriched pathways on the total of genes included in each pathway.
HER2+38. As far as CK8 and CK18 expression is concerned, it has been demonstrated that the lack of CK8
and CK18 expression is responsible for highly invasive and dedifferentiated phenotype39. Therefore, our cell
model, showing a very low expression of CK8 and CK18 compared to MCF-7 cells, could gain a more aggres-sive phenotype.
Another marker of notable value in the breast cancer prognosis is EpCAM, although literature data are still controversial40. In order to better understand the correlation HER2+/EpCAM, the HER2+ breast cancer
DHSF-BR16 cells endowed by a moderate expression of EpCAM, may represent a suitable in vitro tumor model. Transcriptome analysis identified 2071 DEGs between DHSF-BR16 and MCF-7 cells. Among such genes, in consideration of the above discussed DHSF-BR16 cell characteristics, we focused our attention on a few of them, among the upregulated ones, in order to provide some potential suggestions for exploiting this new tumor model. In particular, we referred to GSTP1 and AKR1B10 (GO:0070062 extracellular exosome), CYPAZ1 and WNT5A (GO:0005783 endoplasmic reticulum), that are involved in relevant metabolic or detoxification pathways.
Although the role of GSTP1 in predicting prognosis and chemoresistance in breast cancer patients has long been recognized, more recently high levels of GSTP1 have been reported in exosomes of patients treated with neoadjuvant chemotherapy based on anthracyclines and taxanes41. Interestingly, the levels of GSTP1 in exosomes
from patients with progressive or stable disease were significantly higher than those in patients who obtained an objective response. Thus, GSTP1-containing exosomes could represent a potential biomarker predictive of response to standard neoadjuvant chemotherapy, in addition to other upregulated genes in exosomes42.
As known, the P450 cytochrome protein CYP4Z1 is preferentially expressed in breast cancer43. Furthermore,
increased CYP4Z1 expression promotes growth and tumor angiogenesis in breast cancer44 by increasing mRNA
expression and producing VEGFA, a known factor highly expressed in breast cancers. Interestingly, CYP4Z1 was found to be highly upregulated in DHSF-BR16 cells compared with MCF-7 cells.
We evaluated sensitivity/resistance of DHSF-BR16 cells to cytotoxic drugs used to pre-operatively treat the primary tumor from which the cell line was derived. In comparison with MCF-7 cell line, sensitive to the DNA
Table 1. Significant fold change variation of mRNA expression of candidate genes between DHSF-BR16 cells
and MCF-7 cells. Data obtained by RT-qPCR analysis. a t test, p < 0.05.
Gene name Description Fold changea
Up-regulated genes
HIF2α Endothelial PAS domain protein 1 9.3 × 10²
CD133 Prominin 1 3.8 × 10²
CD44 CD44 molecule 39.3
WNT5A Wnt family member 5A 10.2
VEGFA Vascular Endothelial Growth Factor A 6.5
YAP1 Yes1 Associated Transcriptional Regulator 3.1
STAT3 Signal Transducer and Activator of Transcription 3 2.9
ABCB1 ATP binding cassette subfamily B member 1 2.8
CLDN3 Claudin 3 2.4
CD24 CD24 Molecule 1.9
SOX2 SRY-Box Transcription Tactor 2 1.6
EPCAM Epithelial Cell Adhesion Molecule 1.2
Down-regulated genes
CLDN4 Claudin 4 0.5
CLDN7 Claudin 7 5.0 × 10⁻⁴
Table 2. IC50 values of anticancer drugs tested on DHSF-BR16 cell line compared to the breast cancer cell
line MCF-7. a The IC
50 values are the mean ± ES of at least three experiments conducted in quadruplicate. p
calculated as t test; NS, Not Significant.
Drugs
Cell lines (IC50 nM)a
DHSF-BR16 MCF7 RI Doxorubicin 490 ± 120 130 ± 1.7 3.80 p < 0.01 Epirubicin 34 ± 5.6 23 ± 1.2 1.50 NS Docetaxel 2.0 ± 0.2 5.9 ± 1.2 0.34 p < 0.01 Paclitaxel 0.16 ± 0.018 0.52 ± 0.014 0.31 p < 0.01
damaging antibiotics such as anthracyclines45, DHSF-BR16 cells were, as mentioned above, more resistant to
anthracyclines (although mainly to doxorubicin than to epirubicin), included in the neoadjuvant treatment administered to the patient. Several innate or acquired mechanisms of tumor resistance toward anthracyclines have been described mainly in in vitro studies. Some of them involve alterations in anthracycline metabolic enzymes: the main example is probably represented by ABCB1 overexpression. Results showed that the higher levels of ABCB1 mRNA, detected by RT-qPCR, observed in the DHSF-BR16 cell line compared with MCF-7 cells, could have contributed to the lower sensitivity of DHSF-BR16 cells to the tested anthracyclines.
A further example is represented by AKR1B10, encoding an aldose reductase involved in the reduction of biogenic and xenobiotic aldehydes and whose altered expression has been reported in doxorubicin resistant breast cancer cells46. Both DHSF-BR16 and MCF-7 cells were sensitive to taxanes being our cell model about threefold
more sensitive than MCF-7. Interestingly, Rodrigues-Ferreira et al.47 reported that the aneuploidy significantly
enhanced sensitivity to paclitaxel in human tumor cell lines. We could therefore hypothesize that the substan-tial taxanes sensitivity of DHSF-BR16 cells may be due to the high percentage of aneuploidy, nevertheless their reduced modal number of chromosomes rather than MCF-7 cells10.
Finally, WNT5A, a non-classical member of the WNT gene family, was highly upregulated in DSHF-BR16 cells. Prasad et al.48 reported that WNT5A is involved in several signaling pathways, among which the most
important is related to breast cancer cell migration and invasion. Due to the high levels of WNT5A in DHSF-BR16 cell line, it may represent a relevant tumor model for an in-depth study of the WNT5A signaling.
Other genes involved in transcriptional regulation (i.e. SOX2, YAP1 and STAT3), in angiogenesis (i.e. VEGFA) or in signal transduction (CLDN3) were found to be overexpressed in DHSF-BR16 cells compared with MCF-7 by RT-qPCR. These genes possess features that well contribute to the definition of specific characteristics of DHSF-BR16 cells. It has been recently demonstrated that SOX2, a transcription factor essential for the main-tenance of proliferation and self-renewal of cancer stem cells, is related to breast cancer initiation49. YAP1, the
core protein of the Hippo signaling pathway, has been associated with malignancy and immunosuppression. Its transcription has been recently reported to be enhanced by a novel lncRNA, RP11-323N12.550. Furthermore, YAP1 plays an important role in the active inhibition of Wnt/β-catenin signaling and is essential for
downregu-lation of β-catenin nuclear activity51. STAT3 has been suggested as a pro-survival factor in breast cancer and in
several breast cancer cell lines52 and to promote tumorigenesis through the regulation of the expression of
vari-ous target genes, including cell-cycle regulators, angiogenic factors and anti-apoptotic genes53. Some claudins,
including CLDN3, are considered to play an important role in the EMT and to affect the chemosensitivity of invasive breast cancer cells54.
The described above genes possess molecular and functional characteristics of wide interest among research-ers involved in the study of breast cancer biology. Of course, this cell model may offer the possibility of defining additional molecular mechanisms in which other differentially expressed genes compared with MCF-7 cell line, could be involved. This would increase the knowledge on this very heterogeneous disease, for instance by allow-ing the identification of new pharmacogenomic biomarkers.
In conclusion, in this work we prompted a cell line based on a quite rare event, that is the spontaneous immortalization. We reported a concise description of DHSF-BR16 cells that retained the phenotype charac-teristics of the primary tumor, and that are characterized by a high oxidative metabolism and a high stemness with the ability to form multicellular spheroids. Thus, the DHSF-BR16 cell line provides a good model to study the mechanisms responsible for the CSC quiescence/self-renew and to develop CSC-specific therapeutic targets, overcoming the tumor relapse.
Received: 16 November 2020; Accepted: 10 March 2021
References
1. Bray, F. et al. Global cancer statistics 2018: GLOBOCAN estimates of incidence and mortality worldwide for 36 cancers in 185 countries [published correction appears in CA Cancer J Clin; 70, 313(2020)]. CA Cancer J. Clin. 68, 394–424 (2018).
2. Koboldt, D. C. et al. Comprehensive molecular portraits of human breast tumours. Nature 490, 61–70 (2012). 3. NCCN Clinical Practice Guidelines in Oncology (NCCN Guidelines)—Breast Cancer V 5.2020; 2020.
4. Gutierrez, C. & Schiff, R. HER2: biology, detection, and clinical implications. Arch. Pathol. Lab. Med. 135, 55–62 (2011). 5. Green, A. R. et al. Identification of key clinical phenotypes of breast cancer using a reduced panel of protein biomarkers. Br. J.
Cancer 109, 1886–1894 (2013).
6. Mirabelli, P., Coppola, L. & Salvatore, M. Cancer cell lines are useful model systems for medical research. Cancers 11, 1098–1115 (2019).
7. Dai, X., Cheng, H., Bai, Z. & Li, J. Breast cancer cell line classification and its relevance with breast tumor subtyping. J. Cancer 8, 3131–3141 (2017).
8. Stathis, A., Siu, L. L. & Le Tourneau, C. Chapter 1 Preclinical Drug Development: translating basic research into clinical work. In
ESMO Handbook of Clinical Pharmacology of Anti-Cancer Agents (eds Sessa, C. et al.) 1–8 (ESMO, 2012).
9. Cailleau, R., Olivé, M. & Cruciger, Q. V. Long-term human breast carcinoma cell lines of metastatic origin: Preliminary charac-terization. Vitro 14, 911–915 (1978).
10. Soule, H. D., Vazguez, J., Long, A., Albert, S. & Brennan, M. A human cell line from a pleural effusion derived from a breast car-cinoma. J. Natl. Cancer Inst. 51, 1409–1416 (1973).
11. Gudjonsson, T., Villadsen, R., Rønnov-Jessen, L. & Petersen, O. W. Immortalization protocols used in cell culture models of human breast morphogenesis. Cell Mol. Life Sci. 61, 2523–2534 (2004).
12. Novelli, M. et al. Collagenase digestion and mechanical disaggregation as a method to extract and immunophenotype tumour lymphocytes in cutaneous T-cell lymphomas. Clin. Exp. Dermatol. 25, 423–431 (2000).
13. Halaban, R. & Alfano, F. D. Selective elimination of fibroblasts from cultures of normal human melanocytes. Vitro 20, 447–450 (1984).
15. Cini, G., Coronnello, M., Mini, E. & Neri, B. Melatonin’s growth-inhibitory effect on hepatoma AH 130 in the rat. Cancer Lett.
125, 51–59 (1998).
16. Ross, J. S. et al. DNA ploidy and cell cycle analysis in breast cancer. Am. J. Clin. Pathol. 120, S72-84 (2003).
17. Coronnello, M. et al. Cytotoxic activity of 3-nitropyrazolo[5,1-c][1,2,4]benzotriazine derivatives: A new series of anti-proliferative agents. Anticancer Drugs 16, 645–651 (2005).
18. Hahn, H. J., Kim, K. B., An, I.-S., Ahn, K. J. & Han, H. J. Protective effects of rosmarinic acid against hydrogen peroxide-induced cellular senescence and the inflammatory response in normal human dermal fibroblasts. Mol. Med. Rep. 16, 9763–9769 (2017). 19. Nakakoshi, M., Nishioka, H. & Katayama, E. New versatile staining reagents for biological transmission electron microscopy that
substitute for uranyl acetate. J. Electron Microsc. 60, 401–407 (2011).
20. Di Gennaro, P. et al. CD4+FOXP3+ T regulatory cells decrease and CD3+CD8+ T cells recruitment in TILs from melanoma
metas-tases after electrochemotherapy. Clin. Exp. Metastasis 33, 787–798 (2016).
21. Wolff, A. C. et al. Human epidermal growth factor receptor 2 testing in breast cancer: American Society of Clinical Oncology/ College of American Pathologists Clinical Practice Guideline Focused Update. J. Clin. Oncol. 36, 2105–2124 (2018).
22. Vinci, M. et al. Advances in establishment and analysis of three dimensional tumor spheroid-based functional assays for target validation and drug evaluation. BMC Biol. 10, 29–49 (2012).
23. Paccosi, S., Musilli, C., Mangano, G., Guglielmotti, A. & Parenti, A. The monocyte chemotactic protein synthesis inhibitor bindarit prevents mesangial cell proliferation and extracellular matrix remodeling. Pharmacol. Res. 66, 526–535 (2012).
24. Neve, R. M. et al. A collection of breast cancer cell lines for the study of functionally distinct cancer subtypes. Cancer Cell 10, 515–527 (2006).
25. Saunus, J. M. et al. Multidimensional phenotyping of breast cancer cell lines to guide preclinical research. Breast Cancer Res. Treat.
167, 289–301 (2018).
26. Hanahan, D. & Weinberg, R. A. The hallmarks of cancer. Cell 100, 57–70 (2000).
27. Guterres, A. N. & Villanueva, J. Targeting telomerase for cancer therapy. Oncogene 39, 5811–5824 (2020).
28. Wang, J. et al. Human telomerase reverse transcriptase immortalizes bovine lens epithelial cells and suppresses differentiation through regulation of the ERK Signaling Pathway. J. Biol. Chem. 280, 22776–22787 (2005).
29. Brown, S. A., Sandhu, N. & Herrmann, J. Systems biology approaches to adverse drug effects: The example of cardio-oncology.
Nat. Rev. Clin. Oncol. 12, 718–731 (2015).
30. Indran, I. R., Hande, M. P. & Pervaiz, S. hTERT overexpression alleviates intracellular ROS production, improves mitochondrial function, and inhibits ROS-mediated apoptosis in cancer cells. Cancer Res. 71, 266–276 (2011).
31. Gopal, K. et al. Oxidative stress induces the acquisition of cancer stem-like phenotype in breast cancer detectable by using a Sox2 regulatory region-2 (SRR2) reporter. Oncotarget 7, 3111–3127 (2016).
32. Barzaman, K. et al. Breast cancer: Biology, biomarkers, and treatments. Int. Immunopharmacol. 84, 106535–106545 (2020). 33. Galadari, S., Rahman, A., Pallichankandy, S. & Thayyullathil, F. Reactive oxygen species and cancer paradox: To promote or to
suppress?. Free Radic. Biol. Med 104, 144–164 (2017).
34. Bai, J. et al. HIF-2α regulates CD44 to promote cancer stem cell activation in triple-negative breast cancer via PI3K/AKT/mTOR signaling. World J. Stem Cells 12, 87–99 (2020).
35. Gerashchenko, T. S. et al. Markers of cancer cell invasion: Are they good enough?. J. Clin. Med. 8, 1092–1110 (2019).
36. Yousef, E. M., Tahir, M. R., St-Pierre, Y. & Gaboury, L. A. MMP-9 expression varies according to molecular subtypes of breast cancer. BMC Cancer 14, 609 (2014).
37. Owyong, M. et al. MMP9 modulates the metastatic cascade and immune landscape for breast cancer anti-metastatic therapy. Life
Sci. Alliance 2, e201800226 (2019).
38. Shao, M.-M. et al. Keratin expression in breast cancers. Virchows Arch. 461, 313–322 (2012).
39. Iyer, S. V. et al. Understanding the role of keratins 8 and 18 in neoplastic potential of breast cancer derived cell lines. PLoS ONE 8, e53532 (2013).
40. Soysal, S. D. et al. EpCAM expression varies significantly and is differentially associated with prognosis in the luminal B HER2(+), basal-like, and HER2 intrinsic subtypes of breast cancer. Br. J. Cancer 108, 1480–1487 (2013).
41. Yang, S. J. et al. Predictive role of GSTP1-containing exosomes in chemotherapy-resistant breast cancer. Gene 623, 5–14 (2017). 42. Wang, M. et al. Effect of exosome biomarkers for diagnosis and prognosis of breast cancer patients. Clin. Transl. Oncol. 20, 906–911
(2018).
43. Rieger, M. A. et al. Identification of a novel mammary-restricted cytochrome P450, CYP4Z1, with overexpression in breast carci-noma. Cancer Res. 64, 2357–2364 (2004).
44. Yu, W. et al. Increased expression of CYP4Z1 promotes tumor angiogenesis and growth in human breast cancer. Toxicol. Appl.
Pharmacol. 264, 73–83 (2012).
45. Zhang, Y. et al. miR-135b-5p enhances doxorubicin-sensitivity of breast cancer cells through targeting anterior gradient 2. J. Exp.
Clin. Cancer Res. 38, 26–39 (2019).
46. Barski, O. A., Tipparaju, S. M. & Bhatnagar, A. The aldo-keto reductase superfamily and its role in drug metabolism and detoxifica-tion. Drug Metab. Rev. 40, 553–624 (2008).
47. Rodrigues-Ferreira, S. et al. Improving breast cancer sensitivity to paclitaxel by increasing aneuploidy. Proc. Natl. Acad. Sci. USA
PNAS 116, 23691–23697 (2019).
48. Prasad, C. P., Manchanda, M., Mohapatra, P. & Andersson, T. WNT5A as a therapeutic target in breast cancer. Cancer Metastasis
Rev. 37, 767–778 (2018).
49. Liang, S. et al. NONO is a negative regulator of SOX2 promoter. Cancer Genomics Proteomics 17, 359–367 (2020).
50. Wang, J. et al. RP11-323N12.5 promotes the malignancy and immunosuppression of human gastric cancer by increasing YAP1 transcription. Gastric Cancer 24, 85–102 (2021).
51. Lu, Q. et al. Yap1 is required for maintenance of adult RPE differentiation. FASEB J. 34, 6757–6768 (2020).
52. Hughes, K. & Watson, C. J. The multifaceted role of STAT3 in mammary gland involution and breast cancer. Int. J. Mol. Sci. 19, 1695–1709 (2018).
53. Wake, M. S. & Watson, C. J. STAT3 the oncogene—still eluding therapy?. FEBS J. 282, 2600–2611 (2015).
54. Skálová, H. et al. Impact of chemotherapy on the expression of claudins and cadherins in invasive breast cancer. Exp. Ther. Med.
18, 3014–3024 (2019).
Acknowledgements
This study is dedicated to the memory of Marcella Berarducci. We are very grateful to Dott.ssa G. Baroni for the immunoenzymatic analysis, to Dott.ssa L. Maggi for providing the cytometer and to Dott.ssa. E. Lisi for the karyotype.
Author contributions
M.C. conceived the study, wrote the manuscript draft and interpreted the data. M.C., A.M. and S.N. interpreted the data and wrote and edited the manuscript. A.P. and S.P. performed and analyzed zymography experiments.
C.R. performed and analyzed qRT-PCR experiments. A.L. performed the statistical analysis. G.C. and S.N. pro-cessed the transcriptomic data. P.D.G. performed the immunofluorescence data. V.V. carried out FISH analysis. P.R. performed electronic microscopy slides and interpretations. T.S. selected the tumor block. All authors prepared their own figures and tables, and approved the final version.
Funding
This work was supported from the University of Florence (Fondo Ricerca Ateneo RICATEN15) and Ente Cassa di Risparmio di Firenze (No. 2013/0847), Florence (to M. Coronnello).
Competing interests
The authors declare no competing interests.
Additional information
Supplementary Information The online version contains supplementary material available at https:// doi. org/ 10. 1038/ s41598- 021- 87362-0.
Correspondence and requests for materials should be addressed to M.C. Reprints and permissions information is available at www.nature.com/reprints.
Publisher’s note Springer Nature remains neutral with regard to jurisdictional claims in published maps and
institutional affiliations.
Open Access This article is licensed under a Creative Commons Attribution 4.0 International
License, which permits use, sharing, adaptation, distribution and reproduction in any medium or format, as long as you give appropriate credit to the original author(s) and the source, provide a link to the Creative Commons licence, and indicate if changes were made. The images or other third party material in this article are included in the article’s Creative Commons licence, unless indicated otherwise in a credit line to the material. If material is not included in the article’s Creative Commons licence and your intended use is not permitted by statutory regulation or exceeds the permitted use, you will need to obtain permission directly from the copyright holder. To view a copy of this licence, visit http:// creat iveco mmons. org/ licen ses/ by/4. 0/.