Integrated analysis of concomitant
medications and oncological outcomes
from PD-1/PD- L1 checkpoint inhibitors
in clinical practice
Alessio Cortellini ,1,2 Marco Tucci,3,4 Vincenzo Adamo,5 Luigia Stefania Stucci,3 Alessandro Russo,5 Enrica Teresa Tanda,6 Francesco Spagnolo,6
Francesca Rastelli,7 Renato Bisonni,7 Daniele Santini,8 Marco Russano,8 Cecilia Anesi,8 Raffaele Giusti,9 Marco Filetti,9 Paolo Marchetti,9,10,11 Andrea Botticelli,10 Alain Gelibter,11 Mario Alberto Occhipinti,11
Riccardo Marconcini,12 Maria Giuseppa Vitale,13 Linda Nicolardi,14 Rita Chiari,14 Claudia Bareggi,15 Olga Nigro,16 Alessandro Tuzi,16 Michele De Tursi,17
Nicola Petragnani,18 Laura Pala,19 Sergio Bracarda,20 Serena Macrini,20 Alessandro Inno,21 Federica Zoratto,22 Enzo Veltri,22 Barbara Di Cocco,22 Domenico Mallardo,23 Maria Grazia Vitale,23 David James Pinato ,24 Giampiero Porzio,2 Corrado Ficorella,1,2 Paolo Antonio Ascierto 23
To cite: Cortellini A, Tucci M, Adamo V, et al. Integrated analysis of concomitant medications and oncological outcomes from PD-1/PD- L1 checkpoint inhibitors in clinical practice. Journal for ImmunoTherapy of Cancer 2020;8:e001361. doi:10.1136/ jitc-2020-001361
Accepted 28 August 2020
For numbered affiliations see end of article.
Correspondence to Dr Alessio Cortellini; alessiocortellini@ gmail. com © Author(s) (or their employer(s)) 2020. Re- use permitted under CC BY- NC. No commercial re- use. See rights and permissions. Published by BMJ.
ABSTRACT
Background Concomitant medications, such as steroids,
proton pump inhibitors (PPI) and antibiotics, might affect clinical outcomes with immune checkpoint inhibitors.
Methods We conducted a multicenter observational
retrospective study aimed at evaluating the impact of concomitant medications on clinical outcomes, by weighing their associations with baseline clinical characteristics (including performance status, burden of disease and body mass index) and the underlying causes for their prescription. This analysis included consecutive stage IV patients with cancer, who underwent treatment with single agent antiprogrammed death-1/programmed death ligand-1 (PD-1/PD- L1) with standard doses and schedules at the medical oncology departments of 20 Italian institutions. Each medication taken at the immunotherapy initiation was screened and collected into key categories as follows: corticosteroids, antibiotics, gastric acid suppressants (including proton pump inhibitors - PPIs), statins and other lipid- lowering agents, aspirin, anticoagulants, non- steroidal anti- inflammatory drugs (NSAIDs), ACE inhibitors/Angiotensin II receptor blockers, calcium antagonists, β-blockers, metformin and other oral antidiabetics, opioids.
Results From June 2014 to March 2020, 1012 patients
were included in the analysis. Primary tumors were: non- small cell lung cancer (52.2%), melanoma (26%), renal cell carcinoma (18.3%) and others (3.6%). Baseline statins (HR 1.60 (95% CI 1.14 to 2.25), p=0.0064), aspirin (HR 1.47 (95% CI 1.04 to 2.08, p=0.0267) and β-blockers (HR 1.76 (95% CI 1.16 to 2.69), p=0.0080) were confirmed to be independently related to an increased objective response rate. Patients receiving cancer- related steroids (HR 1.72 (95% CI 1.43 to 2.07), p<0.0001), prophylactic systemic antibiotics (HR 1.85 (95% CI 1.23 to 2.78), p=0.0030),
prophylactic gastric acid suppressants (HR 1.29 (95% CI 1.09 to 1.53), p=0.0021), PPIs (HR 1.26 (95% CI 1.07 to 1.48), p=0.0050), anticoagulants (HR 1.43 (95% CI: 1.16 to 1.77), p=0.0007) and opioids (HR 1.71 (95% CI 1.28 to 2.28), p=0.0002) were confirmed to have a significantly higher risk of disease progression. Patients receiving cancer- related steroids (HR 2.16 (95% CI 1.76 to 2.65), p<0.0001), prophylactic systemic antibiotics (HR 1.93 (95% CI 1.25 to 2.98), p=0.0030), prophylactic gastric acid suppressants (HR 1.29 (95% CI 1.06 to 1.57), p=0.0091), PPI (HR 1.26 (95% CI 1.04 to 1.52), p=0.0172), anticoagulants (HR 1.45 (95% CI 1.14 to 1.84), p=0.0024) and opioids (HR 1.53 (95% CI 1.11 to 2.11), p=0.0098) were confirmed to have a significantly higher risk of death.
Conclusion We confirmed the association between
baseline steroids administered for cancer- related indication, systemic antibiotics, PPIs and worse clinical outcomes with PD-1/PD- L1 checkpoint inhibitors, which can be assumed to have immune- modulating detrimental effects.
INTRODUCTION
Drug–drug interactions (DDIs) have tradi-tionally played an important role in the safe and effective delivery of systemic anticancer therapy.1 Concomitant medications can alter
efficacy and worsen toxicity from systemic ther-apies through pharmacodynamic (PK) and pharmacokinetic (PD) interactions, particu-larly due to interference with absorption, distri-bution, metabolism and elimination of drugs.1
The advent of immune checkpoint inhibitors (ICIs) has reignited the interest toward DDIs beyond traditional PK/PD considerations.2
Protected by copyright.
on May 13, 2021 at Universita degli Studi G.D'Annunzio.
ICIs exert their action mainly relying on the restoration/ activation of T- cell responses against cancer, and therefore, might be altered by those factors which particularly affect the immune balance prior to the ICIs administration, such as disruption of the homeostatic balance within the gut microbiome3 and drug- induced immune suppression.4
Concomitant medications including steroids, proton pump inhibitors and systemic antibiotics have been postu-lated to exert immune- modulatory effects within the tumor microenviroment, thus affecting clinical outcomes from ICI therapy.2
However, while some degree of biological plausibility exists to justify an immune- mediated basis to the detri-mental effect observed on response and survival from ICIs, the strength and reliability of the association has been largely derived from retrospective/post hoc analyzes and the dispute between causative instead of associative relationship has not been fully resolved.2 Given their
immunosuppressive action, steroids were the first class of medications which was significantly related to worse clin-ical outcomes with cancer immunotherapy.5
Neverthe-less, a significant association with worse outcome was later confirmed for baseline steroids administered for pallia-tion of cancer- rleated symptoms but not for other indi-cations including treatment of immune- related adverse events.6 7
In the case of systemic antibiotics, the evidence for a causative effect seems stronger and more plausible in view of their capacity to perturbate the gut microbiome, a renown determinant of response to ICIs.8–10
Neverthe-less, the risk of collinearity with the underlying cause for the antibiotics prescription (eg, infections which might subtend to poorer clinical condition), has yet to be fully discriminated.
Proton pump inhibitors were associated to decreased progression- free survival (PFS) and overall survival (OS) in non- small- cell- lung- cancer (NSCLC) and mela-noma patients receiving programmed death-1 (PD-1)/ programmed death ligand-1 (PD- L1) checkpoint inhib-itors,9 11 while some studies investigated the impact of
other concomitant medication, such as non- steroidal anti- inflammatory drugs (NSAIDs), metformin, aspirin, β-blockers and statins, without conclusive results.12 13
While a growing body of evidence underscores the importance of concomitant medications in affecting outcome from ICI, a key limitation affecting most of the published evidence is the lack of an integrated analysis of multiple classes of concomitant therapies. This is of particular importance to determine whether the influ-ence on clinical outcomes might be driven by associative rather than causative links, especially given the high prev-alence of polypharmacy in patients with cancer.14
Recently, we created a large multicenter, observational study of patients receiving PD-1/PD- L1 checkpoint inhibitors in clinical practice, already subject of several analyzes,15–20 and we now gathered the baseline
concomi-tant medication information for the same population, in order to evaluate their impact on clinical outcomes.
MATERIALS AND METHODS Study design
We conducted a real- world, multicenter, retrospective observational data collection aimed at evaluating the impact of concomitant medications at immunotherapy initiation on clinical outcomes, by weighing their asso-ciations with baseline clinical characteristics (including performance status, burden of disease and body mass index (BMI)) and the underlying indication for steroids, antibiotics and gastric acid suppressants prescription. This study included consecutive patients with confirmed diagnosis of stage IV solid cancer, who underwent treat-ment with single agent anti- PD-1/PD- L1 as first or subse-quent line, with data availability regarding baseline concomitant medication. The data collection was further implemented and updated involving patients treated at the medical oncology departments of 20 Italian institu-tions (online supplemental table 1), between June 2014 and March 2020. Patients were treated according to the tumor type indication with pembrolizumab, nivolumab, atezolizumab and other PD-1/PD- L1 prescribed at doses and schedules indicated in the respective product SPCs.
Clinical outcomes of interest included objective response rate (ORR), PFS and OS. Patients were assessed with radiological imaging in clinical practice, with a frequency ranging from 12 to 16 weeks, according to the monitoring requirements for high- cost drugs of the respective national drug regulatory agencies (the on- line monitoring dashboard of the ‘Agenzia Italiana del Farmaco’ requires a disease assessment at least every 16 weeks; available at: https:// servizionline. aifa. gov. it/). RECIST (V. 1.1) criteria were used21 and a subsequent
confirming imaging was recommended. However, treat-ment beyond disease progression was allowed when clini-cally indicated. ORR was defined as the portion of patients experiencing an objective response (complete or partial response) as best response to immunotherapy. PFS was defined as the time from treatment initiation to disease progression or death, whichever occurred first. OS was defined as the time from treatment initiation to death. For PFS as well as for OS, patients without events were considered as censored at the time of the last follow- up. Data cut- off period was May 2020.
Fixed multivariable regression models were used to estimate clinical outcomes according to each concom-itant medication category following adjustment for preplanned adjusting covariates that might represent confounders.22–24 The key covariates were: primary
tumor type (NSCLC, melanoma, renal cell carcinoma and others), age (<70 vs ≥70 years),25–28 sex (male
vs female), Eastern Cooperative Oncology Group- Performance Status (ECOG- PS) (0–1 vs ≥2), burden of disease (number of metastatic sites≤2 vs >2), treatment line (first vs non- first) and BMI. BMI was used given to its alleged role in affecting immunotherapy clinical outcomes15 16 and as a surrogate of cardiovascular/
metabolic conditions which might have influenced the prescription of certain concomitant medications.
Protected by copyright.
on May 13, 2021 at Universita degli Studi G.D'Annunzio.
Weight and height were obtained from patients’ medical records at the time of immunotherapy initia-tion. BMI was calculated using the formula of weight/ height2 (kilograms per square meter) and categorized according to WHO categories: underweight, BMI <18.5 kg/m2; normal- weight, 18.5 kg/m2≤ BMI ≤24.9 kg/m2; overweight, 25 kg/m2≤ BMI ≤29.9 kg/m2; obese, BMI ≥30 kg/m2. In order to properly weighing the role of baseline concomitant medication, their association with ECOG- PS, burden of disease and with BMI were evaluated.
Concomitant medications
Information on prescribing of concomitant medications was gathered from patients’ clinical records. Each medi-cation prescribed at the time of immunotherapy initia-tion was screened and categorized as follows:
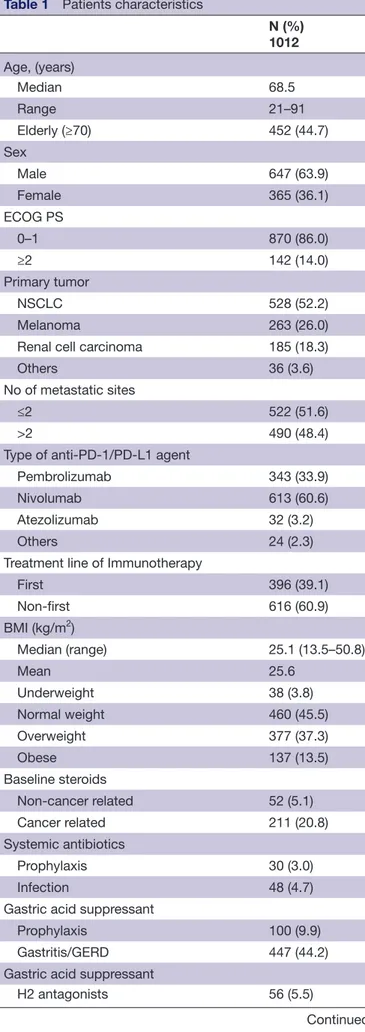
Table 1 Patients characteristics
N (%) 1012 Age, (years) Median 68.5 Range 21–91 Elderly (≥70) 452 (44.7) Sex Male 647 (63.9) Female 365 (36.1) ECOG PS 0–1 870 (86.0) ≥2 142 (14.0) Primary tumor NSCLC 528 (52.2) Melanoma 263 (26.0)
Renal cell carcinoma 185 (18.3)
Others 36 (3.6)
No of metastatic sites
≤2 522 (51.6)
>2 490 (48.4)
Type of anti- PD-1/PD- L1 agent
Pembrolizumab 343 (33.9)
Nivolumab 613 (60.6)
Atezolizumab 32 (3.2)
Others 24 (2.3)
Treatment line of Immunotherapy
First 396 (39.1) Non- first 616 (60.9) BMI (kg/m2) Median (range) 25.1 (13.5–50.8) Mean 25.6 Underweight 38 (3.8) Normal weight 460 (45.5) Overweight 377 (37.3) Obese 137 (13.5) Baseline steroids
Non- cancer related 52 (5.1)
Cancer related 211 (20.8)
Systemic antibiotics
Prophylaxis 30 (3.0)
Infection 48 (4.7)
Gastric acid suppressant
Prophylaxis 100 (9.9)
Gastritis/GERD 447 (44.2)
Gastric acid suppressant
H2 antagonists 56 (5.5)
Continued
N (%) 1012
Proton pump inhibitors 491 (48.5)
Statins
Yes 196 (19.4)
Other lipid lowerings
Yes 48 (4.7) Aspirin Yes 189 (18.7) Anticoagulants Yes 145 (14.3) NSAIDs Yes 59 (5.8) ACE inhibitors/ARBs Yes 313 (30.9) Calcium antagonist Yes 140 (13.8) Beta blockers* Yes 114 (12.1) Metformin Yes 114 (11.3)
Other oral antidiabetics
Yes 46 (4.5)
Opioids†
Yes 68 (7.4)
*Available for 943 patients †Available for 921 patients
ARBs, AngiotensinII receptor blockers; BMI, body mass index; ECOG- PS, Eastern Cooperative Oncology Group- Performance Status; GERD, gastroesophageal reflux disease; NSCLC, non- small cell lung cancer; PD-1/PD- L1, programmed death-1/ programmed death ligand-1.
Table 1 Continued
Protected by copyright.
on May 13, 2021 at Universita degli Studi G.D'Annunzio.
Table 2 Univariate and multivariate analyzes of ORR
Variable (Comparator)
ORR
Univariarte analysis Multivariate analysis
Response/ratio—ORR (%) (95% CI) OR (95% CI); p value aOR (95% CI); p value Baseline steroids
(No) 293/715–41.0 (36.4 to 45.9)
Non- cancer indications 20/50–40.0 (24.4 to 61.7) 0.96 (0.53 to 1.72); p=0.8917 1.18 (0.65 to 2.17); p=0.5836 Cancer indications 48/195–24.6 (18.1 to 32.6) 0.47 (0.32 to 0.67); p<0.0001 0.55 (0.38 to 0.81); p=0.0020 Systemic antibiotics
(No) 340/883–38.5 (34.5 to 42.8)
Prophylaxis 5/29–17.2 (5.6 to 40.2) 0.33 (0.12 to 0.88); p=0.0266 0.39 (0.14 to 1.05); p=0.0631 Infection 16/48–33.3 (19.1 to 54.1) 0.79 (0.43 to 1.48); p=0.4735 0.89 (0.47 to 1.69); p=0.7314 Gastric acid suppressant
(No) 185/446–41.5 (35.7 to 47.9)
Prophylaxis 146/422–34.6 (29.2 to 40.7) 0.74 (0.56 to 0.97); p=0.0342 0.85 (0.64 to 1.14); p=0.3057 Gastritis/GERD 30/92–32.6 (22.0 to 46.5) 0.68 (0.42 to 1.09); p=0.1135 0.75 (0.46 to 1.24); p=0.2750 Gastric acid suppressant
(No) 185/446–41.5 (35.7 to 47.9)
H2 antagonists 19/51–37.3 (22.4 to 58.1) 0.84 (0.46 to 1.53); p=0.5700 1.03 (0.55 to 1.93); p=0.9196 Proton pump inhibitors 157/463–33.9 (28.8 to 39.6) 0.72 (0.55 to 0.95); p=0.0214 0.82 (0.62 to 1.09); p=0.1725 Statins
(No) 275/774–35.5 (31.4 to 39.9) 1.56 (1.13 to 2.15); p=0.0070 1.60 (1.14 to 2.25); p=0.0064
Yes 86/186–46.2 (36.9 to 57.1)
Other lipid lowerings
(No) 345/915–37.7 (33.9 to 41.9) 1.22 (0.66–2.24); p=0.5130 1.11 (0.59 to 2.09); 0.7271 Yes 19/45–42.2 (25.4 to 65.9) Aspirin (No) 281/780–36.0 (31.9 to 40.5) 1.42 (1.02 to 1.97); p=0.0361 1.47 (1.04 to 2.08); 0.0267 Yes 80/180–44.4 (35.2 to 55.3) Anticoagulants (No) 319/826–38.6 (34.5 to 43.1) 0.72 (0.49 to 1.07); p=0.1078 0.79 (0.53 to 1.19); 0.2774 Yes 42/134–31.3 (22.6 to 42.3) NSAIDs (No) 346/905–38.2 (34.3 to 42.4) 0.61 (0.32 to 1.11); p=0.1064 0.64 (0.34 to 1.20); 0.1667 Yes 15/55–27.3 (15.2 to 44.9) ACE inhibitors/ARBs (No) 235/666–35.3 (30.9 to 40.1) 1.37 (1.04 to 1.82); p=0.0258 1.26 (0.93 to 1.71); p=0.1241 Yes 126/294–42.9 (35.7 to 51.0) Calcium antagonist (No) 307/828–37.1 (33.0 to 41.5) 1.17 (0.81 to 1.71); p=0.3990 1.07 (0.72 to 1.59); p=0.7188 Yes 54/132–40.9 (30.7 to 53.4) β-blockers* (No) 293/794–36.9 (32.8 to 41.4) 1.71 (1.14 to 2.56); p=0.0092 1.76 (1.16 to 2.69); p=0.0080 Yes 54/108–50.0 (37.5 to 65.2) Metformin (No) 318/849–37.5 (33.4 to 41.8) 1.06 (0.70 to 1.58); p=0.7930 1.02 (0.67 to 1.56); p=0.9081 Yes 43/111–38.7 (28.0 to 52.2)
Other oral antidiabetics
Continued
Protected by copyright.
on May 13, 2021 at Universita degli Studi G.D'Annunzio.
► Corticosteroids administration (dose ≥10 mg
pred-nisone equivalent per day, with a minimum 24 hours of dosing) within the 30 days before immunotherapy initiation, classified according to their indication as: no (including those patients receiving <10 mg pred-nisone equivalent) versus cancer indications (admin-istration for symptoms palliation, radiation therapy, central nervous system metastases) versus non- cancer indications (eg, other inflammation processes non related to cancer).
► Systemic antibiotics within the 30 days before immu-notherapy initiation, classified according to their indication as: no versus prophylaxis (eg, to prevent COPD exacerbation or diverticulitis prevention) versus infection (in case of a diagnosed infective disease).
► Baseline gastric acid suppressant, classified according to their indication as: no vs gastritis/gastroesoph-ageal reflux disease (GERD) versus prophylaxis (eg, to prevent gastritis due to other concomitant Variable
(Comparator)
ORR
Univariarte analysis Multivariate analysis
Response/ratio—ORR (%) (95% CI) OR (95% CI); p value aOR (95% CI); p value (No) 342/919–37.2 (33.3 to 41.4) 1.45 (0.77 to 2.73); p=0.2402 1.34 (0.69 to 2.8); p=0.3808 Yes 19/41–46.3 (27.9 to 72.3) Opioids† (No) 317/822–38.6 (34.4 to 43.1) 0.75 (0.43 to 1.33); p=0.3325 0.90 (0.49 to 1.63); p=0.7325 Yes 19/59–32.2 (19.4 to 50.3) Primary tumor – (NSCLC) 160/491–32.6 (27.8 to 38.1) Melanoma 114/254–44.9 (37.0 to 53.9) 1.68 (1.23 to 2.29); 0.0010 Kidney 74/180–41.1 (32.3 to 51.6) 1.44 (1.02 to 2.05); 0.0406 Others 13/35–37.1 (19.7 to 63.5) 1.22 (0.60 to 2.49); 0.5799 BMI – (Normal weight) 12/36–33.3 (17.2 to 58.2) Underweight 167/435–38.4 (32.8 to 44.7) 0.83 (0.41 to 1.67); 0.6038 Overweight 128/352–36.3 (30.3 to 43.2) 0.91 (0.68 to 1.22); 0.5226 Obese 54/136–39.7 (29.8 to 51.8) 1.03 (0.69 to 1.53); 0.8709 Gender – (Female) 128/348–36.8 (30.7 to 43.7) 1.06 (0.81 to 1.39); p=0.6638 Male 233/612–38.1 (33.3 to 43.3) Age – (Non- elderly) 190/535–35.5 (30.6 to 40.9) 1.22 (0.94 to 1.59); p=0.1338 Elderly 171/425–40.2 (34.5 to 46.7) Treatment line – (First) 181/373–48.5 (41.7 to 56.1) 0.46 (0.39 to 0.61); p<0.0001 Non- first 180/587–30.7 (26.3 to 35.5) No of metastatic sites – (≤2) 203/503–40.4 (35.0 to 46.3) 0.78 (0.60 to 1.01); p=0.0648 >2 158/457–34.6 (29.4 to 40.4) ECOG PS – (0–1) 322/828–38.9 (34.8 to 43.4) 0.66 (0.44 to 0.98); p=0.0406 ≥2 39/132–29.5 (21.0 to 40.4)
At the multivariate analysis, each drug category was adjusted for the preplanned key covariates separately. *Available for 902 patients.
†Available for 881 patients.
ARBs, AngiotensinII receptor blockers; BMI, body mass index; ECOG- PS, Eastern Cooperative Oncology Group- Performance Status; GERD, gastroesophageal reflux disease; NSCLC, non- small cell lung cancer; ORR, objective response rate.
Table 2 Continued
Protected by copyright.
on May 13, 2021 at Universita degli Studi G.D'Annunzio.
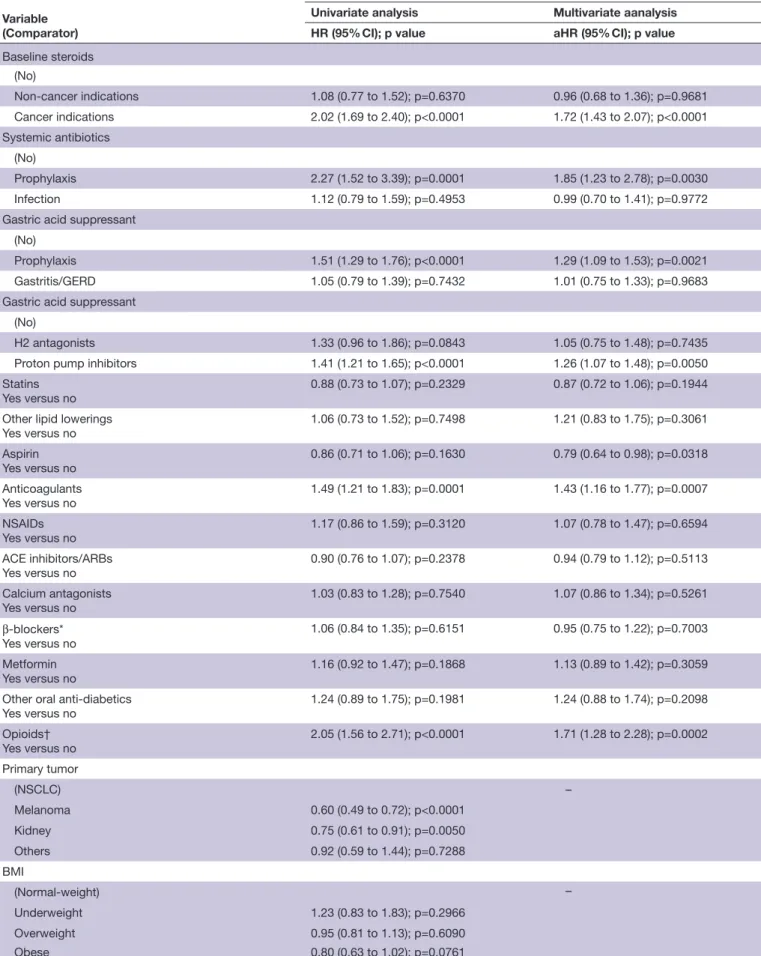
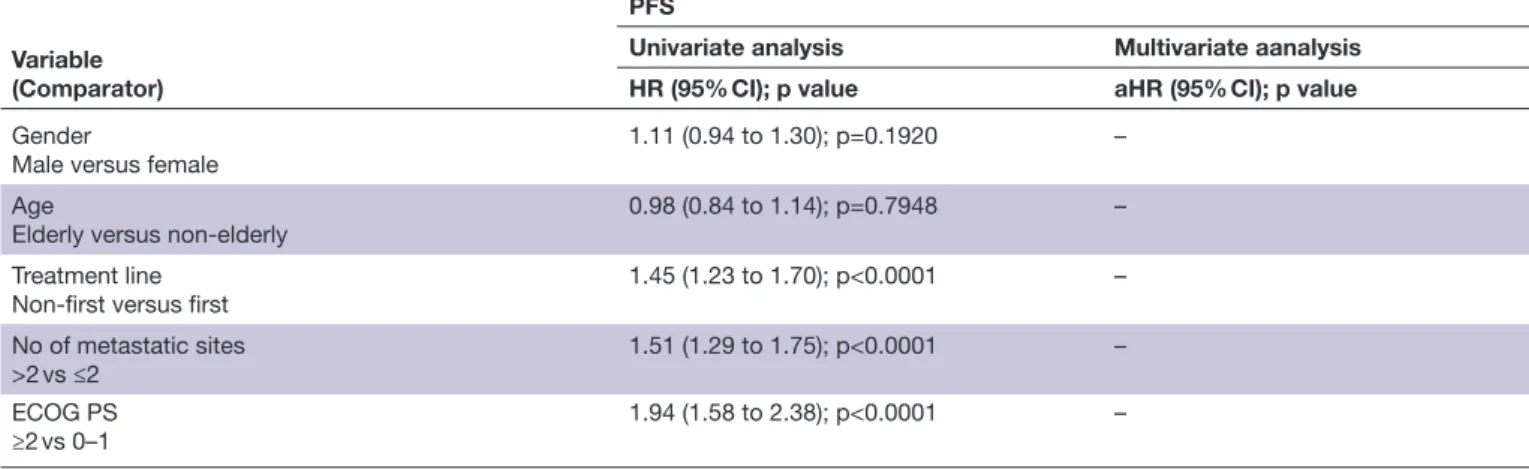
Table 3 Univariate and multivariate analyzes of PFS
Variable (Comparator)
PFS
Univariate analysis Multivariate aanalysis
HR (95% CI); p value aHR (95% CI); p value
Baseline steroids
(No)
Non- cancer indications 1.08 (0.77 to 1.52); p=0.6370 0.96 (0.68 to 1.36); p=0.9681
Cancer indications 2.02 (1.69 to 2.40); p<0.0001 1.72 (1.43 to 2.07); p<0.0001
Systemic antibiotics
(No)
Prophylaxis 2.27 (1.52 to 3.39); p=0.0001 1.85 (1.23 to 2.78); p=0.0030
Infection 1.12 (0.79 to 1.59); p=0.4953 0.99 (0.70 to 1.41); p=0.9772
Gastric acid suppressant
(No)
Prophylaxis 1.51 (1.29 to 1.76); p<0.0001 1.29 (1.09 to 1.53); p=0.0021
Gastritis/GERD 1.05 (0.79 to 1.39); p=0.7432 1.01 (0.75 to 1.33); p=0.9683
Gastric acid suppressant
(No)
H2 antagonists 1.33 (0.96 to 1.86); p=0.0843 1.05 (0.75 to 1.48); p=0.7435
Proton pump inhibitors 1.41 (1.21 to 1.65); p<0.0001 1.26 (1.07 to 1.48); p=0.0050
Statins Yes versus no
0.88 (0.73 to 1.07); p=0.2329 0.87 (0.72 to 1.06); p=0.1944
Other lipid lowerings Yes versus no 1.06 (0.73 to 1.52); p=0.7498 1.21 (0.83 to 1.75); p=0.3061 Aspirin Yes versus no 0.86 (0.71 to 1.06); p=0.1630 0.79 (0.64 to 0.98); p=0.0318 Anticoagulants Yes versus no 1.49 (1.21 to 1.83); p=0.0001 1.43 (1.16 to 1.77); p=0.0007 NSAIDs Yes versus no 1.17 (0.86 to 1.59); p=0.3120 1.07 (0.78 to 1.47); p=0.6594 ACE inhibitors/ARBs Yes versus no 0.90 (0.76 to 1.07); p=0.2378 0.94 (0.79 to 1.12); p=0.5113 Calcium antagonists Yes versus no 1.03 (0.83 to 1.28); p=0.7540 1.07 (0.86 to 1.34); p=0.5261 β-blockers* Yes versus no 1.06 (0.84 to 1.35); p=0.6151 0.95 (0.75 to 1.22); p=0.7003 Metformin Yes versus no 1.16 (0.92 to 1.47); p=0.1868 1.13 (0.89 to 1.42); p=0.3059
Other oral anti- diabetics
Yes versus no 1.24 (0.89 to 1.75); p=0.1981 1.24 (0.88 to 1.74); p=0.2098 Opioids† Yes versus no 2.05 (1.56 to 2.71); p<0.0001 1.71 (1.28 to 2.28); p=0.0002 Primary tumor (NSCLC) – Melanoma 0.60 (0.49 to 0.72); p<0.0001 Kidney 0.75 (0.61 to 0.91); p=0.0050 Others 0.92 (0.59 to 1.44); p=0.7288 BMI (Normal- weight) – Underweight 1.23 (0.83 to 1.83); p=0.2966 Overweight 0.95 (0.81 to 1.13); p=0.6090 Obese 0.80 (0.63 to 1.02); p=0.0761 Continued Protected by copyright.
on May 13, 2021 at Universita degli Studi G.D'Annunzio.
medication); no versus H2 Antagonists (such as raniti-dine) vs proton pump inhibitors.
► Baseline statins (yes vs no).
► Other baseline lipid- lowering agents (fibrates, ezetimibe and similar) (yes vs no).
► Baseline aspirin (considered as low- dose daily assump-tion of aspirin for cardiovascular prevenassump-tion) (yes vs no).
► Baseline anticoagulants (including new oral anticoag-ulants, low molecular weight heparin and cumarinic anticoagulant drugs) (yes vs no).
► NSAIDs within the 30 days before treatment initiation, including COX-2 inhibitors (including both chronic and PRN administration) (yes vs no).
► Baseline ACE inhibitors/angiotensin II receptor blockers (ARBs) (yes vs no), calcium antagonists (yes vs no), β-blockers (yes vs no).
► Baseline metformin (yes vs no) and other oral antidi-abetics (yes vs no).
► Baseline opioids (yes vs no). Statistical analysis
Baseline patient characteristics were reported with descriptive statistics. χ2 test was used for the univariate analysis of ORR. Logistic regression was used for the multivariate analysis of ORR and to compute the ORs with 95% CIs. Median PFS and median OS were evalu-ated using the Kaplan- Meier method. Median period of follow- up was calculated according to the reverse Kaplan- Meier method. Cox proportional hazards regression was used for the univariate analysis, for the fixed multivar-iate analysis of PFS and OS and to compute the HRs for disease progression and death with 95% CIs. The alpha level for all analyzes was set to p<0.05. χ2 test was also used to evaluate the associations between baseline concom-itant medication and ECOG- PS (0–1 vs ≥2), burden of disease (number of metastatic sites≤2 vs>2) and BMI
(underweight, normal- weight, overweight and obese). In order to properly evaluate the role of some baseline medications, a further analysis using the BMI as a contin-uous covariate was performed, through the one- way anal-ysis of variance (ANOVA). All statistical analyzes were performed using MedCalc Statistical Software V.19.3.1 (MedCalc Software, Ostend, Belgium; https://www. medcalc. org; 2020).
RESULTS
Patients’ characteristics
In total, 1012 consecutive advanced cancer patients were evaluated. Patients characteristics are and baseline medication are summarized in table 1. The median age was 68.5 years (range: 21–92), male/female ratio was 647/365. Primary tumors were: NSCLC (52.2%), mela-noma (26%), renal cell carcimela-noma (18.3%) and others (3.6%).
Efficacy analysis
The median follow- up was 24.2 months (95% CI 23.3 to 67.2); in the study population ORR was 37.6% (95% CI 33.8%% to 41.7) (361 responses out of 960 evaluable patients), while median PFS and median OS were 10.2 months (95% CI 9.2 to 11.4; 681 progression events) and 19.7 months (95% CI 17.5 to 24.6; 520 censored patients), respectively. Table 2 reports the univariate and multivariate analyzes of ORR. Compared with patients who did not received baseline steroids, patients receiving them for cancer- related symptoms were confirmed to have a significantly lower ORR compared with patients who did not receive baseline steroids (HR 0.55 (95% CI 0.38 to 0.81), p=0.0020), while not patients who received steroids for non- cancer indications. Also baseline statins (HR 1.60 (95% CI 1.14 to 2.25), p=0.0064), aspirin (HR 1.47 (95% CI 1.04 to 2.08), p=0.0267) and β-blockers (HR Variable
(Comparator)
PFS
Univariate analysis Multivariate aanalysis
HR (95% CI); p value aHR (95% CI); p value
Gender
Male versus female
1.11 (0.94 to 1.30); p=0.1920 –
Age
Elderly versus non- elderly 0.98 (0.84 to 1.14); p=0.7948 –
Treatment line
Non- first versus first 1.45 (1.23 to 1.70); p<0.0001 –
No of metastatic sites
>2 vs ≤2 1.51 (1.29 to 1.75); p<0.0001 –
ECOG PS ≥2 vs 0–1
1.94 (1.58 to 2.38); p<0.0001 –
At the multivariate analysis, each drug category was adjusted for the preplanned key covariates separately. *Available for 943 patients.
†Available for 921 patients.
ARBs, AngiotensinII receptor blockers; BMI, body mass index; ECOG- PS, Eastern Cooperative Oncology Group- Performance Status; GERD, gastroesophageal reflux disease; NSCLC, non- small cell lung cancer; PFS, progression- free survival.
Table 3 Continued
Protected by copyright.
on May 13, 2021 at Universita degli Studi G.D'Annunzio.
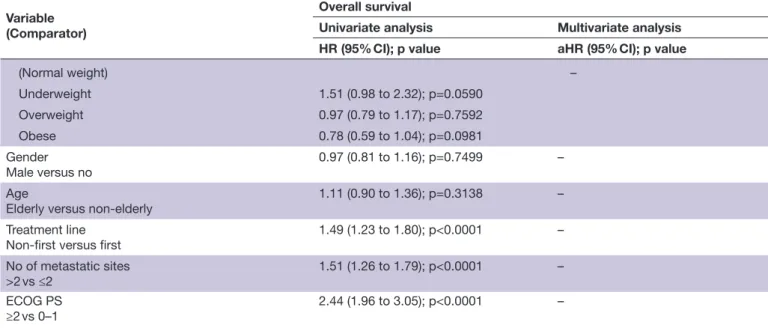
Table 4 Univariate and multivariate analyzes of OS Variable
(Comparator)
Overall survival
Univariate analysis Multivariate analysis
HR (95% CI); p value aHR (95% CI); p value
Baseline steroids
(No)
Non- cancer indications 0.95 (0.62 to 1.47); p=0.8477 0.85 (0.54 to 1.31); p=0.4691
Cancer indications 2.76 (2.27 to 3.36); p<0.0001 2.16 (1.76 to 2.65); p<0.0001 Systemic antibiotics (No) Prophylaxis 2.68 (1.74 to 4.13); p<0.0001 1.93 (1.25 to 2.98); p=0.0030 Infection 1.51 (1.04 to 2.18); p=0.0301 1.20 (0.82 to 1.75); p=0.3288 Gastricacid suppressant (No) Prophylaxis 1.57 (1.31 to 1.89); p<0.0001 1.29 (1.06 to 1.57); p=0.0091 Gastritis/GERD 1.07 (0.76 to 1.49); p=0.7066 0.98 (0.69 to 1.38); p=0.9309
Gastric acid suppressant
(No)
H2 antagonists 1.30 (0.87 to 1.93); p=0.1919 1.04 (0.69 to 1.56); p=0.8444
Proton pump inhibitors 1.49 (1.23 to 1.79); p<0.0001 1.26 (1.04 to 1.52); p=0.0172
Statins Yes versus no
0.81 (0.64 to 1.02); p=0.0810 0.79 (0.62 to 1.01); p=0.0622
Other lipid lowerings
Yes versus no 1.01 (0.65 to 1.57); p=0.9534 1.31 (0.84 to 2.05); p=0.2275 Aspirin Yes versus no 0.94 (0.75 to 1.19); p=0.6548 0.85 (0.67 to 1.07); p=0.1713 Anticoagulants Yes versus no 1.61 (1.27 to 2.03); p=0.0001 1.45 (1.14 to 1.84); p=0.0024 NSAIDs Yes versus no 1.51 (1.07 to 2.11); p=0.0167 1.30 (0.92 to 1.83); p=0.1337 ACE inhibitors/ARBs Yes versus no 0.88 (0.72 to 1.07); p=0.2204 0.91 (0.74 to 1.11); p=0.3798 Calcium antagonists Yes versus no 1.12 (0.87 to 1.44); p=0.3648 1.19 (0.92 to 1.54); p=0.1728 β-blockers* Yes versus no 1.03 (0.77 to 1.36); p=0.8554 0.90 (0.68 to 1.20); p=0.4938 Metformin Yes versus no 1.31 (1.02 to 1.70); p=0.0413 1.24 (0.95 to 1.61); p=0.1040
Other oral antidiabetics
Yes versus no 1.34 (0.91 to 1.97); p=0.1304 1.26 (0.85 to 1.85); p=0.2475 Opioids† Yes versus no 2.14 (1.58 to 2.91); p<0.0001 1.53 (1.11 to 2.11); p=0.0098 Primary tumor (NSCLC) – Melanoma 0.45 (0.36 to 0.57); p<0.0001 Kidney 0.49 (0.38 to 0.63); p<0.0001 Others 0.60 (0.33 to 1.10); p=0.0992 BMI Continued Protected by copyright.
on May 13, 2021 at Universita degli Studi G.D'Annunzio.
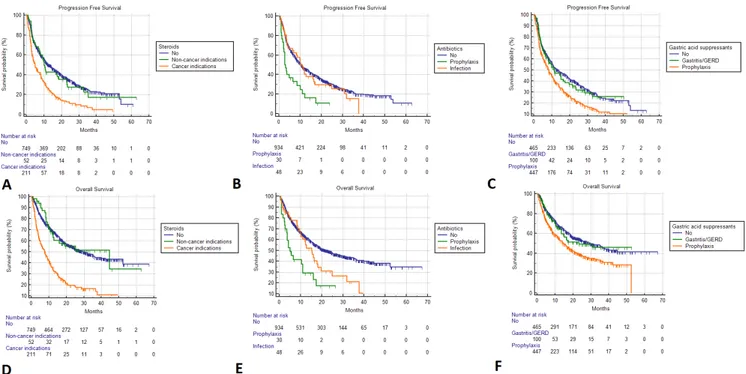
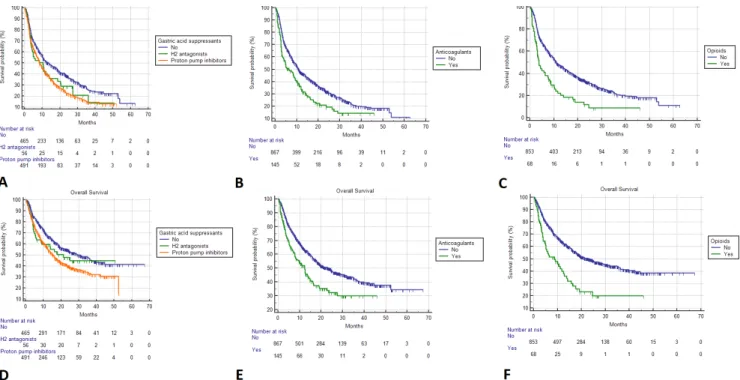
1.76 (95% CI 1.16 to 2.69), p=0.0080) were confirmed to be independently related to an increased ORR. Table 3 summarizes the univariate and multivariate analyzes of PFS. Patients receiving cancer- related steroids (HR 1.72 (95% CI 1.43 to 2.07), p<0.0001), prophylactic systemic antibiotics (HR 1.85 (95% CI 1.23 to 2.78), p=0.0030), prophylactic gastric acid suppressants (HR 1.29 (95% CI 1.09 to 1.53), p=0.0021), proton pump inhibitors (HR 1.26 (95% CI 1.07 to 1.48), p=0.0050), anticoag-ulants (HR 1.43 (95% CI 1.15 to 1.76), p=0.0009) and opioids (HR 1.54 (95% CI 1.11 to 2.12), p=0.0083), were confirmed to have a significantly higher risk of disease progression. On the contrary, patients who assumed aspirin were confirmed to have a significantly lower risk of disease progression (HR 0.79 (95% CI 0.64 to 0.98), p=0.0318). Table 4 summarizes the univariate and multi-variate analyzes of OS. Patients receiving cancer- related steroids (HR 2.16 (95% CI 1.76 to 2.65), p<0.0001), prophylactic systemic antibiotics (HR 1.93 (95% CI 1.25 to 2.98), p=0.0030), prophylactic gastric acid suppres-sants (HR 1.29 (95% CI 1.06 to 1.57), p=0.0091), proton pump inhibitors (HR 1.26 (95% CI 1.04 to 1.52), p=0.0172), anticoagulants (HR 1.45 (95% CI 1.14 to 1.84), p=0.0024) and opioids (HR 1.53 (95% CI 1.11 to 2.11), p=0.0098) were confirmed to have a signifi-cantly higher risk of death. Figures 1 and 2 report the Kaplan- Meier survival curves for PFS and OS according to baseline steroids, systemic antibiotics, gastric acid suppressants, anticoagulants and opioids.
Baseline associations
All the baseline associations are summarized in online supplemental table 5; the administration of baseline steroids (p<0.0001), systemic antibiotics (p=0.0001), gastric acid suppressant (both according to their indica-tion (p<0.0001) and drug class (p=0.0002)), anticoagu-lants (p=0.0011), antidepressants (p=0.0002) and opioids (p=0.0123) was significantly associated to a poorer ECOG- PS. Similarly, the administration of baseline steroids (p=0.0014), gastric acid suppressant (both according to their indication (p<0.0001) and drug class (p<0.0001)), β-blockers (p=0.0166), and opioids (p=0.0014) was signifi-cantly associated to a higher burden of disease.
The administration of statins (p=0.005), anticoag-ulants (p=0.001), ACE inhibitors/ARBs (p=0.002), calcium antagonists (p=0.008), β-blockers (p=0.008), and other oral antidiabetics (p=0.036) was signifi-cantly associated to a higher BMI, while the adminis-tration of NSAIDs (p=0.003), and opioids (p=0.004) to a lower BMI at the ANOVA analysis. Using WHO categories for BMI, we confirmed the association with anticoagulants (p=0.0438), NSAIDs (0.0069) and opioids (p=0.0153).
DISCUSSION
Identification of factors that prelude to immune- refractoriness is an area of high unmet need in cancer immunotherapy. A number of non- oncological medical therapies have been postulated to render the tumor Variable
(Comparator)
Overall survival
Univariate analysis Multivariate analysis
HR (95% CI); p value aHR (95% CI); p value
(Normal weight) – Underweight 1.51 (0.98 to 2.32); p=0.0590 Overweight 0.97 (0.79 to 1.17); p=0.7592 Obese 0.78 (0.59 to 1.04); p=0.0981 Gender Male versus no 0.97 (0.81 to 1.16); p=0.7499 – Age
Elderly versus non- elderly
1.11 (0.90 to 1.36); p=0.3138 –
Treatment line
Non- first versus first 1.49 (1.23 to 1.80); p<0.0001 –
No of metastatic sites
>2 vs ≤2 1.51 (1.26 to 1.79); p<0.0001 –
ECOG PS
≥2 vs 0–1 2.44 (1.96 to 3.05); p<0.0001 –
At the multivariate analysis, each drug category was adjusted for the pre- planned key covariates separately. *Available for 943 patients.
†Available for 921 patients.
ARBs, Angiotensin II receptor blockers; BMI, body mass index; ECOG PS, Eastern Cooperative Oncology Group- Performance Status; GERD, gastroesophageal reflux disease; NSCLC, non- small cell lung cancer; PFS, progression- free survival.
Table 4 Continued
Protected by copyright.
on May 13, 2021 at Universita degli Studi G.D'Annunzio.
microenviroment more tolerogenic, therefore exerting detrimental effects on depth, duration of response and survival of patients treated with ICI.2 Our purpose
was to provide a more comprehensive analysis with a large population of patients with different malignancies receiving PD-1/PD- L1 inhibitors, in order to gain reliable results about the putative immune- modulating effects of concomitant medication most usually taken by patients with cancer.
We produce important confirmatory evidence regarding the association between exposure to steroids, systemic antibiotics and proton pump inhibitors and worse outcomes from ICI. In addition, we provide novel evidence for a shorter survival in patients on anticoag-ulants and opioids at ICIs initiation, a finding that was not previously reported in large populations. Similarly, a significant association between improved ORR/PFS and baseline aspirin, and between improved ORR and statins and β-blockers, had never been reported in the context of cancer patients receiving PD-1/PD- L1 inhibitors.
Intriguingly, among the baseline medication which resulted to be significantly related to clinical outcomes in our study population, the common thread might be somehow considered the immune modulating effects,
particularly exerted through the modifying pressure on the gut- microbiome.
Steroids were the only baseline medication concor-dantly related to ORR, PFS and OS in our study popula-tion. Glucocorticoids can affect the gut microbiome, the intestinal mucosa and synthesis/secretion of mucins.29–31
Nevertheless, we have to consider the possible associative (and not causative) effect played by the significant rela-tion between steroids assumprela-tion and poorer PS/higher burden of disease. In fact, patients receiving baseline steroids for symptoms palliation were confirmed to have significantly worse ORR, PFS and OS, compared with patients who did not received steroids, while not patients who received steroids for non- cancer indications, simi-larly to what reported by Ricciuti et al.6
It is also well known that antibiotics might affect immu-nity by inducing gut microbiome alterations.32 In our study, only systemic antibiotics administered for prophy-laxis were confirmed to be significantly related to short-ened PFS and OS at the multivariate analysis, while not antibiotics administered to treat active infections. Interest-ingly, it was further revealed that antibiotics administered prior of the immunotherapy initiation was confirmed to be related to worse outcomes, while not those
Figure 1 Kaplan- Meier survival estimates. Progression- free survival; (A) Steroids. No: 13.5 months (95% CI 10.8 to 15.4; 472 events); non- cancer indications: 10.0 months (95% CI 7.2 to 18.3; 36 events); cancer indications: 4.9 months (95% CI 3.6 to 6.5; 247 events); (B) Systemic antibiotics. No: 10.5 months (95% CI 9.2 to 11.9, 622 events); prophylaxis: 2.8 months (95% CI 2.1 to 6.7, 25 events); infections: 10.9 months (95% CI 6.4 to 37.5, 34 events); (C) Gastric acid suppressants. No: 13.5 months (95% CI 10.5 to 18.2, 288 events); gastritis/GERD: 11.2 months (95% CI 7.9 to 17.3, 60 events); prophylaxis: 8.2 months (95% CI 6.9 to 9.9, 333 events). Overall survival; (D) Steroids. No: 30.8 months (95% CI 24.4 to 36.3; 432 censored); non- cancer indications: 44.6 months (95% CI 12.0 to 44.6; 30 censored); cancer indications: 7.8 months (95% CI 5.4 to 9.8; 58 censored); (E) Systemic antibiotics. No: 22.8 months (95% CI 18.9 to 27.4, 494 censored); prophylaxis: 4.9 months (95% CI 3.5 to 11.0, 8 censored); infections: 15.2 months (95% CI 9.8 to 18.1, 18 censored); (F) Gastric acid suppressants. No: 29.4 months (95% CI 22.8 to 39.8, 266 censored); gastritis/GERD: 23.2 months (95% CI 13.4 to 30.8, 59 censored); prophylaxis: 14.8 months (95% CI 12.3 to 52.3, 195 censored). GERD, gastroesophageal reflux disease.
Protected by copyright.
on May 13, 2021 at Universita degli Studi G.D'Annunzio.
administered concurrently,10 supporting the hypothesis
that the underlying modulating effects on the gut micro-biome can affect the immunotherapy clinical outcomes only when the modifying pressure is exerted on the prior immune- balance, and not during the treatment. From this perspective, antibiotics administered for prophylactic indications might exert the same negative effect of those administered to treat active infections. However, we have to consider that patients receiving antibiotics have poorer clinical conditions overall and looking at the table 5 we can noticed that those on prophylactic antibiotics had the highest percentage of ECOG- PS ≥2 patients.
Previous studies investigated the role of proton pump inhibitors exclusively,9 11 while this is the first analysis which
evaluated the role of gastric acid suppressants overall. Proton pump inhibitors could negatively affect the gut microbiome due to both the changes of the gastric pH and to bacterial species selections,33 34 but also H2
antag-onists are known to have modifying gut microbiome func-tions and to induce intestinal barrier dysfuncfunc-tions.35 36
Curiously, proton pump inhibitors administration was confirmed to be associated to shortened PFS and OS, but not H2 antagonists and patients receiving gastric acid suppressants for prophylactic purpose experienced significantly shorter PFS and OS, while patients who received these agents to treat gastritis/GERD achieved similar outcomes to patients who did not receive them. In this case, the highest percentage of patients with
ECOG- PS ≥2 is among the patients with gastritis/GERD and among the patients on H2 antagonists, but to proper weigh our results, we must take into account the signif-icant association between baseline gastric acid suppres-sants and burden of disease (online supplemental table 3). Therefore, we are not able to recommend H2 antag-onists prescription instead of proton pump inhibitors for patients with cancer who are in need of a gastric acid suppressant treatment and are going to receive a PD-1/ PD- L1 checkpoint inhibitor, even more considering the recent alerts from drug regulatory agencies regarding the possible contamination with N- nitrosodimethylamine of some of these agents.37 38
Anticoagulants have been assumed to modulate the immune balance, affecting the antibacterial innate immune response,39 while chronic opioid dosing has
been already associated to shift of the gut microbiome and intestinal barrier dysfunction.40–43 Nevertheless, it
should be considered that patients requiring anticoagu-lation therapy and opioids are often frailer than patients who do not: a point that should be emphasized when eval-uating PFS and OS where poorer PS and higher disease burden may confound the analyzes.
The relationship between aspirin and cancer preven-tion/progression have been historically known,44 45 but
in the setting of immunotherapy of cancer, few studies have been published. Wang et al12 evaluated a cohort of
330 melanoma patients receiving PD-1 inhibitors, without
Figure 2 Kaplan- Meier survival estimates. Progression- free survival; (A) Gastric acid suppressants. No: 13.5 months (95% CI 10.5 to 18.2, 288 events); H2 antagonists: 10.3 months (95% CI 3.8 to 13.9; 40 events); proton pump inhibitors: 8.4 months (95% CI 7.5 to 10.0; 353 events); (B) Anticoagulants. No: 10.9 months (95% CI 9.9 to 13.0, 573 events); yes: 6.3 months (95% CI 3.9 to 9.2, 108 events); (C) Opioids. No: 11.0 months (95% CI 10.0 to 13.5, 564 events); yes: 3.8 months (95% CI 2.9 to 6.4, 56 events). Overall survival (D) Gastric acid suppressants. No: 29.4 months (95% CI 22.8 to 39.8, 266 censored); H2 antagonists: 21.1 months (95% CI 6.1 to 25.0; 28 censored); proton pump inhibitors: 15.4 months (95% CI 12.5 to 18.1; 226 censored); (E) Anticoagulants. No: 23.9 months (95% CI 18.9 to 28.6, 460 censored); yes: 12.4 months (95% CI 7.8 to 15.1; 60 censored); (F) Opioids No: 23.2 months (95% CI 18.9 to 28.8, 452 censored); yes: 8.6 months (95% CI 4.7 to 12.7; 22 censored).
Protected by copyright.
on May 13, 2021 at Universita degli Studi G.D'Annunzio.
Table 5
Summary of the associations between each drug category and
PS, bur
den of disease and BMI
PS (%) χ 2 No of metastatic sites (%) χ 2 BMI χ 2 BMI (continuous) way ANOV A 0–1 ≥2 P value ≤2 >2 P value ≤18.5 18.5–25 25–30 ≥30 P value Mean (SD) ratio; P value Baseline ster oids F(21 005)=3.16; p=0.043 (No) 671 (89.6) 78 (10.4) p<0.0001 410 (54.7) 339 (45.3) p=0.0014 27 (3.6) 330 (44.1) 288 (38.5) 104 (13.9) p=0.3548 25.8(4.5) cancer indications 43 (82.7) 9 (17.3) 18 (34.6) 34 (65.4) 1 (1.9) 22 (42.3) 19 (36.5) 10 (19.2) 26.9(4.3) Cancer indications 156 (73.9) 55 (26.1) 94 (44.5) 117 (55.5) 10 (4.7) 108 (51.2) 70 (33.2) 23 (10.9) 24.9(4.4) Systemic antibiotics F(21 005)=0.94; p=0.388 (No) 815 (87.3) 78 (10.4) p=0.0001 482 (51.6) 452 (48.4) p=0.9826 37 (4.0) 416 (44.5) 352 (37.7) 129 (13.8) p=0.3921 25.7(4.5) Pr ophylaxis 19 (63.3) 9 (17.3) 15 (50.0) 15 (50.0) 1 (3.3) 16 (53.3) 11 (36.7) 2 (6.7) 24.5(3.5) Infection 36 (75.0) 55 (26.1) 25 (52.1) 23 (47.9) – 28 (58.3) 14 (29.2) 6 (12.5) 25.5(3.4)
Gastric acid suppr
essant F(21 005)=2.66; p=0.070 (No) 422 (90.8) 43 (9.2) p<0.0001 275 (59.1) 190 (40.9) p<0.0001 21 (4.5) 211 (45.4) 174 (37.4) 59 (12.7) p=0.7860 25.5(4.5) Pr ophylaxis 93 (93.0) 7 (7.0) 189 (42.3) 258 (57.7) 13 (2.9) 201 (45.0) 166 (37.1) 67 (15.0) 24.9(4.3) Gastritis/GERD 355 (79.4) 92 (20.6) 58 (58.0) 42 (42.0) 4 (4.0) 48 (48.0) 37 (37.0) 11 (11.0) 25.9(4.5)
Gastric acid suppr
essant F(21 005)=0.77; p=0.462 (No) 422 (90.8) 43 (9.2) p<0.0001 275 (59.1) 190 (40.9) p<0.0001 21 (4.5) 211 (45.4) 174 (37.4) 59 (12.7) p=0.7860 25.5(4.5) H2 antagonists 44 (78.6) 7 (7.0) 189 (42.3) 258 (57.7) 13 (2.9) 201 (45.0) 166 (37.1) 67 (15.0) 25.3(3.4) Pr
oton pump inhibitors
404 (82.3 92 (20.6) 58 (58.0) 42 (42.0) 4 (4.0) 48 (48.0) 37 (37.0) 11 (11.0) 25.8(4.6) Statins F(11 006)=7.87; p=0.005 (No) 697 (85.4) 119 (14.6) p=0.3027 415 (50.9) 401 (49.1) p=0.3478 36 (4.4) 377 (46.2) 296 (36.3) 107 (13.1) p=0.0718 25.4(4.4) Ye s 173 (88.3) 23 (11.7) 107 (54.6) 89 (45.4) 2 (1.0) 83 (42.3) 81 (41.3) 30 (15.3) 26.4(4.7)
Other lipid lowerings
F(11 006)=3.81; p=0.051 (No) 830 (86.1) 134 (13.9) p=0.5904 491 (50.9) 473 (49.1) p=0.0649 36 (3.7) 447 (46.4) 353 (36.6) 128 (13.3) p=0.0727 25.5(4.5) Ye s 40 (83.3) 8 (16.7) 31 (64.6) 17 (35.4) 2 (4.2) 13 (27.1) 24 (50.0) 9 (18.8) 26.9(4.2) Aspirin F(11 006)=0.47; p=0.493 (No) 710 (86.3) 113 (13.7) p=0.5648 421 (51.2) 402 (48.8) p=0.5710 35 (4.3) 371 (45.1) 305 (37.1) 112 (13.6) p=0.3756 25.6(4.5) Ye s 160 (84.7) 29 (15.3) 101 (53.4) 88 (46.6) 3 (1.6) 89 (47.1) 72 (38.1) 25 (13.2) 25.8(4.1) Anticoagulants F(11 006)=11.44; p=0.001 (No) 758 (87.4) 109 (12.6) p=0.0011 444 (51.2) 423 (48.8) p=0.5649 36 (4.2) 405 (46.7) 314 (36.2) 112 (12.9) p=0.0438 25.4(4.5) Ye s 112 (77.2) 33 (22.8) 78 (53.8) 67 (46.2) 2 (1.4) 55 (37.9) 63 (43.4) 25 (17.2) 26.8(4.6) NSAIDs F(11 006)=9.03; p=0.003 (No) 819 (85.9) 134 (14.1) p=0.9143 490 (51.4) 463 (48.6) p=0.6741 33 (3.5) 424 (44.5) 364 (38.2) 132 (13.9) p=0.0069 25.7(4.4) Ye s 51 (86.4) 8 (13.6) 32 (54.2) 27 (45.8) 5 (8.5) 36 (61.0) 13 (22.0) 5 (8.5) 23.9(4.8) ACE inhibitors/ARBs F(11 006)=9.42; p=0.002 (No) 604 (45.9) 95 (13.6) p=0.5465 352 (50.4) 347 (49.6) p=0.2448 30 (4.3) 333 (47.6) 247 (35.3) 89 (12.7) 25.3(4.3) Ye s 266 (54.1) 47 (15.0) 170 (54.3) 143 (45.7) 8 (2.6) 127 (40.6) 130 (41.5) 48 (15.3) 26.3(4.7) Continued Protected by copyright.
on May 13, 2021 at Universita degli Studi G.D'Annunzio.
PS (%) χ 2 No of metastatic sites (%) χ 2 BMI χ 2 BMI (continuous) way ANOV A 0–1 ≥2 P value ≤2 >2 P value ≤18.5 18.5–25 25–30 ≥30 P value Mean (SD) ratio; P value Calcium antagonist F(11 006)=7.01; p=0.008 (No) 755 (86.6.9) 117 (13.4) p=0.1605 446 (51.5) 426 (48.9) p=0.4905 36 (4.1) 401 (46.0) 322 (36.9) 113 (13.0) p=0.2146 25.5(4.4) Ye s 115 (82.1) 25 (17.9) 76 (54.3) 64 (45.7) 2 (1.4) 59 (42.1) 55 (39.3) 24 (17.1) 26.6(4.9) β-blockers* F(1937)=9.96; p=0.008 (No) 713 (86.0) 116 (14.0) p=0.3118 441 (53.2) 388 (46.8) p=0.0166 35 4.2) 388 (46.8) 303 (36.6) 103 (12.4) p=0.1493 25.4(4.5) Ye s 94 (82.5) 20 (17.5) 47 (41.2) 67 (58.8) 1 (0.9) 47 (41.2) 48 (42.2) 18 (15.8) 26.6(4.1) Metformin F(11 006)=0.37; p=0.542 (No) 777 (86.5) 121 (13.5) p=0.1522 456 (50.8) 442 (49.2) p=0.1524 36 (4.0) 407 (45.3) 331 (36.9) 124 (13.8) p=0.5393 25.6(4.5) Ye s 93 (81.6) 21 (18.4) 66 (57.9) 48 (42.1) 2 (1.8) 53 (46.5) 46 (40.4) 13 (11.4) 25.9(4.6)
Other oral antidiabetics
F(11 006)=4.42; p=0.036 (No) 831 (86.0) 135 (14.0) p=0.8127 495 (51.2) 471 (48.8) p=0.3233 38 (3.9) 443 (45.9) 356 (36.9) 129 (13.4) p=0.2597 25.6(4.5) Ye s 39 (84.8) 7 (15.2) 27 (58.7) 19 (41.3) – 17 (37.0) 21 (45.7) 8 (17.4) 26.9(4.8) Opioids† F(1915)=8.26; p=0.004 (No) 735 (86.2) 118 (13.8) p=0.0123 448 (52.5) 405 (47.5) p=0.0014 29 (3.4) 389 (45.6) 320 (37.5) 115 (13.5) p=0.0153 25.6(4.4) Ye s 51 (75.0) 17 (25.0) 22 (32.4) 46 (67.6) 6 (8.8) 37 (54.4) 22 (32.4) 3 (4.4) 24.0(4.1) ANOV
A, analysis of variance; ARBs, Angiotensin II r
eceptor blockers; BMI, body mass index;
PS, Easter
n Cooperative Oncology Gr
Performance Status; GERD, gastr
oesophageal r
eflux disease.
Table 5
Continued
Protected by copyright.
on May 13, 2021 at Universita degli Studi G.D'Annunzio.
reporting any association between ORR, PFS, OS and NSAIDs use (including aspirin). Even if (cyclooxygenase) COX-2 expression was known to be positively associated with PD- L1 tumor expression,46 we did not find
associa-tions between baseline NSAIDs (excluding aspirin) and immunotherapy clinical outcomes, but the significant association between improved ORR and baseline aspirin, allows to speculate about the possible synergistic effects of COX inhibition in antitumor immunity.47 To our
knowl-edge, the association between statins administration and improved clinical outcomes of patients with cancer receiving ICIs have never been described, however, it is well known that cholesterol metabolism plays a role in CD8+T cell function and might be modulated in order to enhance antitumor immunity.48–51 β-blockers
have already been known to improve recurrence- free survival in patients with radically resected melanoma and to have synergistic effects with immunotherapy in mice models.52 53 In our cohort baseline β-blockers
are significantly associated to improved ORR, while in the study of Wang et al no significant associations were found.12 Intriguingly, the inhibition of β-adrenoceptors
in the intestinal mucosa and gut lymphatic tissue has been linked with changes in type and virulence of the intestinal microbiome and to reduced bacterial translo-cation trough the intestinal barrier.54 Finally, to properly
weighing the ORR analysis results, we have to consider the significant association between β-blockers and low burden of disease and between β-blockers, aspirin, lipid- lowering agents and higher baseline BMI. However, contrary to what we previously reported,15 16 BMI was
not significantly associated to improved outcomes in this population, even though a trend toward better ORR, PFS and OS for increased BMI levels was found. Considering that the most robust evidence of an association between improved outcomes and obesity came from NSCLC,55
this finding might be related to the internal distribution of the study population, which after the update and the addition of data from some new institutions passed form 65.1% and 18.7% of NSCLC and melanoma patients to 52.2% and 26%, respectively.
Despite the suggestion that metformin administration might exert a synergistic antitumor role with ICIs,2 56 we
did not find any significant association between ORR, PFS, OS and baseline metformin, in keeping with previ-ously published evidence.12
Beyond the dispute between association and causation, we have to consider that there are some other potential mechanisms by which concomitant medications could affect clinical outcomes during immunotherapy, in addi-tion to gut microbiome alteraaddi-tion. It is well known that corticosteroids can exert immune- suppressive effects through several mechanisms, such as activation of gluco-corticoid response elements with the inhibition of inter-leukin 1 (IL-1) and IL-6 transcription,57 58 induction of
T- cell suppression and diminishing naïve T cell prolif-eration.59 Gastric acid suppressants can cause immune-
suppressive effects through the inhibition of adhesion
molecules of inflammatory cells and affecting cytokines secretion.60 Aspirin can exert several effects on both innate and adaptive immune responses. It can modu-late proliferation/maturation of immune cells, regumodu-late the cytokine production, and induce the lipoxin- driven immune counter- regulation. Nevertheless, aspirin can also have the immune suppressive ability of inducing tolerogenic dendritic cells, therefore expanding Treg cells.61
Our study acknowledges a number of limitations, including the retrospective design and the lack of central radiology review. The heterogeneity of tumor types eval-uated might had affected the analysis even if we included the primary tumor in the preplanned fixed multivar-iate model. We have to also consider the small sample size of some subgroups as patients receiving steroids for non- cancer indication, gastric acid suppressants to treat gastritis/GERD and receiving H2 antagonists. Moreover, we are planning to investigate the possible detrimental effect on immunotherapy clinical outcomes of specific polypharmacy patterns. To confirm our results, interac-tions between concomitant baseline medicainterac-tions and immunotherapy clinical outcomes should be assessed prospectively.
CONCLUSION
This is the largest study to provide a broad, integrated analysis of multiple concomitant medications as deter-minants of response and survival to immunotherapy in patients with solid tumors. While unable to discriminate between a mechanistic and an associative effect, our study strengthens the knowledge around the association between baseline steroids administered for cancer- related indications, systemic antibiotics, proton pump inhibitors and worse clinical outcomes with PD-1/PD- L1 check-point inhibitors, which can be assumed to have immune- modulating detrimental effects. To correctly weight the association between anticoagulants/opioids and worse PFS/OS we must consider their statistical association with poorer PS/higher burden of disease, while the signifi-cant association between the administration of aspirin, β-blockers, statins and improved ORR deserves further investigations.
Author affiliations
1Department of Biotechnology and Applied Clinical Sciences, University of L'Aquila, L'Aquila, Italy
2Medical Oncology, St. Salvatore Hospital, L'Aquila, Italy
3Medical Oncology Unit, Department of Biomedical Sciences and Human Oncology, University of Bari, Bary, Italy
4National Cancer Research Center, Tumori Institute IRCCS Giovanni Paolo II, Bari, Italy
5Medical Oncology, Department of Human Pathology, A.O. Papardo, University of Messina, Messina, Italy
6IRCCS Ospedale Policlinico San Martino, Genova, Italy 7Medical Oncology, ASUR District Area 4 Fermo, Fermo, Italy 8Medical Oncology, Campus Bio- Medico University, Rome, Italy 9Medical Oncology Unit, Sant'Andrea Hospital of Rome, Rome, Italy
Protected by copyright.
on May 13, 2021 at Universita degli Studi G.D'Annunzio.
Rome, Italy
11Medical Oncology Unit B, Policlinico Umberto I, Sapienza University of Rome, Roma, Italy
12Medical Oncology, Azienda Ospedaliero- Universitaria Pisana, Pisa, Italy 13Medical Oncology, University Hospital Modena, Modena, Italy 14UOC Oncologia Padova Sud, Azienda ULSS 6 Euganea, Padova, Italy 15Medical Oncology Unit, Fondazione IRCCS Ca' Granda Ospedale Maggiore di Milano Policlinico, Milano, Italy
16Medical Oncology, ASST Sette Laghi, Ospedale di Circolo e Fondazione Macchi, Varese, Italy
17Department of Medical, Oral and Biotechnological Sciences, Gabriele d'Annunzio University of Chieti and Pescara, Chieti, Italy
18Department of Psychological, Health and Territorial Sciences, University G. D'Annunzio of Chieti and Pescara, Chieti, Italy
19Division of Medical Oncology for Melanoma, Sarcoma and Rare Tumors, IEO European Institute of Oncology IRCCS, Milan, Italy
20Medical Oncology, Azienda Ospedaliera S. Maria, Terni, Italy 21Oncology Unit, IRCCS Ospedale Sacro Cuore Don Calabria, Negrar, Italy 22Medical Oncology, Santa Maria Goretti Hospital, Latina, Italy
23Melanoma, Cancer Immunotherapy and Development Therapeutics Unit, Istituto Nazionale Tumori IRCCS Fondazione "G. Pascale", Napoli, Italy
24Division of Cancer, Department of Surgery and Cancer, Imperial College London, Hammersmith Hospital, London, UK
Twitter Alessandro Russo @Al3ssandroRusso
Contributors All authors contributed to the publication according to the ICMJE
guidelines for the authorship. All authors read and approved the manuscript and agree to be accountable for all aspects of the research in ensuring that the accuracy or integrity of any part of the work are appropriately investigated and resolved.
Funding This work was supported by the Consorzio Interuniversitario Nazionale
per la Bio- Oncologia (CINBO). DP is supported by grant funding from the Wellcome Trust Strategic Fund (PS3416) and from the NIHR Imperial Biomedical Research Center (BRC) ITMAT Push for Impact Scheme 2019 and acknowledges infrastructural support by the Cancer Research UK Imperial Center and the Imperial Experimental Cancer Medicine Center (ECMC).
Competing interests AC received speaker fees and grant consultancies from
Roche, MSD, BMS, AstraZeneca, Novartis, Astellas. RG received speaker fees and grant consultancies from AstraZeneca and Roche. MGV received speaker fees, grant consultancies and travel support from BMS, Ipsen, Novartis, Pfizer, Astellas, Jansen and Pierre- Fabre. AR received grant consultancies from AstraZeneca and MSD. RM received grant consultancies from Pierre- Fabre, MSD, Incyte, BMS, and Roche. FS received speaker fees and grant consultancies from Roche, Novartis, BMS, MSD, Pierre- Fabre, Sanofi, Merck and Sunpharma. DP received lecture fees from ViiV Healthcare, Bayer Healthcare and travel expenses from BMS and Bayer Healthcare; consulting fees for Mina Therapeutics, EISAI, Roche, Astra Zeneca; received research funding (to institution) from MSD, BMS. PAA received speaker fees and grant consultancies from BMS, Roche- Genentech, MSD, Dohme, Array, Novartis, Merck- Serono, Pierre- Fabre, Incyte, New Link Genetics, Genmab, Medimmune, AstraZeneca, Syndax, SunPharma, Sanofi, Idera, Ultimovacs, Sandoz, Immunocore, 4SC, Alkermes, Italfarmaco, Nektar, Boehringer- Ingelheim; he also received research funds from BMS, Roche- Genentech, Array.
Patient consent for publication Not required.
Ethics approval All patients alive at the time of data collection provided an
informed consent for the present retrospective analysis. The procedures followed were in accordance with the precepts of Good Clinical Practice and the declaration of Helsinki. The study was approved by the respective local ethical committees on human experimentation of each institution, after previous approval by the coordinating center (University of L’Aquila, Internal Review Board protocol number 32865, approved on July 24 2018).
Provenance and peer review Not commissioned; externally peer reviewed.
Data availability statement The datasets used during the present study are
available from the corresponding author on reasonable request.
This content has been supplied by the author(s). It has not been vetted by BMJ Publishing Group Limited (BMJ) and may not have been peer- reviewed. Any opinions or recommendations discussed are solely those of the author(s) and are
reliance placed on the content. Where the content includes any translated material, BMJ does not warrant the accuracy and reliability of the translations (including but not limited to local regulations, clinical guidelines, terminology, drug names and drug dosages), and is not responsible for any error and/or omissions arising from translation and adaptation or otherwise.
Open access This is an open access article distributed in accordance with the
Creative Commons Attribution Non Commercial (CC BY- NC 4.0) license, which permits others to distribute, remix, adapt, build upon this work non- commercially, and license their derivative works on different terms, provided the original work is properly cited, appropriate credit is given, any changes made indicated, and the use is non- commercial. See http:// creativecommons. org/ licenses/ by- nc/ 4. 0/.
ORCID iDs
Alessio Cortellini http:// orcid. org/ 0000- 0002- 1209- 5735
David James Pinato http:// orcid. org/ 0000- 0002- 3529- 0103
Paolo Antonio Ascierto http:// orcid. org/ 0000- 0002- 8322- 475X
REFERENCES
1 Scripture CD, Figg WD. Drug interactions in cancer therapy. Nat
Rev Cancer 2006;6:546–58.10.1038/nrc1887 [published correction appears in Nat Rev Cancer. 2006 Sep;6(9):741]
2 Hussain N, Naeem M, Pinato DJ. Concomitant medications and immune checkpoint inhibitor therapy for cancer: causation or
association? Hum Vaccin Immunother 2020:1–7.
3 Gopalakrishnan V, Helmink BA, Spencer CN, et al. The influence of the gut microbiome on cancer, immunity, and cancer immunotherapy. Cancer Cell 2018;33:570–80.
4 Malmberg K- J. Effective immunotherapy against cancer: a question
of overcoming immune suppression and immune escape? Cancer
Immunol Immunother 2004;53:879–92.
5 Arbour KC, Mezquita L, Long N, et al. Impact of baseline steroids on efficacy of programmed cell death-1 and programmed Death- Ligand
1 blockade in patients with non- small- cell lung cancer. J Clin Oncol
2018;36:2872–8.
6 Ricciuti B, Dahlberg SE, Adeni A, et al. Immune checkpoint inhibitor outcomes for patients with non- small- cell lung cancer receiving baseline corticosteroids for palliative versus Nonpalliative indications. J Clin Oncol 2019;37:1927–34.
7 Petrelli F, Signorelli D, Ghidini M, et al. Association of steroids use with survival in patients treated with immune checkpoint inhibitors: a
systematic review and meta- analysis. Cancers 2020;12:546.
8 Derosa L, Hellmann MD, Spaziano M, et al. Negative association of antibiotics on clinical activity of immune checkpoint inhibitors in
patients with advanced renal cell and non- small- cell lung cancer. Ann
Oncol 2018;29:1437–44.
9 Chalabi M, Cardona A, Nagarkar DR, et al. Efficacy of chemotherapy and atezolizumab in patients with non- small- cell lung cancer receiving antibiotics and proton pump inhibitors: pooled post hoc
analyses of the oak and poplar trials. Ann Oncol 2020;31:525–31.
10 Pinato DJ, Howlett S, Ottaviani D, et al. Association of prior antibiotic treatment with survival and response to immune checkpoint inhibitor
therapy in patients with cancer. JAMA Oncol 2019;5:1774–8.
11 Homicsko K, Richtig G, Tuchmann F, et al. Proton pump inhibitors negatively impact survival of PD-1 inhibitor based therapies in
metastatic melanoma patients. Ann Oncol 2018;29:x40.
12 Wang DY, McQuade JL, Rai RR, et al. The impact of nonsteroidal anti- inflammatory drugs, beta blockers, and metformin on the
efficacy of anti- PD-1 therapy in advanced melanoma. Oncologist
2020;25:e602–5.
13 Gandhi S, Pandey M, Ammannagari N, et al. Impact of concomitant medication use and immune- related adverse events on response to
immune checkpoint inhibitors. Immunotherapy 2020;12:141–9.
14 Hakozaki T, Hosomi Y, Shimizu A, et al. Polypharmacy as a prognostic factor in older patients with advanced non- small- cell lung cancer treated with anti- PD-1/PD- L1 antibody- based
immunotherapy. J Cancer Res Clin Oncol 2020;146:2659–68.
15 Cortellini A, Bersanelli M, Buti S, et al. A multicenter study of body mass index in cancer patients treated with anti- PD-1/PD- L1 immune
checkpoint inhibitors: when overweight becomes favorable. J
Immunother Cancer 2019;7:57.
16 Cortellini A, Bersanelli M, Santini D, et al. Another side of the association between body mass index (BMI) and clinical outcomes of cancer patients receiving programmed cell death protein-1 (PD-1)/ Programmed cell death- ligand 1 (PD- L1) checkpoint inhibitors: a
Protected by copyright.
on May 13, 2021 at Universita degli Studi G.D'Annunzio.
multicentre analysis of immune- related adverse events. Eur J Cancer 2020;128:17–26.
17 Cortellini A, Buti S, Bersanelli M, et al. Evaluating the role of family history of cancer and diagnosis of multiple neoplasms in cancer patients receiving PD-1/PD- L1 checkpoint inhibitors: the multicenter
FAMI- L1 study. Oncoimmunology 2020;9:1710389.
18 Cortellini A, Vitale MG, De Galitiis F, et al. Early fatigue in cancer patients receiving PD-1/PD- L1 checkpoint inhibitors: an insight from
clinical practice. J Transl Med 2019;17:376.
19 Cortellini A, Buti S, Santini D, et al. Clinical outcomes of patients with advanced cancer and pre- existing autoimmune diseases treated with Anti- Programmed death-1 immunotherapy: a real- world transverse
study. Oncologist 2019;24:e327–37.
20 Cortellini A, Chiari R, Ricciuti B, et al. Correlations between the immune- related adverse events spectrum and efficacy of
anti- PD1 immunotherapy in NSCLC patients. Clin Lung Cancer
2019;20:237–47.
21 Eisenhauer EA, Therasse P, Bogaerts J, et al. New response evaluation criteria in solid tumours: revised RECIST guideline (version
1.1). Eur J Cancer 2009;45:228–47.
22 Woolley KK. How variables uncorrelated with the dependent variable can actually make excellent predictors: the important suppressor variable case. Southwest educational research association annual meeting proceedings, 1997. Available: https:// eric. ed. gov/? id= ED407420 [Accessed 10 Jun 2020].
23 Thompson FT, Levine DU. Examples of easily Explainable suppressor variables in multiple regression research. Multi Linear Regres
Viewpoints 1997;24:11–13.
24 “Stopping stepwise: Why stepwise selection is bad and what you should use instead”. On towardsdatascience. com. Available: https:// towardsdatascience. com/ stopping- stepwise- why- stepwise- selection- is- bad- and- what- you- should- use- instead- 90818b3f52df [Accessed 10 Jun 2020].
25 Miñana B, Cózar JM, Palou J, et al. Bladder cancer in Spain 2011:
population based study. J Urol 2014;191:323–8.
26 Ciocan D, Barbe C, Aubin F, et al. Distinctive features of melanoma and its management in elderly patients: a population- based study in
France. JAMA Dermatol 2013;149:1150–7.
27 Gridelli C, Balducci L, Ciardiello F, et al. Treatment of elderly patients with non- small- cell lung cancer: results of an international expert
panel meeting of the Italian association of thoracic oncology. Clin
Lung Cancer 2015;16:325–33.
28 Azawi NH, Joergensen SM, Jensen NV, et al. Trends in kidney
cancer among the elderly in Denmark, 1980-2012. Acta Oncol
2016;55(Suppl 1):79–84.
29 Wu T, Yang L, Jiang J, et al. Chronic glucocorticoid treatment induced circadian clock disorder leads to lipid metabolism and gut
microbiota alterations in rats. Life Sci 2018;192:173–82.
30 He Z, Kong X, Shao T, et al. Alterations of the gut microbiota associated with promoting efficacy of prednisone by Bromofuranone
in MRL/lpr mice. Front Microbiol 2019;10:978.
31 Li Z- Y, Fan M- B, Zhang S- L, et al. Intestinal Metrnl released into the gut lumen acts as a local regulator for gut antimicrobial peptides. Acta Pharmacol Sin 2016;37:1458–66.
32 Hagan T, Cortese M, Rouphael N, et al. Antibiotics- Driven gut
microbiome perturbation alters immunity to vaccines in humans. Cell
2019;178:1313–28. e13.
33 Bruno G, Zaccari P, Rocco G, et al. Proton pump inhibitors and
dysbiosis: current knowledge and aspects to be clarified. World J
Gastroenterol 2019;25:2706–19.
34 Jackson MA, Goodrich JK, Maxan M- E, et al. Proton pump
inhibitors alter the composition of the gut microbiota. Gut
2016;65:749–56.
35 Gao C, Major A, Rendon D, et al. Histamine H2 receptor- mediated suppression of intestinal inflammation by probiotic Lactobacillus
reuteri. mBio 2015;6:e01358–15.
36 Diebel LN, Liberati DM, Hall- Zimmerman L. H2 blockers decrease gut
mucus production and lead to barrier dysfunction in vitro. Surgery
2011;150:736–43.
37 U.S. Food and Drug Administration. Questions and answers: NDMA impurities in ranitidine (commonly known as Zantac). Available: https://www. fda. gov/ drugs/ drug- safety- and- availability/ questions- and- answers- ndma- impurities- ranitidine- commonly- known- zantac [Accessed 14 Jun 2020].
38 European Medicines Agencies. EMA to review ranitidine medicines following detection of NDMA. Available: https://www. ema. europa. eu/ en/ news/ ema- review- ranitidine- medicines- following- detection- ndma [Accessed 14 Jun 2020].
39 Strobel L, Johswich KO. Anticoagulants impact on innate immune responses and bacterial survival in whole blood models of Neisseria
meningitidis infection. Sci Rep 2018;8:10225.
40 Taylor A. Revealing a brain- gut microbiome connection following
chronic opioid treatment. J Pain 2018;19:S1.
41 Acharya C, Betrapally NS, Gillevet PM, et al. Chronic opioid use is associated with altered gut microbiota and predicts readmissions in
patients with cirrhosis. Aliment Pharmacol Ther 2017;45:319–31.
42 Banerjee S, Sindberg G, Wang F, et al. Opioid- induced gut microbial disruption and bile dysregulation leads to gut barrier
compromise and sustained systemic inflammation. Mucosal Immunol
2016;9:1418–28.
43 Ren M, Lotfipour S. The role of the gut microbiome in opioid use. Behav Pharmacol 2020;31:113–21.
44 Dai X, Yan J, Fu X, et al. Aspirin inhibits cancer metastasis
and angiogenesis via targeting heparanase. Clin Cancer Res
2017;23:6267–78.
45 Algra AM, Rothwell PM. Effects of regular aspirin on long- term cancer incidence and metastasis: a systematic comparison of
evidence from observational studies versus randomised trials. Lancet
Oncol 2012;13:518–27.
46 Botti G, Fratangelo F, Cerrone M, et al. COX-2 expression positively
correlates with PD- L1 expression in human melanoma cells. J Transl
Med 2017;15:46.
47 Zelenay S, van der Veen AG, Böttcher JP, et al. Cyclooxygenase-
Dependent tumor growth through evasion of immunity. Cell
2015;162:1257–70.
48 Ma X, Bi E, Lu Y, et al. Cholesterol Induces CD8+ T Cell Exhaustion in
the Tumor Microenvironment. Cell Metab 2019;30:143–56. e5.
49 Yang W, Bai Y, Xiong Y, et al. Potentiating the antitumour response
of CD8(+) T cells by modulating cholesterol metabolism. Nature
2016;531:651–5.
50 Mok EHK, Lee TKW. The pivotal role of the dysregulation of cholesterol homeostasis in cancer: implications for therapeutic
targets. Cancers 2020;12:E1410.
51 Perrone F, Minari R, Bersanelli M, et al. The prognostic role of high blood cholesterol in advanced cancer patients treated with immune
checkpoint inhibitors. J Immunother 2020;43:196–203.
52 De Giorgi V, Grazzini M, Benemei S, et al. Propranolol for off- label treatment of patients with melanoma: results from a cohort study. JAMA Oncol 2018;4:e172908.
53 Kokolus KM, Zhang Y, Sivik JM, et al. Beta blocker use correlates with better overall survival in metastatic melanoma patients and
improves the efficacy of immunotherapies in mice. Oncoimmunology
2018;7:e1405205.
54 Thiele M, Wiest R, Gluud LL, et al. Can non- selective beta- blockers
prevent hepatocellular carcinoma in patients with cirrhosis? Med
Hypotheses 2013;81:871–4.
55 Kichenadasse G, Miners JO, Mangoni AA, et al. Association between body mass index and overall survival with immune checkpoint
inhibitor therapy for advanced non- small cell lung cancer. JAMA
Oncol 2020;6:e195241:512.
56 Afzal MZ, Mercado RR, Shirai K. Efficacy of metformin in combination with immune checkpoint inhibitors (anti- PD-1/anti-
CTLA-4) in metastatic malignant melanoma. J Immunother Cancer
2018;6:64.
57 Coutinho AE, Chapman KE. The anti- inflammatory and
immunosuppressive effects of glucocorticoids, recent developments
and mechanistic insights. Mol Cell Endocrinol 2011;335:2–13.
58 Luo Y, Zheng SG. Hall of fame among pro- inflammatory cytokines: interleukin-6 gene and its transcriptional regulation mechanisms. Front Immunol 2016;7:604.
59 Giles AJ, Hutchinson M- KND, Sonnemann HM, et al.
Dexamethasone- induced immunosuppression: mechanisms and
implications for immunotherapy. J Immunother Cancer 2018;6:51.
60 Biswas S, Benedict SH, Lynch SG, et al. Potential immunological consequences of pharmacological suppression of gastric acid
production in patients with multiple sclerosis. BMC Med 2012;10:57.
61 Hussain M, Javeed A, Ashraf M, et al. Aspirin and immune system. Int Immunopharmacol 2012;12:10–20.
Protected by copyright.
on May 13, 2021 at Universita degli Studi G.D'Annunzio.