Maurizio Aceto, Maria João Melo, Elisa Calà, Paula Nabais, Rita Araújo
Introduction
The colour of the parchment of the Vienna Genesis is one of its most distinctive features, particularly as the symbolic meaning of purple was typically associated with regality since ancient times. The knowledge of the exact chemical nature of the dye used for purple is a matter of high relevance not only from the perspective of art history but also from that of conservation. In fact, the stability of the dyes to light is very different from one to another. Shellfish purple is considered to be stable and lightfast. Many other purple dyes such as folium from Chrozophora tinctoria or orchil (the dye extracted from lichens) are much more fugitive and could fade dramatically with prolonged light exposure (Table 1 a and b). Therefore, knowing what colorant is present on the parchment of the Vienna Genesis is important for decisions on conservation and storage.
The chemical nature of the colorant used for purple parchment has been a matter of speculation among scholars, given its extreme symbolic value. Before scientific analyses were performed in recent years, it has always been taken for granted that shellfish purple, the most prized dye of all times, must have been used for dyeing the parchment1, despite
the lack of any direct analytical evidence. The only indirect clue for shellfish purple was the identification of bromine yielded by X-Ray fluorescence spectrometry (XRF) in few instances, because this element is contained in the structure of 6,6’-dibromoindigotine (Fig. 1), the main molecule of shellfish purple.
Previous research suggested that bromine in a purple area could act as marker for shellfish purple2, even if this assumption was subsequently criticised, at least with regard
to miniature painting3. A recent study4 showed that bromine is contained in significant
amounts in many lichen species, used in antiquity for extracting purple dye known as orchil, and in Chrozophora tinctoria, the plant from which the folium dye was obtained. Therefore, it is clear that bromine cannot be considered an exclusive chemical marker for the presence of shellfish purple. However, the diagnostic evidence gleaned in recent years 1 Laurie, 1914; Thompson, 1956; Diringer, 1967; Furlan, 1998.
2 Porter et al., 2002; Maravelaki-Kalaitzaki and Kallithrakas-Kontos, 2003. 3 Porter, 2008, pp. 59–64.
from scientific methods suggested a completely different story: it revealed that shellfish purple has to date never been directly identified in any purple manuscript, and that other dyes such as folium or orchil were used instead5. It is important to keep in mind that it is
not possible to detect the indigoid chromophores of shellfish purple admixed with one of these dyes due to the very low quantum yield of fluorescence emission of shellfish purple on one hand, and very low signals in Raman on the other.
The analytical study on the purple dye contained on the parchment of the Vienna Gen-esis was performed in two phases: 1. non-invasive measurements were carried out in situ with portable instruments at the Austrian National Library. Further measurements were taken in the laboratory on micro-samples (ø 2 mm) of the parchment. The main aim of the non-invasive investigation was to make a preliminary identification of the dye used for 5 See among others Rosi et al., 2013; Aceto et al., 2014; Aceto et al., 2017.
Table 1a: Possible sources for purple dyeing in antiquity and molecular structures for the main chromophores: Rocella tinctoria and Lasallia pustu-lata. In the lichens two type of chromophores may be found, derivatives of amino- or hidroxy-orcein. Dyed parchment samples were ir-radiated with a Xenon lamp (lirr ≥ 320 nm), photographs
and L*a*b* colour coordin-ates for unaged and 310 h irradiation are given.
the purple colour of the parchment. The following analysis enabled the production of a fingerprint identification of the dye.
For the study, four techniques were selected. UV-visible diffuse reflectance spectropho-tometry with optic fibres (FORS) was used for the preliminary identification of the dye. Spectrofluorimetry yielded complementary information. Micro-spectrofluorimetry on aged reference samples and on original parchment micro-samples enabled further insight
Table 1b: Possible sources for purple dyeing in antiquity and molecular structures for the main chromophores: Chrozophora tinctoria and shellfish purple (Hexaplex trunculus). Dyed parchment samples were irradiated with a Xenon lamp (lirr ≥
320 nm), photographs and L*a*b* colour coordinates for unaged and 310 h irradiation are given.
Fig. 1: Structure of dibromoin-digotine.
on the nature of the chromophores present. Surface enhanced Raman spectroscopy (SERS) made it possible to obtain a definitive fingerprint identification of the dye by analysis of the micro-sample. Finally, X-Ray fluorescence spectrometry (XRF) was used to detect bromine.
For comparison, the same measurements were carried out on a micro-sample of parch-ment taken from Codex Serius nova 2804 (Cod. Ser. n. 2804) from the Austrian National Library. Cod. Ser. n. 2804 is a fragment of purple parchment without text that is dated to the 6th century.
Methods of analysis
UV-visible diffuse reflectance spectrophotometry with optic fibres (FORS) analysis was per-formed with an Avantes (Apeldoorn, The Netherlands) AvaSpec-ULS2048XL-USB2 model spectrophotometer and an AvaLight-HAL-S-IND tungsten halogen light source. Detector and light source were connected with fibre optic cables to an FCR-7UV200-2-1,5x100 probe. In this configuration, light is sent and retrieved with a single fibre bundle positioned at 45° with respect to the normal surface, in order to exclude specular reflectance. The spec-tral range of the detector was 200–1160 nm. According to the features of the monochro-mator (slit width 50 µm, grating of UA type with 300 lines/mm) and of the detector (2048 pixels), the best spectral resolution was 2.4 nm calculated as FWHM (Full Width at Half Maximum). Diffuse reflectance spectra of the samples were referenced against the WS-2 reference tile provided by Avantes and guaranteed to be reflective at least at 98 % within the investigated spectral range. Blank correction was not efficient on both the extremes of the spectral range, therefore the regions 200–350 nm and 1100–1160 nm were not considered in the discussion. The diameter of the area investigated on the sample was 1 mm. In all of the measurements, the distance between the probe and the sample was kept constant at 2 mm, corresponding to the focal length of the probe. To visualise the samples, the probe was equipped with a USB endoscope. The instrumental parameters were as follows: 10 ms integration time, 100 scans for a total acquisition time of 1.0 s for each spectrum. The sys-tem was managed by means of AvaSoft v. 8 dedicated software, running under Windows 7. For Spectrofluorimetry, an Ocean Optics (Dunedin, Florida, USA) Jaz model spectro-photometer was used to record molecular fluorescence spectra. The instrument is equipped with a 365 nm Jaz-LED internal light source. An FCR-7UV200-2-1,5x100 probe (same as FORS) is used to drive excitation light on the sample and to recover the emitted light. The spectrophotometer works in the range 191–886 nm. According to the features of the monochromator (200 µm slit width) and detector (2048 elements), the spectral resolution available is 7.6 nm calculated as FWHM. The investigated area on the sample is 1 mm in
diameter. In all of the measurements, the sample-to-probe distance was kept constant to 12 mm, corresponding to the focal length of the probe. To visualise the samples, the probe was equipped with a USB endoscope. The instrumental parameters were as follows: 4 s integration time, 3 scans for a total acquisition time of 12 s for every spectrum. The system is managed by SpectraSuite software running under Windows 7.
For Micro-spectrofluorimetry, fluorescence excitation and emission spectra were re-corded with a Jobin Yvon/Horiba SPEX Fluorog 3-2.2 spectrofluorometer hyphenated to an Olympus BX51 M confocal microscope, with spatial resolution controlled with a multiple-pinhole turret, corresponding to a minimum 2 µm and maximum 60 µm spot, with 50x objective. Standard dichroic filters used at 45° were used to collect the excitation spectra (570 and 620 nm) and emission spectra (540 and 570 nm). Emission spectra were acquired exciting at 530 and 560 nm, while excitation spectra were recorded collecting the signal at 590 and 630 nm. This enables the collection of both the emission and excitation spectra with the same filter holder. Spectra were acquired on a 30 or 8 µm spot (pinhole 8 and 5, respectively) with the following slits set: emission slits = 3 / 3 / 3 mm, and excit-ation slits = 5 / 3 / 0.8 mm. The optimizexcit-ation of the signal was performed for all pinhole apertures through mirror alignment in the optic pathway of the microscope, following the manufacturer’s instructions. Spectra were collected after focusing on the sample (eye view) followed by signal intensity optimization (detector reading). Emission and excitation spec-tra were acquired on the same spot whenever possible. Most of the reference samples were analysed in situ. The Vienna Genesis was analysed using micro-samples.
Surface enhanced Raman spectroscopy (SERS) analysis was carried out by Elisa Calà with a high-resolution dispersive Horiba (Villeneuve d’Ascq, France) LabRAM HR model spectrophotometer coupled with a confocal microscope. The instrument was equipped with a 633 nm excitation laser, a 1800 lines/mm dispersive grating, an 800 mm path mono-chromator and a Peltier cooled CCD detector. The optical arrangement gave a spectral resolution of about 2 cm-1. Spectra were taken by placing the samples on the microscope
stage and by observing them with long working distance 50x and 80x objectives. The sam-pled area was identified and focused using either a video camera or the microscope binocu-lars. Laser power at the sample was kept very low (30 µW) by means of a series of neutral density filters, in order to prevent any thermal degradation of the molecules. Exposure time was 1–30 s according to needs, with 3 accumulations for each spectrum. The system was managed with LabSpec 5 software running under Windows XP. For the preparation of the sample, silver colloidal pastes were synthesised according to the procedure described by Lee and Meisel6, based on reduction of silver nitrate with citric acid. Analysis was
formed directly on the sample, by pouring 1 µl of silver colloidal paste on it and waiting for the mixture to dry before exposing it to the laser beam.
SERS analysis were undertaken by Maria J. Melo et al. using a Labram 300 Jobin Yvon spectrometer, equipped with a HeNe laser operating at 632,8 nm (17 mW). Spectra were recorded as an extended scan. The laser beam was focused with 50x and 100x Olympus objective lens. The laser power at the surface of the sample varied with the aid of a set of neutral density filters (optical densities 0.6 and 1). It was between 4.25 and 1.7 mW. No evidence of sample degradation was observed during spectra acquisition. More than three spectra were collected from the same sample and a silicon reference was used to calibrate the instrument. Silver colloids for SERS were prepared by chemical reduction of silver ni-trate with sodium cini-trate, following the synthetic protocol published by Lee and Meisel7.
SERS analysis was performed after deposition of 0.8 µL of the silver colloid and 0.1 µL of 0.5 mol L−1 KNO
3 aqueous solution onto the micro-sample. All spectra were collected by
focusing the laser beam onto the microaggregates that formed inside the dye-colloid drop-let a few seconds after the deposition of the silver nanoparticles and KNO3. Spectra were
acquired continuously until the droplet dried out.
X-Ray fluorescence spectrometry (XRF) measurements were taken with a handheld EDXRF Thermo (Waltham, USA) NITON spectrometer XL3T-900 GOLDD model, equipped with a Ag tube (max. 50 kV, 100 µA, 2 W), large area SDD detector, energy reso-lution of about 136 eV at 5.9 keV. The spot analysed had a diameter of 3 or 8 mm and was focused by a CCD camera, with a working distance of 2 mm. The point of analysis and the size of the irradiated sample are visualised by means of a CCD camera. The instrument was held in position with a moving stage allowing millimetric shifts, in order to reach the desired probe-to-sample distance; the stage was laid on a tripod. The total time of analysis was 240 seconds divided into 4 fractions, in which the operating conditions were modified in order to optimise the instrumental responses at different energy ranges (high: 50 keV, 50 µA, Mo filter; main: 40 keV, 50 µA, Fe/Al filter; low: 20 keV, 95 µA, Cu filter; light: 6 keV, 95 µA, no filter). The spectra obtained were processed with the commercial software WinAxil, derived by the academic software QXAS from IAEA.
Results and discussion
All previous analytical studies on purple codices indicated that orchil or folium, but not shellfish purple, were used for colouring parchment. The Vienna Genesis is no exception. 7 Lee and Meisel, 1982.
In fact, FORS and spectrofluorimetry non-invasive measurements indicate that all pages were coloured with orchil, the dye extracted from different species of lichens. The results of the analyses are shown in the following figures. The FORS spectrum taken at folio 1, page 1 of the Vienna Genesis, representative of all other folios, is compared in figure 2 with standard purple dyes: alkanet, cochineal/kermes, folium, madder, orchil and shellfish ple. Alkanet, cochineal, folium and madder were prepared in the laboratory. Shellfish pur-ple was obtained from Kremer pigments. The spectra are shown in Log(1/R) coordinates. From the comparison orchil seems to be the main dye of the Vienna Genesis, according to the two maxima at approx. 546 and 588 nm (Fig. 2). The shellfish purple is ruled out as dominant dye by lack of any absorption at approximately 526 nm. The identification of folium is also possible, since its maxima are close to those of orchil. Folium has been pre-viously identified on a few purple codices such as the 6th century Codex Brixianus8, the 8th
century Evangiles de Saint Riquier9, the 8th century Évangéliaire de Godescalc10, and a 13th
century section inside the 8th century Evangiles dits de Saint-Denis11. Thomas and Flieder12
claimed to identify folium in the parchment of the Codex Sinopensis, but their result is questionable. In 2018 further measurements on the manuscript revealed that orchil was the dye present13 as the overall shape of the FORS spectrum is closer to that of orchil than to
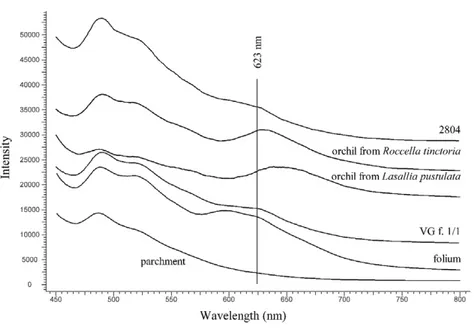
folium. Figure 3 shows the comparison between spectra from the Vienna Genesis (folio 1, page 1), Cod. Ser. n. 2804 (fragment of purple parchment) and the spectra registered on the samples prepared by Sophie Rabitsch after dyeing with orchil from Roccella tinctoria and from Lasallia pustulata (see chapter on purple dyeing): the spectral features are similar. The spectrofluorimetric analysis confirmed the identification by FORS. It reinforces the identification of orchil over folium, as the two dyes have different fluorescence maxima. In fact, the spectral features arising from the Vienna Genesis and Cod. Ser. n. 2804 were again similar to those of orchil and appeared as a fluorescence band located at approx. 623 nm (Fig. 4). A comparison is provided with the parchment samples dyed with orchil from
Roccella tinctoria and from Lasallia pustulata. Very similar spectral features were also found
on Cod. Ser. n. 2804.
Micro-spectrofluorimetry (8–20 micrometers in diameter) results show the presence of two chromophores in the Vienna Genesis sample, yet we do not know if these are of the same chemical family, of different families or the result of degradation. Emission and excit-8 Biblioteca Queriniana, Brescia; Aceto et al., 2014; Idone et al., 2017.
9 Bibliothèque municipale, Abbeville, ms. 4; Roger, 2007.
10 Bibliothèque nationale de France, Paris, ms. NAL 1203; Roger Puyo, 2013. 11 Bibliothèque nationale de France, Paris, ms. Latin 9387; Aceto, 2018. 12 Thomas and Flieder, 1980.
Fig. 2: FORS spectra of the parchment of the Vienna Genesis (folio 1, page 1) and of standard purple dyes. The spectra are shown in Log(1/R) coordinates.
Fig. 3: FORS spectra of the parchment of the Vienna Genesis (folio 1, page 1), Cod. Ser. n. 2804 and of reference parchment samples dyed with orchil from Roccella tinctoria and from Lasallia
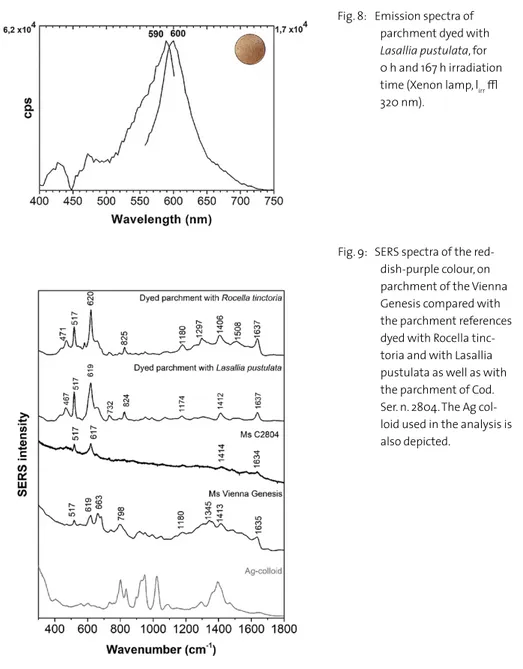
ation spectra were obtained. The latter may simulate the absorption spectrum. One of the species is characterised by an excitation spectrum with a maximum at 535 nm whereas the second species displays a maximum at 590 nm (Fig. 5). On the other hand, the emission maxima are similar, 595 and 600 nm, respectively (Fig. 6). When compared to artificially aged samples of Lasallia pustulata, we find a very good match with the chromophore char-acterised by excitation (Fig. 7) and emission maxima (Fig. 8) at 590 and 600 nm (chromo-phore #2), respectively. The same was observed for parchment dyed with Rocella tinctoria (results not shown). Compared to unaged orcein-treated samples, a 5 nm shift to longer wavelengths was observed in the emission spectrum (Fig. 8). In summary, a very good match was obtained with representative spectra found in the original purple parchment (chromophore #2) and an aged reference sample dyed with Lasallia pustulata.
The results of SERS analysis on the samples from the Vienna Genesis and Cod. Ser. n. 2804 are shown in figure 9. Raman microscopy could disclose the molecular fingerprint for the fundamental orcein structures, shared by all the amino and hydroxy derivatives, Table 1. The main assignments are described next14; bands 517 cm-1 ascribed to δ(COC), 619 cm-1
attributed to δ(COO), 798 with a shoulder at approx. 820 cm-1 due to ν(CC), ν(CN),
14 Rosi, 2013; Doherty et al., 2014; Melo, 2016.
Fig. 4: Spectrofluorimetry spectra of folium, orchil, the parchment of the Vienna Genesis (folio 1, page 1) and of Cod. Ser. n. 2804. The spectrum of undyed parchment is included.
Fig. 5: Representative excitation spectra for the reddish purple colour on parch-ment in the Vienna Genesis, acquired on a micro-sample.
Fig. 6: Representative emission spectra for the reddish purple colour on parch-ment in the Vienna Genesis, acquired on a micro-sample.
Fig. 7: Excitation spectra of parchment dyed with
Lasallia pustulata, for
0 h and 167 h irradiation time (Xenon lamp, lirr ≥
δ(CCN) and δ(CNC), 1180 cm-1 assigned to ν(C–O), ν(CC) and ν(CN), 1413 cm-1 δ(CH 2)
and δ(CH3), 1494–1521 cm-1 given by δ(NH) and ν(C=C) aromatic and 1635 cm-1 due to
ν(C=O), δ(OH) [44, 46]. The Raman spectrum concours with the results obtained for the SERS spectra of the lichen reference samples extracted from parchment dyed with Lasallia
Fig. 8: Emission spectra of parchment dyed with
Lasallia pustulata, for
0 h and 167 h irradiation time (Xenon lamp, lirr ≥
320 nm).
Fig. 9: SERS spectra of the red-dish-purple colour, on parchment of the Vienna Genesis compared with the parchment references dyed with Rocella tinc-toria and with Lasallia pustulata as well as with the parchment of Cod. Ser. n. 2804. The Ag col-loid used in the analysis is also depicted.
pustulata and with Roccella tinctoria, figure 9, thus unequivocally confirming the results
obtained with FORS and fluorimetry, figures 2 to 8. A distinctive feature of the SERS mechanism is that it highlights the molecule with the highest affinity for silver nanopar-ticles, sometimes excluding other molecules. So, while the presence of orchil is definitely confirmed, the presence of other molecules, with lower affinity, cannot be excluded.
One final word can be said regarding the presence of bromine in parchment. As men-tioned above, this element was previously reputed to be a marker for shellfish purple, but it is now known to also occur in orchil, particularly from that produced from coastal-sourced lichen species. XRF analysis was carried out in situ with a portable instrument in order to verify the content of bromine in the purple parchment of the Vienna Genesis. The results demonstrated that the amount of bromine is not at all compatible with that expected in the event of the presence of shellfish purple. A further step could be the evaluation of its concentration: it has been suggested15 that coastal-sourced lichen species could have
higher amounts of bromine than inland-sourced species. At low concentration, however, the identification – and therefore the determination of its concentration – is difficult since its peak is very close to the one of mercury (Hg). In addition, given the relative scarceness of available data, at present there are no absolute values to be used for stating whether a sample of orchil comes from a coastal-sourced rather than an inland-sourced species. As an indication, the amount of bromine in the parchment of the Vienna Genesis seems to be very low, suggesting – but this information must be regarded with extreme care – that orchil had been produced from inland-sourced lichen.
Colour of the parchment of the Vienna Genesis
The colour of the parchment folios of the Vienna Genesis appears more brownish-red than purple. The hue is coherent with the use of orchil which is a reddish dye, and similar to the faded orchil samples described in the chapter on purple dyeing. According to the results of non-invasive and micro invasive analysis, all folios were systematically coloured with orchil. This colour is relatively homogeneous throughout the manuscript, but some differences can be noted regarding the tone. The hues can be grouped in three categories, ranging from darker and medium to light purple, see chapter on conservation. Darker and paler zones also occur inside the same page of a folio.
The fact that all folios were coloured with orchil is demonstrated by the FORS spectra shown in figure 10. Spectra are in Kubelka-Munk or F(R) coordinates, obtained through 15 Aceto et al., 2015.
the transformate F(R) = (1-R)2/2R. The Kubelka-Munk function allows appreciating
dif-ferences due to the concentration of the absorbing species, orchil in this case. It can be seen that, despite the differences in tone of the respective folios, all FORS spectra show the same features, that is two maxima at approx. 542 and 586 nm, typical to orchil. The differences in the spectra can be explained in terms of residual concentration of the dye on parchment.
After considering the differences potentially introduced by the action of artisans, the ef-fects of the environment must be considered. Orchil is not a lightfast but rather a fugitive dye, i. e. it can fade due to the action of light. In addition, its hue is strongly dependent on pH16 and redox conditions. Exposure to light, contact with chemical substances (from
cleaning products to any kind of chemically active substrate, such as wine, vinegar, etc.) and proliferation of microorganisms are all possible causes for the occurrence of darker and paler areas. A further element of variation could be the preparation of orchil from lichens. As mentioned earlier, this dye was extracted from several species by soaking lichen scraps 16 Consider that a polymeric form of orchil, the so-called litmus, is nowadays exploited in litmus
paper.
in ammonia for at least three weeks. The procedure, though managed with expertise by the artisans, was not an industrial process and was therefore subject to some variations from one batch to another, or from one craftsman to another. Finally, the possible use of different lichen species must be considered depending on the availability of raw materials. Summary and conclusion
Raman microscopy disclosed the molecular fingerprint for the fundamental orcein struc-tures shared by all the amino and hydroxy derivatives, and present in parchment samples dyed with lichens such as Roccella tinctoria and Lasallia pustulata, table 1a and figure 9. These conclusions were obtained comparing the reddish-purple parchment with unaged reference samples. On the other hand, aged references of dyed parchment presented us with further insights into the lichen species used. Micro-spectrofluorimetry showed that the closest match to the historical parchment was obtained with an aged reference sample dyed with Lasallia pustulata (Fig. 7 and 8). Therefore, the lichen used to dye the Vienna Genesis folios would have dyeing properties more like Lasallia pustulata. This technique also indicated the presence of another type of chromophore that for the moment could not be characterised by a chemical structure. Overall, the spectroscopic techniques applied in situ indicated the presence of an orchil-dyed parchment, and Raman microscopy (through SERS) provided the dye fingerprint. At this stage, therefore, the identification of orchil on the parchment of the Vienna Genesis is indisputable.
Literature
Aceto, M. 2018. Unpublished data.
Aceto, M., A. Idone, A. Agostino, G. Fenoglio, M. Gulmini, P. Baraldi, and F. Crivello. 2014. Non-invasive investigation on a VI century purple codex from Brescia, Italy.
Spec-trochimica Acta A 117: 34–41.
Aceto, M., A. Arrais, F. Marsano, A. Agostino, G. Fenoglio, A. Idone, and M. Gulmini. 2015. A diagnostic study on folium and orchil dyes with non-invasive and micro-de-structive methods. Spectrochimica Acta A 142: 159–168.
Aceto, M., A. Agostino, G. Fenoglio, A. Idone, F. Crivello, M. Griesser, F. Kirchweger, K. Uhlir, and P. Roger Puyo. 2017. Analytical investigations on the Coronation Gospels manuscript. Spectrochimica Acta A 171: 213–221.
Sci-ence and Art: a fourteenth-century winter Breviary from Alcobaça scriptorium. Journal
of Medieval Iberian Studies: 252–282.
Caffaro, A. 2003. Scrivere in oro: Ricettari medievali d’arte e artigianato (secoli IX–XI):
Co-dici di Lucca e Ivrea. Napoli: Liguori.
Diadick Casselman, K. 2001. Lichen dyes. The new source book. New York: Dover Publica-tion.
Diringer, D. 1967. The illuminated book: its history and production. London: Faber.
Doherty, B., Gabrieli, F., Clementi, C., Cardon, D., Sgamellotti, A., Brunetti, B., and Miliani, C. 2014. Surface enhanced Raman spectroscopic investigation of orchil dyed wool from Roccella tinctoria and Lasallia pustulata. J. Raman Spectrosc.: 723–729. Furlan, I. 1998. Introduzione ai codici purpurei. In La porpora. Realtà e immaginario di un
colore simbolico, ed. O. Longo, 317–337. Venezia: Istituto Veneto di Scienze.
Idone, A., I. Miletto, P. Davit, M. Aceto, E. Prenesti, and M. Gulmini. 2017. Direct flu-orimetric characterisation of dyes in ancient purple codices. Microchemical Journal 135: 122–128.
Kok, A. 1966. A short history of the orchil dyes. The Lichenologist 3: 248–272. Laurie, A.P. 1914. The pigments and mediums of the Old Masters. London: Macmillan. Lee, P.C., and D. Meisel. 1982. Adsorption and surface-enhanced Raman of dyes on silver
and gold sols. Journal of Physical Chemistry 86: 3391–3395.
Maravelaki-Kalaitzaki, P., and N. Kallithrakas-Kontos. 2003. Pigment and terracotta an-alyses of Hellenistic figurines in Crete. Analytica Chimica Acta 497: 209–225.
Marconcini, M.M. 2012. Procedimenti nell’Alphabetum Romanum di Felice Feliciano. In
Oro, argento e porpora, ed. S. Baroni, 107–111. Trento: Tangram Edizioni Scientifiche.
Melo, M.J., P. Nabais, M. Guimarães, R. Araújo, R. Castro, M.C. Oliveira, and I. Whit-worth. 2016. Organic dyes in illuminated manuscripts: a unique cultural and historic record. Phil. Trans. R. Soc. A., 374: 20160050:1–20; theme issue “Raman Spectroscopy at the Arts/Science Interface: Applications in Art and Archaeological Analysis”.
Porter, C., G. Chiari, and A. Cavallo. 2002. The analysis of eight manuscripts and frag-ments from the fifth/sixth century to the twelfth century, with particular reference to the use of and identification of “real purple” in manuscripts. In Art 2002: Proceedings
of the 7th International Conference on Non-Destructive Testing and Microanalysis for the Diagnostics and Conservation of the Cultural and Environmental Heritage, eds. R. Van
Grieken, K. Janssens, L. Vanʼt dack, G. Meersman, 2. Antwerp: University of Antwerp. Porter, C. 2008. The identification of purple in manuscripts. In Dyes in History and
Ar-chaeology, Vol. 21, ed. J. Kirby, 59–64. London: Archetype Publications.
Roger, P. 2007. Étude des couleurs et de la pratique picturale. Art de l’enluminure 20: 46– 65.
Roger Puyo, P. 2013. Les pigments et la technique picturale des Évangiles de Saint-Riquier.
Art de l’enluminure 46: 34–39.
Rosi, F., C. Clementi, M. Paolantoni, A. Romani, R. Pellegrino, B.G. Brunetti, W. Nowik, and C. Miliani. 2013. Study of Raman scattering and luminescence properties of orchil dye for its nondestructive identification on artworks. Journal of Raman Spectroscopy 44: 1451–1456.
Thomas, M., and F. Flieder. 1980. La composition des parchemins pourprés démystifiée par la chromatographie en phase gazeuse. In La vie mystérieuse des chefs-d’oeuvres: la
science au service de l’art, ed. M. Hours, 232–233. Paris: Réunion des Musées Nationaux.
Thompson, D.V. 1956. The materials and techniques of Medieval painting. New York: Dover. Contribution of the authors
Prof. Maurizio Aceto carried out FORS and spectrofluorimetry measurements. Dr. Elisa Calà carried out FORS, spectrofluorimetry and SERS measurements.
Prof. Maria J. Melo carried out micro-spectrofluorimetry and SERS in collaboration with Paula Nabais and Rita Araújo.